 INNO fibre optic temperature sensors ,temperature monitoring systems.
- Transformer hot-spot detection is the process of identifying and measuring the highest temperature point inside a power transformer winding — the single location where insulation degradation occurs fastest and where thermal failure is most likely to originate.
- The winding hot-spot temperature directly governs the rate of cellulose insulation aging: every 6°C increase above the design limit roughly doubles the aging rate, making accurate hot-spot measurement essential for maximizing transformer service life.
- Fluorescent fiber optic temperature sensors are the only technology capable of directly measuring the true winding hot-spot temperature at the conductor surface, eliminating the estimation errors inherent in traditional thermal image calculation methods.
- Indirect methods — including the IEC 60076-7 thermal model and top oil temperature plus gradient calculations — consistently underestimate or overestimate hot-spot temperatures by margins that can exceed 10–15°C under dynamic loading conditions.
- Deploying direct hot-spot detection with fluorescent fiber optic sensors enables utilities to safely increase transformer loading capacity, extend asset life through precise aging management, and avoid both premature replacement and unexpected thermal failure.
Table of Contents
- Defining Transformer Hot-Spot Temperature
- Where the Hot-Spot Forms Inside a Transformer Winding
- Why Hot-Spot Temperature Is the Most Critical Thermal Parameter
- Insulation Aging — The Direct Link to Hot-Spot Temperature
- Indirect Hot-Spot Estimation Methods and Their Limitations
- Direct Hot-Spot Measurement with Fluorescent Fiber Optic Temperature Sensors
- Comparing All Hot-Spot Detection Methods
- Practical Benefits of Accurate Hot-Spot Detection
- Installation, Commissioning, and Long-Term Reliability
- Standards and Industry Guidelines for Hot-Spot Temperature
- Frequently Asked Questions
1. Defining Transformer Hot-Spot Temperature

The term hot-spot temperature refers to the highest temperature occurring at any point within the winding conductors of an oil-immersed power transformer. It is not the average winding temperature, not the top oil temperature, and not the temperature measured by any gauge mounted on the exterior of the transformer tank. It is the peak thermal stress point — the specific location on a specific winding disc or layer where heat generation from load current losses combines with restricted oil cooling flow to produce the maximum conductor temperature in the entire transformer.
Why It Differs from Other Transformer Temperatures
A power transformer has multiple temperature measurements available. Top oil temperature is measured by a sensor in the oil at the top of the main tank. Bottom oil temperature is sometimes measured at the oil inlet to the coolers. Average winding temperature can be inferred from winding resistance measurements during offline tests. None of these values represent the actual peak temperature that the most thermally stressed point of the insulation system experiences. The winding hot-spot temperature is always higher — often significantly higher — than any of these other readings, and it is this peak value that determines the rate at which the transformer insulation ages and ultimately fails.
2. Where the Hot-Spot Forms Inside a Transformer Winding

Thermal Gradient Within the Winding
Oil-immersed transformer windings are cooled by the natural or directed flow of insulating oil through cooling ducts between winding discs or layers. The oil enters the winding assembly at the bottom — relatively cool after passing through the radiators or coolers — and rises as it absorbs heat from the current-carrying conductors. By the time the oil reaches the upper portion of the winding, it has already absorbed substantial heat and its cooling capacity is reduced. Simultaneously, certain winding regions experience higher localized losses due to eddy current effects and stray flux concentrations.
Typical Hot-Spot Locations
In most oil-immersed power transformers, the hot-spot is located in the upper section of the winding, typically within the top 10–20% of the winding height. For disc-type windings, the hot-spot commonly appears in one of the top several discs of the inner (low-voltage) winding or the regulating winding, where eddy current losses are amplified by the leakage flux pattern. The precise location depends on the specific winding geometry, conductor dimensions, duct spacing, oil flow arrangement, and the presence of any flow-directing washers or barriers.
The Role of Eddy Current Losses
The total winding loss at any point consists of resistive (I²R) loss plus eddy current loss. Eddy current losses are caused by the leakage magnetic field penetrating the conductor cross-section and inducing circulating currents within the conductor itself. These losses are not uniformly distributed — they concentrate at winding ends and at locations where the leakage field is strongest. A conductor experiencing high eddy current losses generates more heat per unit length than a conductor carrying only resistive loss, contributing disproportionately to the local temperature rise.
Oil Flow Restrictions
Manufacturing tolerances, spacer placement, and oil flow design all influence local cooling effectiveness. A slightly narrower cooling duct, a misaligned spacer block, or an air pocket trapped during oil filling can restrict local oil flow, reduce heat removal from that specific section, and create a localized hot-spot that may not have been predicted by the original thermal design calculations.
3. Why Hot-Spot Temperature Is the Most Critical Thermal Parameter
The Weakest Link Principle
Transformer insulation is a series system — its overall reliability is determined by the condition of its weakest point, not by its average condition. A transformer can have an average winding temperature well within safe limits while simultaneously experiencing a hot-spot temperature that is degrading the insulation at an accelerated rate at one specific location. When that one location eventually fails — through turn-to-turn short circuit or breakdown to ground — the entire transformer fails. This is why the hot-spot, not the average temperature, is the governing parameter for thermal design, loading limits, and remaining life estimation.
Loading Capacity Depends on Hot-Spot Temperature
The permissible loading on a transformer is ultimately limited by the winding hot-spot temperature. International loading guides — including IEC 60076-7 and IEEE C57.91 — define continuous and emergency overload ratings based on the resulting hot-spot temperature. If the hot-spot temperature can be measured directly rather than estimated, operators gain the ability to load the transformer more confidently, using actual measured margins rather than conservative calculated margins that include safety factors to compensate for estimation uncertainty.
4. Insulation Aging — The Direct Link to Hot-Spot Temperature
Cellulose Degradation Kinetics
The solid insulation in an oil-immersed transformer consists primarily of cellulose-based materials — kraft paper wound around conductors and pressboard used for structural insulation components. Cellulose degrades through a chemical process called depolymerization, in which the long cellulose polymer chains break into shorter chains. This process is driven predominantly by temperature, with secondary contributions from moisture and oxygen content in the oil. The relationship between temperature and degradation rate follows the Arrhenius equation — an exponential function that produces a dramatic acceleration in aging with relatively small temperature increases.
The 6°C Doubling Rule
A widely cited rule of thumb states that every 6°C increase in hot-spot temperature above the nominal design value approximately doubles the insulation aging rate. While the exact doubling interval depends on the specific cellulose grade and oil chemistry, the underlying principle is robust: operating a transformer with a hot-spot temperature just 12°C above its design limit produces roughly four times the normal aging rate. Over a period of years, this compounding effect dramatically shortens the transformer’s useful life.
Degree of Polymerization as the Aging Metric
The standard metric for cellulose insulation condition is the degree of polymerization (DP). New insulation has a DP value of approximately 1000–1200. As the cellulose ages, the DP value decreases. When the DP drops below approximately 200, the paper becomes brittle and loses its mechanical strength, making it unable to withstand the electromagnetic forces experienced during through-fault events. At this point, the transformer is at high risk of winding failure, even if it continues to operate normally under steady-state conditions.
Calculating Cumulative Loss of Life
Using continuous hot-spot temperature data, engineers can calculate the cumulative loss of insulation life over any period using the aging rate equations defined in IEC 60076-7. This calculation integrates the instantaneous aging rate — which varies with the hot-spot temperature at each moment — over time. The result is expressed as an equivalent number of hours of aging at the rated hot-spot temperature. This metric is far more informative than simply counting calendar years of service.
5. Indirect Hot-Spot Estimation Methods and Their Limitations
The IEC 60076-7 Thermal Model
The most widely used indirect method for estimating winding hot-spot temperature is the thermal model described in IEC 60076-7. This model calculates the hot-spot temperature as the sum of three components: ambient temperature plus top oil temperature rise plus hot-spot-to-top-oil gradient. The model uses factory heat run test data and real-time measurements of load current and top oil temperature to estimate the hot-spot dynamically.
Inherent Limitations of Thermal Models
While the IEC thermal model provides a reasonable approximation under steady-state conditions, it has well-documented limitations under dynamic and overload conditions. The model relies on a single hot-spot factor (H) determined during the factory heat run test, which is conducted at rated load under controlled conditions. In actual service, the hot-spot factor varies with load level, load history (thermal time constants), ambient temperature profile, cooling mode changes, and oil aging. Published studies and field measurements have shown discrepancies of 10–15°C or more between the model output and directly measured hot-spot values during transient overloads and rapid load changes. For a parameter where a 6°C error can double the calculated aging rate, this level of uncertainty is significant.
Winding Temperature Indicators (WTI)
A winding temperature indicator (WTI) is a traditional device that uses a thermal replica — a resistive heating element powered by a current transformer in proportion to the load current — immersed in a bulb located in the top oil. The WTI reading approximates the hot-spot temperature but is subject to calibration drift, thermal lag, and inaccuracy under rapidly changing loads. Many utilities still rely on WTIs, but these devices provide an estimation, not a direct measurement.
6. Direct Hot-Spot Measurement with Fluorescent Fiber Optic Temperature Sensors
Operating Principle of Fluorescent Fiber Optic Sensing
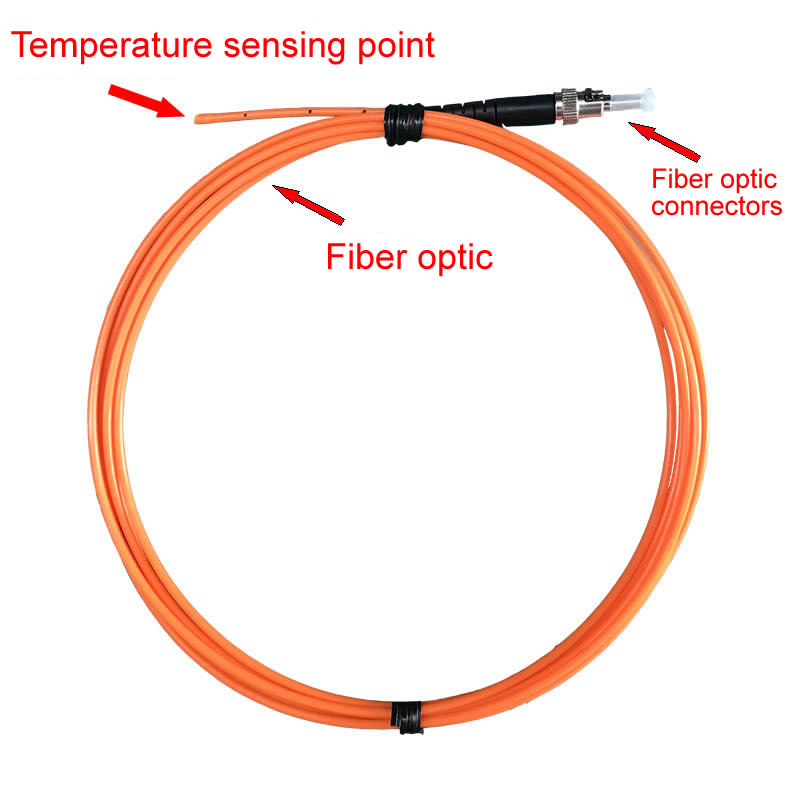
Fluorescent fiber optic temperature sensors operate on the principle of temperature-dependent fluorescence decay time. A small phosphorescent sensor probe — typically a rare-earth phosphor compound bonded to the tip of an optical fiber — is attached directly to the surface of the winding conductor at the predicted hot-spot location. An optoelectronic unit located outside the transformer sends a pulse of excitation light through the optical fiber to the sensor probe. The phosphor absorbs the excitation light and re-emits fluorescent light at a different wavelength. The time constant of the fluorescence decay is a precise and repeatable function of the probe temperature.
Why This Technology Is Uniquely Suited for Transformer Windings
The optical fiber and sensor probe are constructed entirely from non-metallic, non-conductive materials — glass fiber and ceramic phosphor. This construction provides complete immunity to the intense electromagnetic fields present inside a transformer winding, eliminates any risk of the sensor creating a short-circuit path between turns or between the winding and ground, withstands the full dielectric stress between the winding and all other conductive structures, is chemically compatible with transformer insulating oil for decades of immersion, and introduces no interference with the transformer’s electrical performance.
Measurement Accuracy and Response Time
Modern fluorescent fiber optic temperature measurement systems achieve accuracies of ±1°C or better over a measurement range that typically spans from −40°C to +200°C, covering the full operating range of any power transformer. The response time — the speed at which the sensor tracks temperature changes — is typically a few seconds, which is more than adequate to capture thermal transients during load changes and overload events.
Multi-Point Measurement Capability
A single fluorescent fiber optic temperature monitoring unit can support multiple sensor channels — typically 4, 8, or 16 channels per unit. This allows multiple sensor probes to be installed at different locations within the winding structure — at the predicted hot-spot, at secondary thermal risk points, and at reference locations for comparison. Multi-point measurement provides a comprehensive thermal profile rather than a single-point reading, enabling engineers to validate thermal design models and detect unexpected localized heating.
Integration with Transformer Monitoring Systems
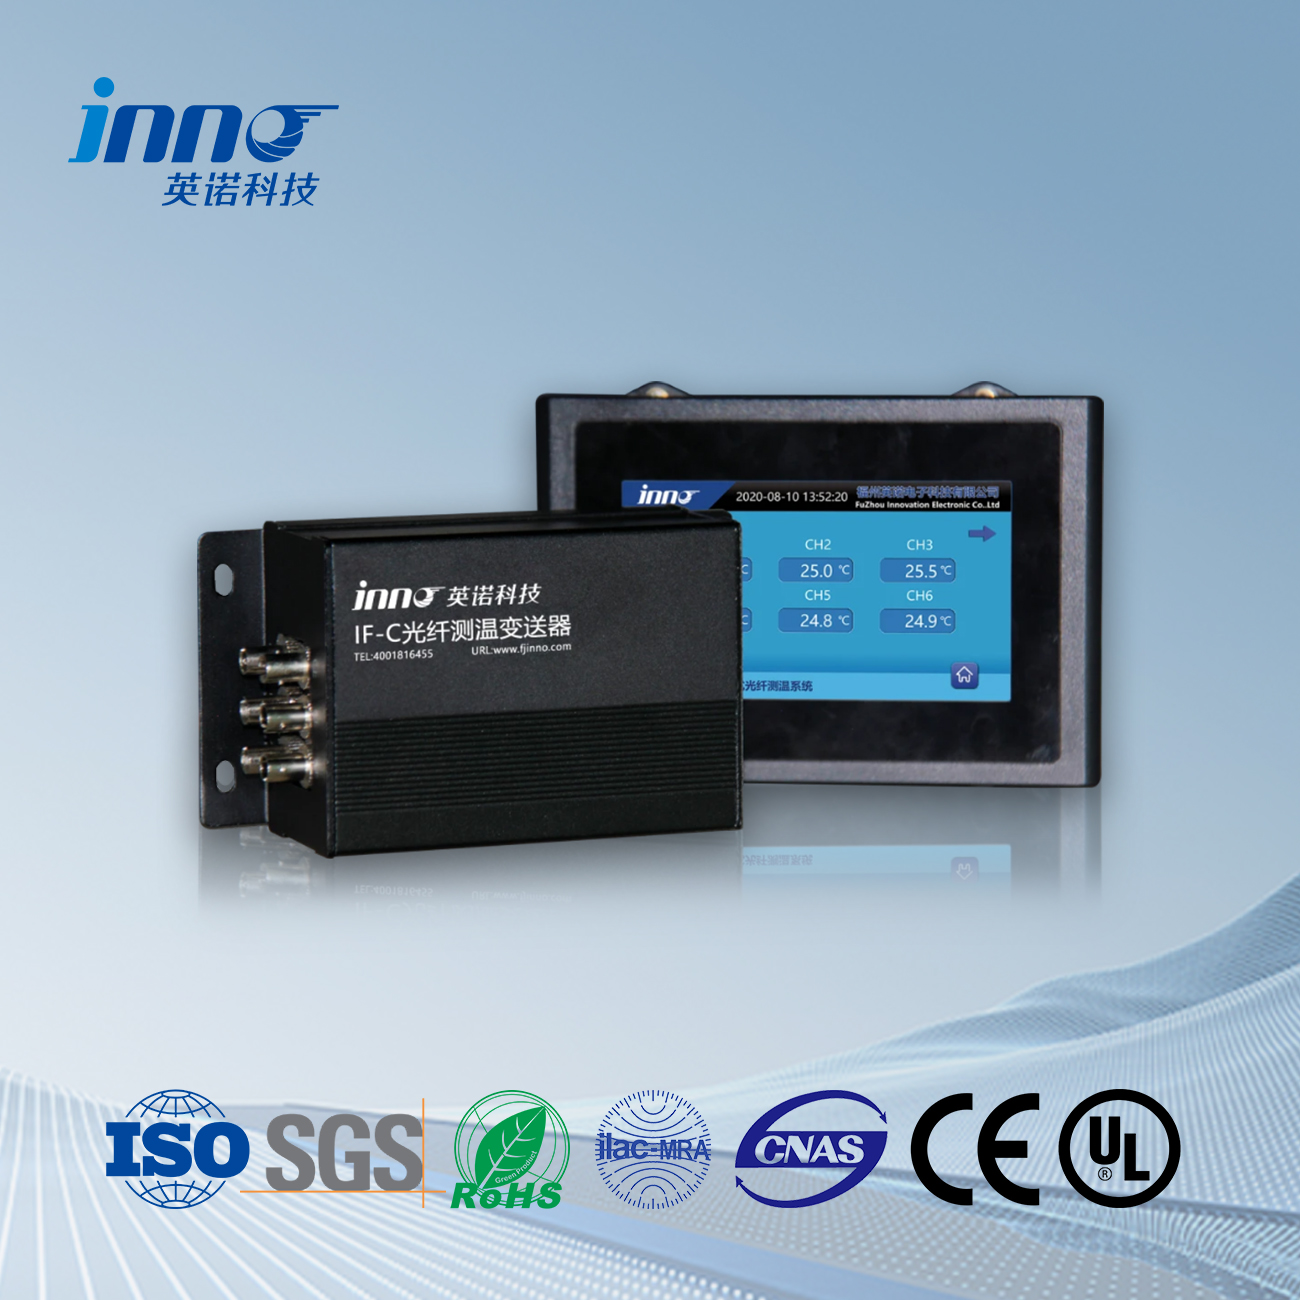
The optoelectronic measurement unit provides standard analog (4–20 mA) and digital (Modbus, IEC 61850, DNP3) output interfaces, allowing seamless integration with transformer online monitoring systems, SCADA networks, and asset performance management platforms. Hot-spot temperature data can be combined with dissolved gas analysis (DGA) data, oil moisture content, and bushing condition data to provide a holistic view of transformer health.
7. Comparing All Hot-Spot Detection Methods
Thermal Model Calculation vs. Direct Fiber Optic Measurement
The IEC 60076-7 thermal model provides a cost-effective hot-spot estimation for transformers where direct sensors were not installed during manufacturing. It requires no physical sensor inside the transformer and can be retrofitted to any unit with load current and top oil temperature inputs. However, its accuracy degrades under dynamic loading, it cannot detect localized cooling anomalies, and it relies on factory test data that may not reflect the transformer’s current aged condition.
Fluorescent fiber optic temperature sensors provide the true conductor surface temperature at the measurement point. The data is not an estimate — it is a direct physical measurement. The primary limitation is that the sensors must be installed during transformer manufacturing because they are placed inside the winding structure before the transformer is assembled and tanked. Retrofitting fiber optic sensors to an existing in-service transformer is impractical without a complete factory rewind.
Winding Temperature Indicator (WTI) vs. Fiber Optic Sensors
The WTI thermal replica approach provides a single approximate value with significant thermal lag and calibration uncertainty. Fluorescent fiber optic sensors provide multi-point true temperature data with fast response and high accuracy. For any new transformer procurement where hot-spot temperature management is a priority, specifying fiber optic sensors at the time of order is the clear best practice.
Distributed Temperature Sensing (DTS) vs. Fluorescent Point Sensors
Distributed fiber optic temperature sensing (DTS) systems use Raman or Brillouin scattering along a continuous optical fiber to measure temperature profiles over long distances. While DTS is valuable for power cable monitoring, its spatial resolution (typically 0.5–1.0 m) and temperature resolution (typically ±1–2°C) are insufficient for precise winding hot-spot detection where the hot-spot zone may span only a few centimeters. Fluorescent point sensors with ±1°C accuracy at a defined location remain the preferred technology for transformer winding hot-spot applications.
8. Practical Benefits of Accurate Hot-Spot Detection
Increased Loading Confidence
When the winding hot-spot temperature is known by direct measurement rather than estimation, operators can apply overload capacity with confidence. The conservative safety margins embedded in thermal model calculations to compensate for estimation uncertainty become unnecessary when the actual hot-spot is being measured in real time. This additional loading margin can be worth millions of dollars in deferred capital expenditure on new transformers.
Extended Asset Life Through Precise Aging Management
With continuous fluorescent fiber optic temperature data, engineers calculate actual cumulative insulation loss-of-life rather than estimated loss-of-life. This enables precise scheduling of maintenance interventions — such as oil processing to remove moisture and contaminants — timed to when they deliver maximum benefit to insulation longevity rather than on a fixed calendar schedule.
Early Fault Detection
An unexpected increase in hot-spot temperature that does not correlate with load or ambient changes can indicate a developing fault condition — such as a blocked cooling duct, a failed oil pump, a circulating current in the core, or a developing turn-to-turn insulation deficiency. Direct measurement catches these anomalies immediately, long before they would be detected by top oil temperature sensors or periodic offline inspections.
Validating Thermal Design Models
Direct hot-spot data provides transformer manufacturers and utility engineers with field-measured evidence to validate and refine thermal design models. This feedback loop improves the accuracy of thermal designs for subsequent transformer procurements and strengthens the engineering basis for loading guide calculations.
9. Installation, Commissioning, and Long-Term Reliability
Factory Installation Process
Fluorescent fiber optic temperature sensors are installed during the transformer winding process at the manufacturing facility. The sensor probes are bonded to the conductor surface at the designated measurement locations using high-temperature adhesive. The optical fibers are routed through the winding structure, through the insulation barriers, and out through a sealed fiber optic feed-through fitting in the transformer tank wall. The routing must protect the fibers from mechanical damage during winding assembly, core-and-coil stacking, tanking, and oil filling.
Commissioning Verification
During factory acceptance testing and site commissioning, each fiber optic channel is verified for optical continuity, measurement accuracy is confirmed against a reference temperature source, and the sensor readings are compared with heat run test results. Any fiber that has been damaged during transportation or installation is identified at this stage.
Long-Term Reliability in Service
Field experience spanning over two decades has demonstrated that fluorescent fiber optic sensors installed in power transformers maintain their measurement accuracy and optical integrity over the expected 30–40 year service life of the transformer. The glass fiber and phosphor probe materials are chemically inert in transformer oil environments and are not subject to the drift or degradation mechanisms that affect electronic sensors.
10. Standards and Industry Guidelines for Hot-Spot Temperature
IEC and IEEE Loading Guides
IEC 60076-7 (Power Transformers — Part 7: Loading Guide for Mineral-Oil-Immersed Power Transformers) and IEEE C57.91 (Guide for Loading Mineral-Oil-Immersed Transformers and Step-Voltage Regulators) are the two primary international standards that define permissible hot-spot temperature limits for various loading scenarios. Both standards define a rated hot-spot temperature rise limit (typically 65°C rise over ambient for most designs), emergency overload hot-spot limits, and equations for calculating insulation aging rate as a function of hot-spot temperature.
IEC 60076-2 Temperature Rise Tests
IEC 60076-2 defines the factory heat run test procedures used to verify transformer temperature rises. When fluorescent fiber optic sensors are installed, the factory heat run test provides a direct comparison between the measured hot-spot and the value calculated by the thermal model — a valuable baseline for future online monitoring.
IEEE C57.155 Guide for Fiber Optic Sensors
IEEE C57.155 (Guide for Interpretation of Gases Generated in Natural Ester and Synthetic Ester-Immersed Transformers) is supplemented by IEEE C57.150 and related guidelines that address the application of fiber optic temperature sensors in liquid-immersed transformers. These documents provide guidance on sensor selection, installation practices, and measurement interpretation.
CIGRE Technical Brochures
CIGRE Working Groups have published multiple technical brochures addressing transformer thermal modeling and hot-spot measurement, including validation studies comparing fluorescent fiber optic sensor measurements with thermal model predictions. These publications represent the collective expertise of transformer engineers worldwide and consistently endorse direct fiber optic measurement as the most reliable method for hot-spot determination.
Frequently Asked Questions
What exactly is a transformer hot-spot?
A transformer hot-spot is the single location within the winding structure where the conductor temperature reaches its maximum value. It results from the combination of localized winding losses and local oil cooling conditions. This point experiences the fastest insulation aging and is the most likely origin of thermal failure.
Can the hot-spot be measured without fiber optic sensors?
It can be estimated using thermal models based on IEC 60076-7 or by winding temperature indicators (WTIs), but it cannot be directly measured without sensors placed inside the winding. Only fluorescent fiber optic temperature sensors provide a true direct measurement of conductor surface temperature inside the winding.
Why can’t infrared cameras measure the winding hot-spot?
Infrared thermal imaging cameras can only see external surfaces — the transformer tank, bushings, and radiators. They cannot see through the steel tank wall to the winding conductors submerged in oil inside. Infrared is useful for detecting external anomalies such as blocked radiators or overheating connections, but it has no capability to measure internal winding temperatures.
Can fiber optic sensors be added to an existing transformer?
In almost all cases, no. The sensors must be installed on the winding conductors during the manufacturing process before the core-and-coil assembly is placed in the tank. Retrofitting would require removing the transformer from service, draining the oil, untanking the core-and-coil assembly, and partially disassembling the windings — essentially a factory rewind. For existing transformers without fiber optic sensors, the IEC thermal model remains the practical alternative.
How many sensors are typically installed per transformer?
The number varies depending on the transformer design and the owner’s specification. A common configuration is 2–4 sensors per winding (LV, HV, and regulating winding), targeting the predicted hot-spot location and one or two secondary thermal risk points. A multi-channel fluorescent fiber optic measurement unit supporting 8–16 channels can accommodate all sensor points on a single transformer.
What happens if a fiber optic sensor fails in service?
A fiber optic sensor failure — typically caused by fiber breakage from external mechanical damage — results in a loss of signal on that channel. The measurement unit reports the fault, and the remaining channels continue to operate independently. The transformer itself is unaffected because the sensor is completely passive and electrically inert. The lost measurement point can be compensated by thermal model calculation using the remaining sensor data as calibration references.
How does hot-spot temperature affect transformer loading decisions?
Loading guides such as IEC 60076-7 define permissible overload levels and durations based on the resulting winding hot-spot temperature. With direct hot-spot measurement from fluorescent fiber optic sensors, operators see the actual hot-spot in real time and can load the transformer up to the defined limit with confidence, rather than applying conservative derating to compensate for estimation uncertainty.
Is hot-spot monitoring required by regulation?
Most jurisdictions do not mandate hot-spot monitoring by regulation. However, many utility procurement specifications now require fluorescent fiber optic sensors as a standard feature for new power transformers above a certain MVA rating — typically 100 MVA and above. The practice is increasingly viewed as standard good engineering rather than an optional enhancement.
What is the typical accuracy of fluorescent fiber optic temperature sensors?
Modern fluorescent fiber optic temperature sensors deliver measurement accuracy of ±1°C across the full operating range (typically −40°C to +200°C). This level of accuracy is maintained over the entire service life of the sensor without recalibration, which is a significant advantage over electronic temperature sensing technologies that require periodic recalibration.
How does hot-spot data integrate with dissolved gas analysis (DGA) monitoring?
Hot-spot temperature and DGA are complementary diagnostic parameters. Elevated hot-spot temperatures accelerate oil and cellulose decomposition, which produces dissolved gases detectable by DGA. Correlating rising gas trends with hot-spot temperature data helps engineers distinguish between thermal faults (indicated by hot-spot exceedances) and electrical faults (indicated by partial discharge-related gases) — improving diagnostic accuracy and maintenance decision quality.
Disclaimer: The information presented in this article is for general educational and informational purposes only and does not constitute professional engineering advice. Always consult qualified power systems engineers and comply with applicable local standards and regulations when specifying, procuring, installing, or operating transformer monitoring equipment. www.fjinno.net assumes no liability for any decisions or actions taken based on the content of this article.

Fiber optic temperature sensor, Intelligent monitoring system, Distributed fiber optic manufacturer in China
 |
 |
 |