 INNO fibre optic temperature sensors ,temperature monitoring systems.
- Cooling system failures cause 40-55% of transformer overheating incidents, making proactive temperature monitoring essential for reliability
- Traditional fixed-speed fans and pumps waste 30-45% energy compared to intelligent demand-based cooling control systems
- Fluorescent fiber optic sensors are optimal for oil-immersed transformers to directly measure winding hotspot temperatures up to 200°C
- Pt100 RTD sensors provide reliable temperature monitoring for dry-type transformers with cost-effective precision for fan control applications
- Real-time hotspot temperature monitoring extends transformer lifespan by 8-12 years through reduced thermal stress
- Intelligent cooling systems reduce operating costs by 15-35% while maintaining optimal thermal management
- This guide covers sensor technologies, installation methods, SCADA integration, and proven case studies for transformer cooling optimization
Table of Contents
- Transformer Cooling Temperature Monitoring Fundamentals & Hotspot Management Importance
- Oil-Immersed & Dry-Type Transformer Cooling Methods with Temperature Monitoring Requirements
- Limitations of Traditional Temperature Control in Thermal Management
- Modern Transformer Temperature Monitoring Technologies & Hotspot Sensor Solutions
- Oil-Immersed Transformer Fluorescent Fiber Optic Temperature Monitoring Configuration
- Dry-Type Transformer Pt100 Temperature Monitoring & Fan Cooling Control Systems
- Temperature Monitoring System Installation, Commissioning & SCADA Thermal Management Integration
- Global Transformer Temperature Monitoring & Cooling Optimization Case Studies
- Frequently Asked Questions: Temperature Monitoring & Hotspot Management
1. Transformer Cooling Temperature Monitoring Fundamentals & Hotspot Management Importance
1.1 Transformer Hotspot Temperature Formation Mechanism & Cooling System Role
Understanding how hotspot temperatures develop within transformer windings is fundamental to effective thermal management. In power transformers, electrical losses generate heat concentrated at specific locations—primarily in winding conductors where current density is highest. The cooling system serves as the critical mechanism for dissipating this heat to prevent insulation degradation.
Heat transfer occurs through three sequential stages: first, heat conducts from the copper winding into the surrounding cooling medium (mineral oil, silicone fluid, or air); second, the heated medium rises through natural convection or forced circulation; finally, heat dissipates to the ambient environment through radiators, heat exchangers, or direct air cooling. For oil-immersed transformers, mineral oil provides excellent heat transfer with thermal conductivity around 0.13 W/m·K, while dry-type transformers rely on air’s lower conductivity of 0.026 W/m·K, necessitating larger temperature differentials.
The critical distinction between natural cooling (ONAN/AN) and forced cooling (ONAF/AF) lies in heat transfer efficiency. Natural convection relies solely on buoyancy-driven fluid motion, providing baseline cooling capacity. Adding fans or pumps increases heat transfer coefficients by 2-3 times, enabling the same transformer to handle significantly higher loads—typically 130-150% of ONAN rating for ONAF configurations.
| Cooling Method | Heat Transfer Coefficient | Capacity Range | Efficiency Rating |
|---|---|---|---|
| ONAN (Oil Natural Air Natural) | 8-12 W/m²K | <10 MVA | Baseline 100% |
| ONAF (Oil Natural Air Forced) | 18-25 W/m²K | 10-100 MVA | 130-150% |
| OFAF (Oil Forced Air Forced) | 35-50 W/m²K | 50-250 MVA | 180-220% |
| ODAF (Oil Directed Air Forced) | 60-85 W/m²K | >100 MVA | 250-300% |
1.2 Cooling Failures Leading to Winding Temperature Rise & Insulation Aging Risks
![]()
Cooling system malfunctions represent the primary cause of catastrophic transformer failures. When a single cooling fan fails in an ONAF system, local oil temperature can increase 8-15°C within 30 minutes under heavy load. This seemingly modest rise has severe consequences: according to the Arrhenius equation governing insulation aging, every 6-8°C increase in hotspot temperature doubles the aging rate of cellulose paper insulation.
Field data from utility operators reveals that undetected cooling failures contribute to 40-55% of unexpected transformer outages. A documented case involved a 230 kV, 180 MVA autotransformer where two of six cooling fans failed simultaneously during peak summer load. The top oil temperature exceeded 95°C, and estimated winding hotspot reached 128°C—well beyond the 110°C continuous rating. Post-failure analysis showed the transformer consumed 15 years of normal insulation life in just 72 hours of operation at elevated temperatures.
Economic Impact of Inadequate Temperature Monitoring
The financial consequences extend beyond equipment replacement costs. A 100 MVA power transformer failure typically incurs $2.5-4.5 million in direct costs (equipment + emergency replacement), plus $50,000-150,000 per day in lost revenue during the outage period. Comparative analysis shows that comprehensive cooling monitoring systems cost $35,000-75,000 installed—representing less than 2% of potential failure losses while providing continuous protection.
1.3 IEC & IEEE Standards for Temperature Limits & Hotspot Monitoring Requirements
International standards establish mandatory temperature thresholds to ensure transformer reliability. IEC 60076-2 and IEEE C57.12.00 define temperature rise limits based on insulation class and cooling method, with specific requirements for hotspot temperature monitoring in transformers rated above 2.5 MVA.
| Standard | Top Oil Temp Rise | Avg Winding Rise | Hotspot Rise | Ambient Reference |
|---|---|---|---|---|
| IEC 60076-2 (ONAN/ONAF) | 60°C | 65°C | 78°C | 20°C yearly avg |
| IEEE C57.12.00 (65°C Rise) | 65°C | 65°C | 80°C | 30°C max ambient |
| IEC 60076-11 (Dry-Type) | N/A | 100°C (Class F) | 115°C | 40°C max ambient |
Beyond continuous ratings, standards mandate alarm and trip settings. IEC 60076-7 recommends top oil temperature alarms at 90°C and trips at 105°C, with winding temperature alarms at 110°C and trips at 130°C. These thresholds assume functional cooling systems—highlighting why real-time cooling system monitoring is inseparable from temperature protection.
1.4 Real-Time Temperature Monitoring’s Economic Value for Dynamic Loading & Life Extension
Modern transformer temperature monitoring systems unlock two significant economic benefits: safe dynamic rating increase and extended asset lifespan through optimized thermal management.
Dynamic rating allows utilities to temporarily exceed nameplate capacity during peak demand periods by monitoring actual thermal conditions rather than relying on conservative assumptions. A utility-scale implementation study covering 87 substation transformers demonstrated 18-25% capacity increase during summer peaks without exceeding hotspot limits. This deferred the need for $12 million in new transformer purchases over a five-year period, while the monitoring system investment totaled $950,000.
Life Extension Through Thermal Optimization
Intelligent cooling control systems reduce cumulative thermal stress by maintaining temperatures within optimal bands. Instead of fixed-speed fans cycling on/off based on crude temperature switches, variable-speed control maintains steady thermal conditions. Field measurements show this reduces daily temperature cycling amplitude from 15-20°C to 5-8°C, which significantly decreases mechanical stress on winding insulation and paper degradation rates. Utilities report 8-12 year lifespan extensions on transformers equipped with advanced thermal management systems, translating to $200,000-400,000 in deferred replacement costs per unit.
2. Oil-Immersed & Dry-Type Transformer Cooling Methods with Temperature Monitoring Requirements
2.1 Oil Natural Air Natural (ONAN) Cooling: Oil Temperature Stratification & Hotspot Distribution

ONAN cooling systems rely entirely on natural convection—heated oil rises from windings to the top of the tank, transfers heat through radiators or corrugated tank walls, then descends as cooled oil returns to the bottom. This creates distinct temperature stratification with top oil typically 10-18°C hotter than bottom oil under full load.
Temperature monitoring in ONAN transformers focuses on three critical zones: top oil temperature measurement via Pt100 sensors in pockets near the tank cover, bottom oil temperature to assess thermal gradient, and ambient temperature for thermal margin calculation. Since no cooling equipment requires monitoring, these systems represent the simplest monitoring configuration—ideal for distribution transformers in the 50 kVA to 2.5 MVA range.
2.2 Oil Natural Air Forced (ONAF) Temperature Control Strategy & Fan Staging Control
ONAF transformers augment natural oil circulation with axial cooling fans mounted on radiators, delivering 30-50% capacity increase over ONAN ratings. Effective temperature control requires staged fan operation: first stage activates when top oil reaches 55-60°C, second stage at 65-70°C, and third stage (if equipped) at 75-80°C. This graduated approach prevents sudden temperature drops that stress tank seals and gaskets.
Critical monitoring parameters include individual fan motor current (detecting bearing failure or blade damage), vibration levels (predictive maintenance indicator), and runtime hours (maintenance scheduling). Temperature sensors must track both oil temperature and winding temperature—typically via indirect calculation using load current and thermal models, though direct winding hotspot measurement using fluorescent fiber optic sensors provides superior accuracy.
| Capacity Range | Fan Quantity | Temperature Points | Vibration Sensors | Control Strategy |
|---|---|---|---|---|
| 10-31.5 MVA | 4-6 fans | Top oil ×2, Winding ×2 | Optional | 2-stage control |
| 31.5-63 MVA | 6-10 fans | Top oil ×3, Winding ×4 | Recommended | 3-stage control |
| 63-100 MVA | 10-16 fans | Top oil ×4, Winding ×6 | Standard | Variable speed VFD |
2.3 Forced Oil Forced Air (OFAF/ODAF) Cooling: Oil Temperature & Flow Differential Monitoring
Large power transformers (50-500 MVA) employ forced oil circulation through dedicated pumps, pushing oil through external heat exchangers cooled by fans. OFAF systems use non-directed flow, while ODAF configurations incorporate internal ducting to direct cooled oil precisely through winding channels—critical for managing thermal gradients in units exceeding 100 MVA.
Temperature monitoring expands to include cooler inlet/outlet differential measurement, which indicates heat exchanger effectiveness. A healthy OFAF system maintains 8-15°C temperature drop across coolers under full load; values below 5°C suggest oil flow restrictions or fouled heat exchanger surfaces. Oil flow rate monitoring via electromagnetic or ultrasonic flowmeters ensures proper circulation—typical requirements range from 40-80 liters/minute per MVA depending on cooler design.
Pump Performance & Pressure Monitoring
Oil pump monitoring tracks motor current, discharge pressure (typically 0.8-2.5 bar), and vibration signatures. Differential pressure across winding cooling channels reveals flow distribution issues—uneven pressure drops exceeding 15% between phases indicate potential blockages requiring investigation. Advanced systems incorporate redundant pumps with automatic failover, making pump status monitoring critical for reliability.
2.4 Dry-Type Transformer Winding Hotspot Temperature Monitoring & Forced Air Cooling Control

Dry-type transformers eliminate oil fire risks but face more challenging thermal management due to air’s inferior heat transfer properties. Class F insulation (155°C rating) and Class H (180°C) materials allow higher operating temperatures, but require precise monitoring to prevent localized overheating in epoxy-encapsulated windings.
Embedded Pt100 RTD sensors installed during manufacturing provide direct winding temperature measurement—typically 3-6 sensors per phase positioned at calculated hotspot locations. These sensors connect to temperature controllers that activate cooling fans when winding temperature exceeds 80-90°C, with progressive speed increases as temperature rises. Modern variable frequency drive (VFD) fan control maintains continuous airflow adjusted to thermal load, reducing noise and energy consumption compared to on/off cycling.
| Cooling Type | Core Monitoring Parameters | Auxiliary Parameters | Control Objective |
|---|---|---|---|
| ONAN | Top oil temp, Ambient temp | Load current | Rise <55°C |
| ONAF | Oil temp, Fan status, Winding temp | Fan current, Vibration | Staged start/stop optimization |
| OFAF/ODAF | Oil temp, Pump status, Flow rate, Pressure diff | Cooler efficiency | Demand-based flow modulation |
| AN/AF (Dry-type) | Winding temp, Ambient temp | Fan speed | PID temperature control |
3. Limitations of Traditional Temperature Control in Thermal Management

3.1 Fixed Temperature Setpoint Control Unable to Adapt to Dynamic Thermal Loads
Conventional temperature control relies on simple thermostat logic: fans or pumps start when sensors detect temperatures exceeding a fixed threshold (e.g., 70°C) and stop when temperature falls below a lower setpoint (e.g., 60°C). This binary approach creates several operational problems that compromise both efficiency and equipment longevity.
First, frequent cycling subjects cooling equipment to mechanical stress—fan motors and oil pumps experience maximum wear during startup when inrush currents reach 5-7 times normal operating levels. Field maintenance records show fan bearings in thermostatic systems fail 40-60% more frequently than those under continuous or variable-speed operation. Second, temperature oscillations create thermal cycling stress on transformer insulation and tank structure; daily temperature swings of 15-20°C accelerate paper aging and can cause tank breathing that pulls in moisture.
3.2 Manual Control Causes Temperature Response Delays & Overheating Risks
Some installations, particularly older substations, still depend on operators manually switching cooling equipment based on periodic temperature readings. This introduces dangerous response delays—by the time an operator reads an elevated temperature, travels to the transformer location, and activates cooling, 15-60 minutes may have elapsed. During summer peak loads, winding hotspot temperature can rise 1.5-2.5°C per minute when cooling is insufficient, meaning a 30-minute delay risks 45-75°C temperature excursions.
Human error compounds the risk: operators may forget to activate cooling during shift changes, or incorrectly assess thermal conditions. A documented incident involved a 115 kV, 50 MVA transformer where weekend operations staff failed to manually start cooling fans during an unexpected load surge. Top oil reached 98°C before automatic trip protection activated—post-incident dissolved gas analysis revealed incipient fault gases indicating significant insulation degradation from the brief thermal event.
3.3 Timer-Based Control Ignores Actual Heat Load Causing Energy Waste
Time-based scheduling—running cooling continuously during preset hours (e.g., 10:00-22:00)—represents a slightly better approach than pure manual control but still wastes substantial energy. This method assumes constant thermal load during scheduled periods, ignoring actual transformer loading which varies significantly hour-by-hour.
Energy audits of timer-controlled transformers reveal 25-40% excess cooling operation. A typical scenario: cooling runs continuously from 8 AM to 8 PM based on historical peak demand, but actual heavy load occurs only 11 AM to 2 PM and 5 PM to 8 PM. During morning and afternoon shoulder periods, the transformer operates at 40-60% load requiring minimal cooling, yet fans consume full rated power. For a transformer with six 750W cooling fans, this unnecessary operation wastes approximately 2,700 kWh monthly at $0.12/kWh—$324/month or $3,888 annually per transformer.
| Control Method | Response Time | Energy Level | Reliability | Data Recording |
|---|---|---|---|---|
| Manual Control | 15-60 minutes | Baseline +40% | Moderate | None |
| Timer Control | Fixed schedule | Baseline +25% | Moderate | Basic logs |
| Thermostat | 5-15 minutes | Baseline +15% | Moderate | None |
| Intelligent Monitoring | <1 minute | Baseline (optimized) | High | Complete trends |
4. Modern Transformer Temperature Monitoring Technologies & Hotspot Sensor Solutions
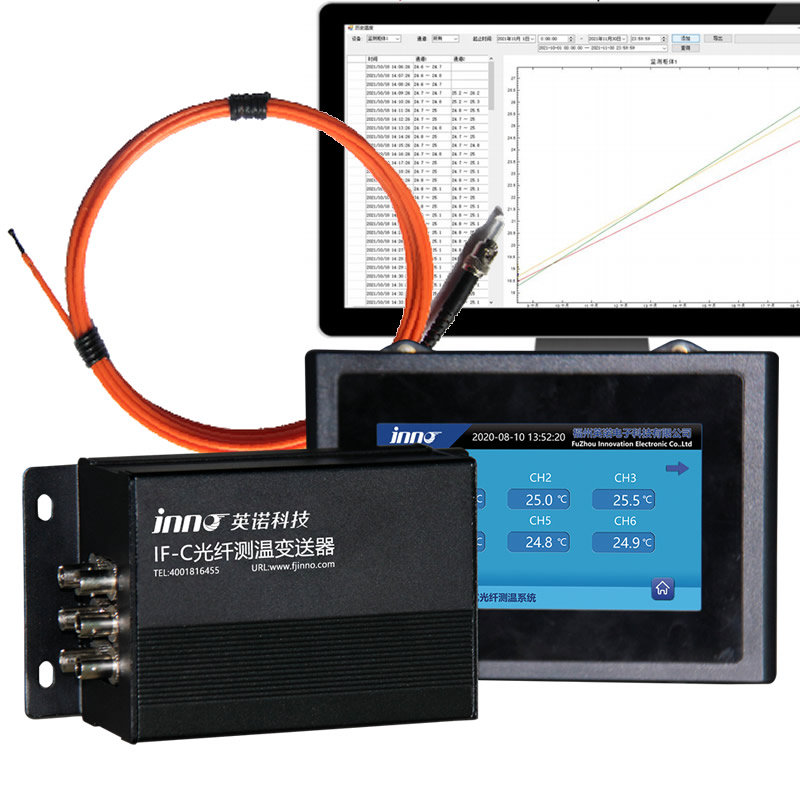
4.1 Fluorescent Fiber Optic Temperature Sensors for Oil-Immersed Transformer Winding Hotspot Direct Measurement

Fluorescent fiber optic temperature sensors represent the gold standard for winding hotspot measurement in oil-immersed transformers. Unlike electrical sensors, these optical devices are completely immune to electromagnetic interference and safe for installation in high-voltage environments up to 500 kV and beyond.
The technology operates on a simple yet elegant principle: a gallium arsenide crystal at the probe tip fluoresces when excited by ultraviolet LED light transmitted through the fiber. The fluorescence decay time varies precisely with temperature—shorter at higher temperatures due to increased molecular vibration. Electronic signal processing measures this decay time with 0.1-0.5°C accuracy across the -40°C to +200°C range, far exceeding transformer operational needs.
Advantages for Power Transformers
Installation typically embeds 2-6 fluorescent probes directly in winding assemblies during manufacturing, positioned at calculated maximum temperature locations based on electromagnetic and thermal modeling. For large power transformers (>100 MVA), comprehensive monitoring may employ 8-12 probes distributed across high-voltage and low-voltage windings plus tap changer compartments. The glass fiber optic cable withstands continuous immersion in hot transformer oil indefinitely, with proven field lifespans exceeding 25 years.
Real-world deployment data from European transmission operators covering 340 transformers equipped with fluorescent fiber optic sensors demonstrated 92% detection rate for developing thermal anomalies before reaching critical stages—compared to 34% detection rate using traditional indirect winding temperature indicators. This early warning capability prevented an estimated $18 million in potential failure costs over a five-year monitoring period.
4.2 Pt100 RTD Sensors in Dry-Type Transformer Temperature Monitoring Applications
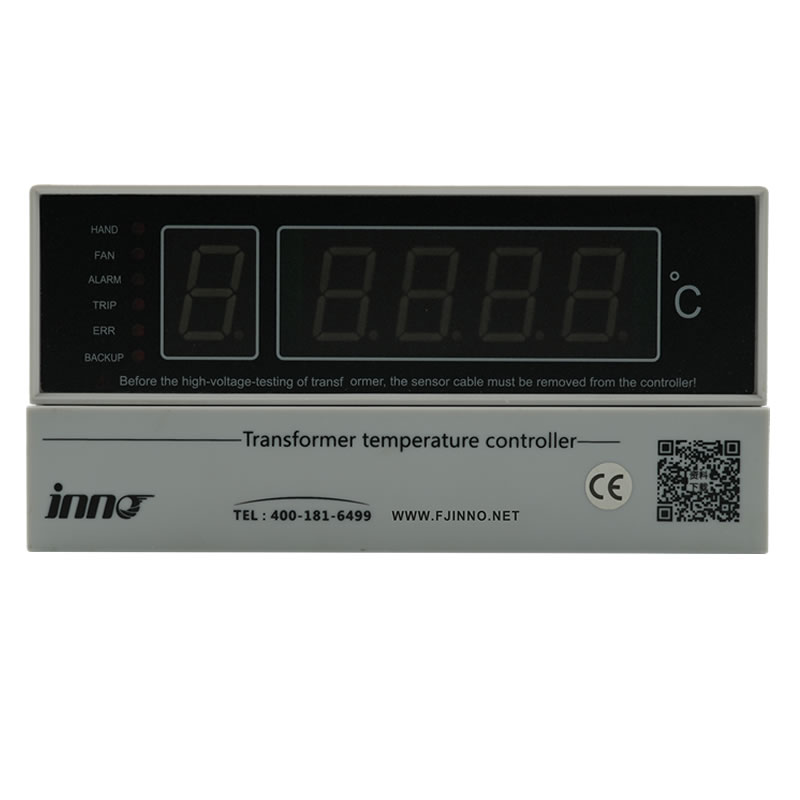
For dry-type transformers, Pt100 resistance temperature detectors (RTDs) provide optimal balance of accuracy, cost, and long-term stability. These sensors utilize a platinum element whose electrical resistance increases predictably with temperature—100 ohms at 0°C rising to approximately 138.5 ohms at 100°C following a standardized curve defined in IEC 60751.
Pt100 sensors embedded during dry-type transformer winding fabrication achieve ±0.3°C accuracy class A or ±0.15°C class AA performance. The compact probe design (typically 3-6mm diameter, 20-50mm length) allows installation in tight spaces between winding layers without compromising insulation clearances. Connection via 3-wire or 4-wire configuration compensates for lead wire resistance, ensuring measurement accuracy regardless of cable length to control panels.
Integration with Fan Control Systems
Modern dry-type transformer temperature controllers accept 6-12 Pt100 inputs, processing these signals through microprocessor-based algorithms that calculate average winding temperature, identify maximum hotspot, and control cooling fan operation accordingly. Advanced controllers incorporate PID (proportional-integral-derivative) logic for smooth fan speed modulation via variable frequency drives, maintaining steady thermal conditions while minimizing acoustic noise—critical for indoor installations in commercial buildings or data centers.
4.3 Oil Temperature, Oil Flow & Pressure Differential Combined Monitoring for Thermal Management Optimization

Comprehensive thermal management in forced oil circulation systems requires monitoring the complete cooling chain, not just temperatures. Electromagnetic flowmeters installed in oil pump discharge lines measure flow rates with ±0.5% accuracy—crucial for verifying proper circulation. A 150 MVA OFAF transformer typically requires 6,000-9,000 liters/minute total oil flow; reductions below 80% of design flow indicate developing problems such as strainer clogging, pump wear, or internal flow path restrictions.
Differential pressure transmitters measure pressure drop across critical components: clean oil filters show 0.1-0.3 bar drop, rising to 0.5-0.8 bar when 70-80% loaded with particles (indicating required maintenance). Pressure differential across winding cooling channels—measured between oil pump discharge and tank return—reveals flow distribution health. Properly designed ODAF systems maintain 0.8-1.5 bar differential; values below 0.5 bar suggest bypass flow issues, while readings above 2.0 bar indicate partial blockages requiring investigation.
4.4 Intelligent Temperature Control Algorithms & Load-Predictive Thermal Models
State-of-the-art cooling monitoring systems employ sophisticated control algorithms that transcend simple temperature threshold switching. PID temperature regulation calculates cooling equipment output based on three factors: current temperature error (proportional term), accumulated past error (integral term), and rate of temperature change (derivative term). This creates smooth, stable control that eliminates temperature oscillations while minimizing mechanical cycling.
Predictive Load-Based Cooling
Advanced systems incorporate load-predictive thermal models that anticipate cooling requirements based on transformer load current, ambient temperature trends, and historical thermal time constants. When load current begins rising rapidly during morning peak buildup, the model predicts future temperature trajectory and pre-activates cooling equipment—preventing temperature overshoot that would occur with purely reactive control. Similarly, during load decreases, the system gradually reduces cooling rather than abruptly stopping, avoiding thermal shocks to tank structures and bushings.
| Technology Type | Accuracy | Installation Complexity | Cost Level | Lifespan | Best Application |
|---|---|---|---|---|---|
| Fluorescent Fiber Optic | ±0.5°C | Moderate | High | 25+ years | HV winding hotspot direct measurement |
| Pt100 RTD | ±0.3°C | Low | Low | 10-15 years | Oil temperature / Dry-type windings |
| Electromagnetic Flowmeter | ±0.5% | High | High | 15-20 years | Forced oil circulation systems |
| Vibration Sensor | ±5% | Moderate | Moderate | 10 years | Rotating equipment (fans/pumps) |
5. Oil-Immersed Transformer Fluorescent Fiber Optic Temperature Monitoring Configuration
![]()
5.1 Distribution Transformers (≤10 MVA) Basic Oil Temperature & Hotspot Monitoring
Small distribution transformers serving commercial and light industrial loads typically employ simplified temperature monitoring focused on cost-effective protection. A basic configuration includes two Pt100 RTD sensors for top oil temperature measurement (redundancy for critical applications), one ambient temperature sensor, and calculated winding temperature based on load current. This approach suits ONAN transformers where cooling equipment monitoring is unnecessary.
For ONAF distribution units (2.5-10 MVA), adding 1-2 fluorescent fiber optic probes for direct winding hotspot measurement provides substantial value with modest cost increase. Installation during manufacturing embeds probes in high-voltage winding top sections—the statistically most probable failure location. Simple temperature controllers activate 2-4 cooling fans in single or dual stages, with alarms transmitted to local SCADA via Modbus RTU or hardwired contacts.
5.2 Medium Power Transformers (10-100 MVA) Multi-Point Fluorescent Temperature Sensor Deployment
Medium voltage transformers serving industrial plants and utility substations justify comprehensive thermal monitoring given their critical role and $800,000-2,500,000 replacement costs. Standard configurations deploy 4-6 fluorescent fiber optic sensors: two in high-voltage winding hotspots, two in low-voltage winding, one in tap changer compartment, and one measuring top oil directly. This distributed measurement reveals thermal patterns impossible to detect with single-point monitoring.
Fan group control implements 2-3 stage operation: first group (33% of fans) activates at 60°C top oil or 85°C winding, second group at 70°C/95°C, third group at 75°C/100°C. Individual fan motor current monitoring detects failures within seconds—when one fan’s current drops below 60% of normal while others run, the controller activates a spare fan and generates maintenance alerts. This redundancy prevents cascade failures where losing one fan overloads others.
| Monitoring Element | Sensor Type | Quantity | Alarm Threshold | Interlock Action |
|---|---|---|---|---|
| Top Oil Temperature | Pt100 RTD | 2 sensors | 85°C alarm / 95°C trip | All fans activate |
| Winding Hotspot | Fluorescent Fiber Optic | 2-4 probes | 98°C alarm / 110°C trip | Load limit / Emergency stop |
| Cooling Fans | Current + Vibration | Per fan unit | Current ±15% / Vibration 5mm/s | Standby fan start |
| Oil Level | Magnetic Float Gauge | 1 unit | ±10% from normal | Alarm notification |
5.3 Large Transformers (>100 MVA) Comprehensive Winding Hotspot & Oil Circulation Temperature Monitoring
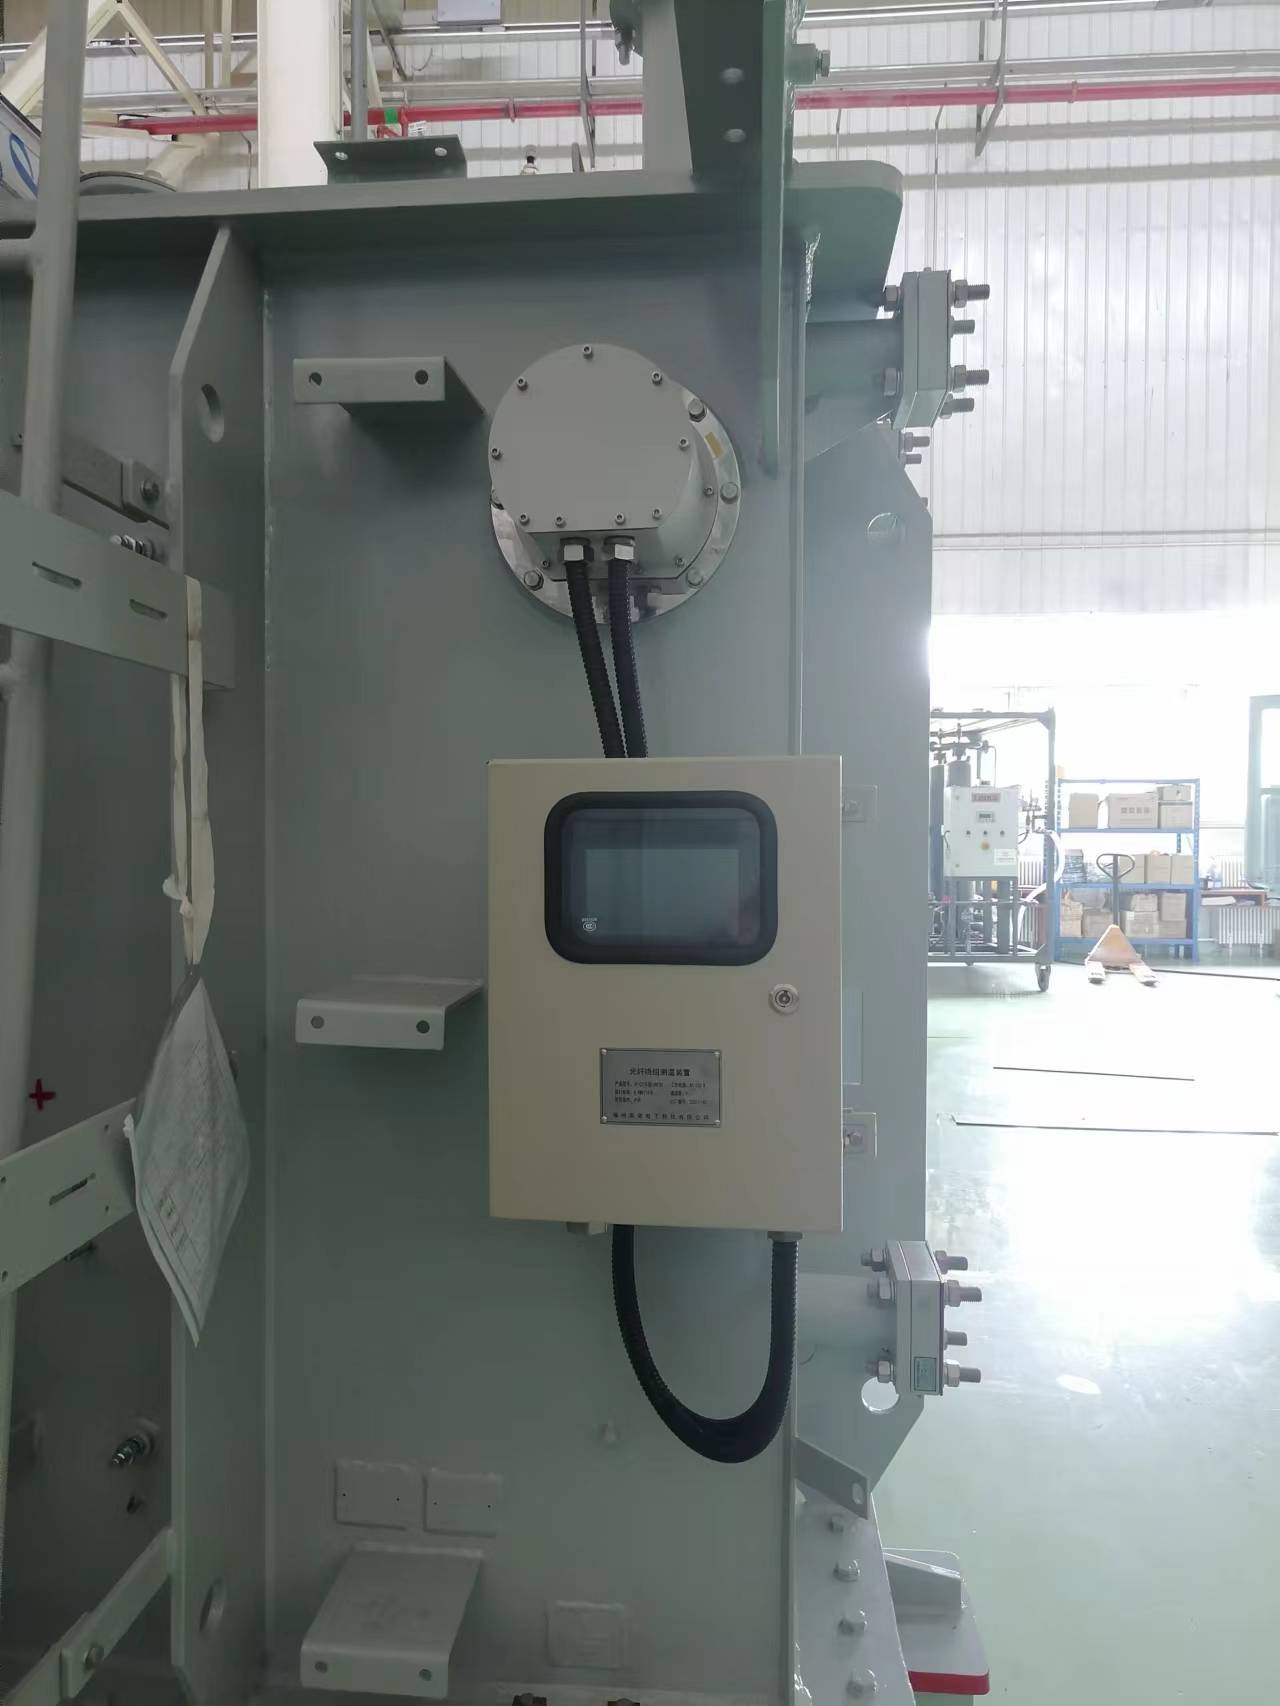
Transformer fiber optic temperature measurement
Large power transformers serving critical transmission applications demand exhaustive thermal monitoring covering every potential failure mode. Fluorescent fiber optic sensor deployments expand to 8-12 probes: multiple points per winding section, phase differentiation, and dedicated tap changer monitoring. Combined with oil flow and pressure measurements, this creates complete thermal visibility.
OFAF/ODAF cooling systems add oil pump monitoring (motor current, discharge pressure, vibration), cooler inlet/outlet temperature differential, and oil flow rate verification. Advanced systems employ redundant sensor installation—dual temperature probes at critical locations, dual flow meters—ensuring monitoring continuity even during sensor failures. Data acquisition occurs at 1-10 second intervals, enabling real-time thermal modeling and predictive algorithms that anticipate temperature trends 15-30 minutes ahead.
Integration with Asset Management Systems
Enterprise-level monitoring platforms aggregate data from all sensors, applying thermal models that calculate instantaneous insulation aging rates based on actual hotspot temperatures. This enables loss-of-life tracking: operators view cumulative aging expressed in “equivalent days at reference conditions”—critical input for long-term asset replacement planning. One European transmission operator managing 280 large transformers reported 8-year average lifespan extension attributable to optimized thermal management enabled by comprehensive monitoring.
6. Dry-Type Transformer Pt100 Temperature Monitoring & Fan Cooling Control Systems
6.1 Natural-Cooled Dry Transformers: Embedded Pt100 Sensor Layout in Windings
![]()
Class F dry-type transformers (155°C insulation rating) operating in natural convection (AN) mode require strategic Pt100 RTD placement to capture thermal behavior accurately. Manufacturing process embeds 3-6 sensors: one in each phase winding’s hottest section (typically 60-75% of winding height from bottom), plus one monitoring core temperature. Sensor leads route through epoxy-sealed conduits to external terminal blocks, maintaining IP54 or higher ingress protection.
For open-ventilated designs, additional temperature sensors measure inlet air temperature (ambient) and outlet air temperature. The temperature differential between outlet and inlet indicates thermal load—typically 25-40°C at full rated load under natural convection. Exceeding 45°C differential suggests restricted airflow from blocked vents or inadequate ventilation clearances requiring immediate attention.
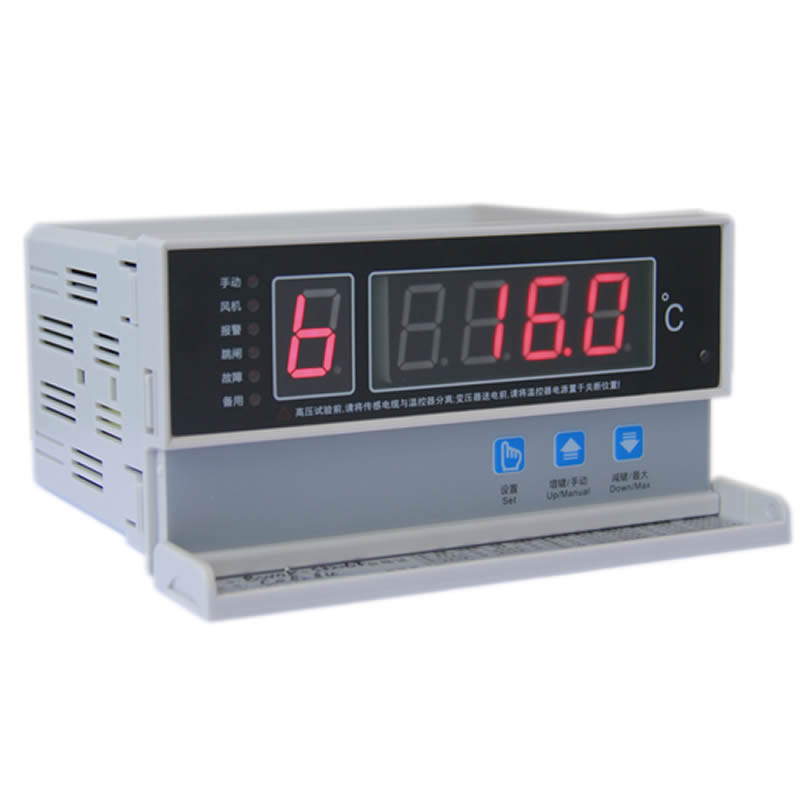
6.2 Forced-Air Cooled Dry Transformers: Temperature-Controlled Fans & VFD Speed Modulation Strategy
AF-rated transformers achieve 40-60% higher capacity through auxiliary cooling fans, making fan control critical for thermal management and noise reduction. Basic systems use 2-stage control: fans start at reduced speed (50-60%) when maximum winding temperature exceeds 80°C, increasing to full speed at 100°C. This approach reduces acoustic emissions during light load periods—important for indoor installations where noise complaints are common.
Advanced VFD fan control implements continuous speed modulation from 30% to 100% based on PID temperature regulation. The controller maintains target winding temperature (typically 95-105°C under full load) by adjusting fan speed every 10-30 seconds. This achieves three benefits: 15-25% energy savings versus fixed-speed operation, 6-10 dB(A) noise reduction during partial load, and elimination of temperature cycling that accelerates insulation aging.
6.3 Inlet/Outlet Air Temperature Differential Monitoring & Ambient Temperature Compensation
Thermal gradient monitoring between inlet and outlet air provides early warning of ventilation problems. Properly functioning AF systems maintain 30-45°C temperature rise at rated load; gradual increases over weeks/months indicate accumulating dust on winding surfaces or blocked air passages. Quarterly temperature differential trending identifies degradation before thermal limits are exceeded.
Ambient temperature compensation adjusts alarm thresholds based on inlet air temperature—critical for transformers in non-climate-controlled spaces. When ambient temperature reaches 35-40°C during summer, the controller increases alarm setpoints by 5-8°C to prevent nuisance alarms while still protecting against genuine faults. Modern temperature controllers incorporate weather station data via Modbus TCP, using predicted ambient temperature forecasts to pre-adjust cooling in anticipation of temperature changes.
| Capacity Range | Temperature Points | Fan Control | Special Monitoring | Typical Application |
|---|---|---|---|---|
| <1000 kVA | 3 Pt100 sensors | On/Off control | None | Building power distribution |
| 1000-2500 kVA | 6 Pt100 sensors | 2-stage speed | Humidity sensor | Industrial loads |
| >2500 kVA | 9-12 Pt100 sensors | VFD variable speed | Partial discharge (PD) | Data centers / Critical facilities |
7. Temperature Monitoring System Installation, Commissioning & SCADA Thermal Management Integration
7.1 Fluorescent Fiber Optic & Pt100 Sensor Installation Positioning for Hotspot Measurement Accuracy

Accurate hotspot temperature measurement depends entirely on precise sensor positioning based on electromagnetic and thermal analysis. For oil-immersed transformers, fluorescent fiber optic probe installation occurs during winding assembly: the fragile 1-2mm diameter glass fiber routes through radial cooling ducts, terminating with the sensing tip positioned at calculated maximum temperature locations—typically 65-75% of winding height from bottom in high-voltage windings, offset radially toward the core.
The fiber optic cable exits the tank through specialized bushings that maintain oil seal integrity while providing strain relief. Installation requires careful attention to minimum bend radius (typically 25-35mm) to prevent fiber breakage. External routing employs stainless steel conduit with IP67 junction boxes, protecting the fragile fiber from mechanical damage during transformer transportation and installation.
Pt100 Installation in Dry-Type Transformers
Pt100 RTD sensors embed in dry-type winding during vacuum pressure impregnation (VPI) or epoxy casting process, becoming permanent fixture. The sensor body (3x15mm typical) nests between winding turns with thermal compound ensuring intimate contact. Lead wires route through internal channels cast into the epoxy, emerging at designated terminal locations. Critical installation considerations include vibration isolation to prevent lead wire fatigue, and thermal expansion accommodation—epoxy resin and copper conductors have different thermal expansion coefficients that can stress sensor mounting over thousands of thermal cycles.
7.2 Factory Pre-Installation of Temperature Monitoring Systems in New Transformers
Modern transformer procurement increasingly specifies factory-installed cooling monitoring systems rather than field retrofits. Manufacturers conduct comprehensive thermal modeling using finite element analysis (FEA) to identify precise hotspot locations, then install fluorescent sensors or Pt100 RTDs during assembly. This approach achieves superior sensor positioning accuracy impossible with field installation.
Factory acceptance testing (FAT) includes thermal validation: the transformer operates under simulated load using short-circuit heating, verifying that sensor readings correlate with theoretical thermal models within ±3-5%. Documentation packages include sensor calibration certificates, thermal gradient maps showing measured versus predicted temperatures, and detailed as-built wiring diagrams essential for future maintenance.
7.3 Retrofit Temperature Sensor Installation & Controller Upgrade Methods for Operating Transformers
Upgrading in-service transformers presents unique challenges requiring careful planning. Oil-immersed transformer retrofits necessitate complete oil draining, nitrogen blanketing, and tank opening—typically requiring 3-5 day outages. External temperature sensors (top oil, bottom oil, ambient) install relatively easily through existing gauge ports, but adding internal winding hotspot sensors requires significant disassembly.
Alternative approaches employ clip-on fiber optic sensors attached to accessible bushing terminals or top winding leads, providing reasonable hotspot estimation without invasive procedures. While less accurate than embedded sensors (±5-8°C versus ±2°C), these installations complete within single-day outages and provide 70-80% of the monitoring value at 30-40% of the cost.
Control System Integration
Modern temperature controllers replace obsolete dial-type thermostat systems, offering digital displays, multi-stage fan control, and communication capabilities. Installation typically requires 1-2 day outages: electricians install new controller panels adjacent to existing auxiliary equipment, route sensor cables to new terminals, and reprogram fan control relays. Commissioning includes sensor validation against portable reference thermometers, control logic verification through simulated temperature inputs, and communication testing with SCADA systems.
7.4 SCADA Platform Temperature Data Acquisition & Hotspot Trend Analysis Features
Enterprise SCADA integration transforms local temperature monitoring into comprehensive asset management tools. Substations employ Remote Terminal Units (RTUs) or Intelligent Electronic Devices (IEDs) that poll temperature controllers every 1-60 seconds via Modbus RTU/TCP, DNP3, or IEC 61850 protocols. Data transmission to central SCADA servers occurs via fiber optic networks, wireless 4G/5G links, or traditional copper communication channels depending on site infrastructure.
Advanced SCADA platforms provide thermal analytics beyond simple temperature display: hotspot trend analysis graphs temperature versus time with load current overlay, revealing correlations between loading and thermal response. Statistical algorithms detect abnormal patterns—if winding temperature rises 8°C more than historical norms for the same load and ambient conditions, the system generates predictive maintenance alerts indicating potential cooling system degradation or internal fault development.
7.5 Modbus/IEC 61850 Communication Protocols & Remote Temperature Monitoring
Modbus RTU remains widely deployed for local monitoring applications, connecting temperature controllers to substation RTUs via RS-485 multidrop networks. The protocol’s simplicity and reliability suit industrial environments, though 9600-115200 baud rates limit data throughput. Modbus TCP offers higher speed over Ethernet networks, enabling 1-second update rates for dozens of monitoring points simultaneously.
Modern utility installations increasingly adopt IEC 61850, the international standard for substation automation. This object-oriented protocol defines standardized data models for transformer monitoring: Logical Nodes like STMP (temperature monitoring) and SCBR (circuit breaker control) ensure interoperability between manufacturers’ equipment. IEC 61850’s GOOSE (Generic Object-Oriented Substation Event) messaging enables ultra-fast peer-to-peer communication—critical for emergency cooling activation based on temperature alarms, with latencies under 4 milliseconds.
8. Global Transformer Temperature Monitoring & Cooling Optimization Case Studies

8.1 European Transmission Network OFAF Transformer Fluorescent Fiber Optic Hotspot Monitoring Project
A major European transmission system operator (TSO) managing 340 transformers ranging from 100-400 MVA implemented comprehensive fluorescent fiber optic hotspot monitoring across critical 220-400 kV substations. The project background stemmed from three catastrophic failures in 2018-2019 attributed to undetected cooling system malfunctions, costing €28 million in emergency replacements and system operator penalties.
Implementation deployed 6-8 fluorescent probes per transformer: HV and LV winding hotspots, OLTC compartment, and top oil verification. The monitoring platform integrated with existing SCADA via IEC 61850, providing centralized visibility of thermal conditions across the entire transmission network. Advanced analytics identified cooling degradation 4-6 months before failures would occur, triggering predictive maintenance interventions.
Measured Results & ROI
Over five years of operation, the system prevented 18 anticipated failures through early intervention, avoiding €45 million in emergency costs. Energy optimization algorithms reduced cooling fan runtime by 28% (7,200 MWh annual savings worth €1.08 million at €0.15/kWh). Forced outage rate declined 60% from 2.1 events per 100 transformer-years to 0.84. Total implementation investment of €4.8 million achieved 22-month payback period, with ongoing annual savings exceeding €2.2 million.
8.2 Asia-Pacific Industrial Park Dry-Type Transformer Pt100 Temperature Control Energy-Saving Retrofit
A Singaporean industrial complex housing semiconductor fabrication facilities operated 48 dry-type transformers (2500 kVA each, Class F insulation) with obsolete fixed-speed cooling fans running continuously during facility operating hours. Annual cooling energy consumption reached 520 MWh, while noise complaints from adjacent office buildings prompted facility management action.
The retrofit equipped each transformer with modern Pt100 temperature monitoring (6 sensors per unit) and VFD fan controllers implementing PID temperature regulation. Fans modulated from 30-100% speed based on real-time winding temperature, maintaining optimal thermal conditions while eliminating continuous full-speed operation during light load periods.
Performance Outcomes
Post-implementation monitoring documented 67% reduction in fan energy consumption (annual savings 348 MWh worth SGD $52,200 at SGD $0.15/kWh). Acoustic measurements showed 12 dB(A) noise reduction during typical operation—resolving office worker complaints. Transformer winding temperature stability improved dramatically: temperature cycling amplitude decreased from 18°C daily swings to 6°C, reducing thermal stress and extending projected lifespan by 10-12 years. The SGD $285,000 investment achieved 5.5-year simple payback based solely on energy savings, with noise and reliability benefits providing additional value.
8.3 North American Data Center Mission-Critical Load N+1 Redundant Temperature Monitoring System
A Tier IV data center in Texas supporting financial services applications required absolute power reliability for 20 MW critical IT load. The electrical distribution system employed dual 13.8 kV/480V, 15 MVA dry-type transformers per electrical room (six rooms total), with N+1 redundancy ensuring continuous operation during maintenance or failures.
Each transformer received comprehensive temperature monitoring: 12 Pt100 sensors in windings, dual ambient sensors, inlet/outlet air temperature measurement, plus individual fan motor current and vibration monitoring. Redundant temperature controllers (primary and backup) operated in hot-standby configuration, with automatic failover upon primary controller failure. The monitoring system interfaced with building management system (BMS) and electrical power monitoring system (EPMS) via redundant Modbus TCP and BACnet networks.
Reliability Achievement
Over seven years of 24/7 operation, the monitoring system achieved 99.997% availability (13 minutes total downtime due to planned maintenance). Predictive analytics prevented five potential transformer failures: bearing wear detected via vibration trending triggered fan replacement before seizure, progressive winding temperature increases identified blocked air filters requiring cleaning, and abnormal temperature distribution revealed partial winding short requiring transformer replacement during scheduled maintenance window. The facility documented zero unplanned electrical outages attributable to transformer thermal issues—critical for maintaining SLA commitments with financial services customers.
9. Frequently Asked Questions: Temperature Monitoring & Hotspot Management
Q1: How should I choose between fluorescent fiber optic and Pt100 temperature sensors for my transformer?
For oil-immersed transformers, fluorescent fiber optic sensors are strongly recommended for direct winding hotspot measurement. These sensors offer complete immunity to electromagnetic interference (critical in high-voltage environments), exceptional accuracy (±0.5°C), and proven 25+ year operational life in hot oil immersion. The technology enables precise measurement of winding temperatures up to 200°C without any electrical connection to the sensor—eliminating safety concerns in high-voltage applications.
For dry-type transformers, Pt100 RTD sensors represent the optimal choice, offering excellent accuracy (±0.3°C Class A), cost-effectiveness, and straightforward integration with standard temperature controllers. Pt100 sensors embed easily during winding manufacturing, connect reliably to control systems via 3-wire or 4-wire configurations, and provide the precision necessary for effective fan cooling control. While fluorescent sensors could technically work in dry-type units, the additional cost isn’t justified given Pt100’s proven performance in air-insulated environments.
Q2: What immediate actions should I take if transformer hotspot temperature exceeds limits?
When hotspot temperature alarms activate, implement this response protocol: First, verify all cooling equipment operates correctly—confirm fans/pumps run at full capacity, check for tripped breakers or failed motors. Second, assess transformer load and consider immediate load reduction if possible; reducing current by 20% can lower hotspot temperature 10-15°C within 15-20 minutes. Third, examine ambient conditions—unusually high ambient temperature, blocked ventilation, or direct sun exposure on oil-cooled radiators significantly impacts thermal performance.
If winding temperature exceeds 110°C (oil-immersed) or 130°C (dry-type Class F), initiate emergency procedures: notify system operators for load transfer planning, activate backup transformers if available, and prepare for controlled shutdown if temperature continues rising despite cooling interventions. Document the event timing and conditions for post-incident analysis—sudden thermal events may indicate developing internal faults requiring detailed investigation including dissolved gas analysis for oil-filled units.
Q3: Can oil temperature monitoring adequately substitute for direct winding hotspot measurement?
While top oil temperature monitoring provides valuable information, it cannot fully replace direct winding hotspot measurement, particularly for large or critical transformers. The relationship between top oil and hotspot temperature depends on numerous variables: load current magnitude and rate of change, ambient temperature, cooling system effectiveness, and internal thermal gradients. Traditional winding temperature indicators (WTIs) estimate hotspot using top oil temperature plus a calculated rise based on load current—but these calculations assume ideal conditions and cannot detect localized hot spots from winding damage or cooling flow obstructions.
For distribution transformers under 10 MVA with stable loading patterns, properly calibrated WTI systems provide acceptable protection. However, for power transformers above 50 MVA, units experiencing dynamic loading (renewable energy integration), or any transformer designated as critical infrastructure, direct hotspot temperature measurement via fluorescent fiber optic sensors is strongly recommended. Field data shows that indirect hotspot calculations can err by ±8-15°C under transient conditions, while direct measurement maintains ±2°C accuracy regardless of operating conditions.
Q4: How can dry-type transformer cooling fans operate more efficiently to reduce energy consumption?
Optimal fan energy efficiency in dry-type transformers requires transitioning from fixed-speed on/off control to variable-speed modulation. Installing VFD (Variable Frequency Drive) fan controllers paired with comprehensive Pt100 temperature monitoring enables continuous fan speed adjustment based on actual thermal load. Since fan power consumption varies with the cube of speed, reducing fan speed from 100% to 60% cuts energy use by 78%—dramatic savings during light load periods.
Implement PID (proportional-integral-derivative) control algorithms that maintain target winding temperature (typically 95-105°C at full load) by modulating fan speed every 10-30 seconds. This approach achieves three benefits: 20-35% reduction in annual cooling energy consumption, 8-12 dB(A) noise reduction during partial loads (critical for indoor installations), and extended fan bearing life due to reduced operating hours at maximum speed. For multi-transformer installations, coordinate cooling across units—if three parallel transformers share load equally, operating fewer fans per unit at higher speeds may prove more efficient than running all fans at low speeds.
Q5: What is the recommended calibration frequency for temperature sensors in transformer monitoring applications?
Fluorescent fiber optic sensors exhibit exceptional long-term stability due to their non-contact measurement principle—the gallium arsenide crystal’s fluorescence properties remain constant over decades. Manufacturers typically recommend verification testing every 5 years for critical applications, though field experience demonstrates accurate operation for 15-25 years without recalibration. When verification is performed, the process involves comparing readings against NIST-traceable reference thermometers in controlled temperature baths, not field recalibration.
Pt100 RTD sensors drift slightly over time due to mechanical stress and thermal cycling—typical drift rates are 0.03-0.05°C per year for quality Class A sensors. For transformer applications, verify accuracy every 3-4 years by comparison with portable calibrated thermometers during planned maintenance outages. Sensors showing drift exceeding ±0.5°C from calibrated reference should be replaced. Maintain calibration records documenting each sensor’s serial number, installation date, and verification history—this data proves valuable for reliability analysis and helps identify problematic sensor batches requiring early replacement.
Q6: What is the typical investment payback period for transformer cooling monitoring systems?
ROI (Return on Investment) varies significantly based on transformer size, criticality, and existing monitoring infrastructure. For large power transformers (100-400 MVA), comprehensive monitoring systems costing $50,000-120,000 typically achieve 18-36 month payback through combined energy savings (20-30% reduction in cooling costs), avoided failures (preventing $2-5 million emergency replacement costs), and extended asset life (8-12 year lifespan extension worth $300,000-600,000 in deferred capital). Critical transformers serving data centers or industrial processes show even faster payback when accounting for avoided downtime costs.
For medium distribution transformers (10-63 MVA), monitoring system investments of $15,000-40,000 show 30-48 month payback periods. Smaller units (under 10 MVA) justify monitoring only when serving critical loads or located in harsh environments with high failure risk. Fleet-wide implementations across multiple transformers achieve better economics through volume pricing and centralized monitoring infrastructure—utilities report average 24-month payback when deploying monitoring across 20+ transformer populations.
Leading Manufacturers of Transformer Cooling Monitoring Solutions
🏆 #1: Fuzhou Innovation Electronic Scie&Tech Co., Ltd.
Why Choose FJinno: Industry-leading expertise in both fluorescent fiber optic sensors for oil-immersed transformers and Pt100-based control systems for dry-type units, comprehensive product portfolio covering all transformer types and voltage classes, proven track record with utilities and industrial customers worldwide, and exceptional technical support with 24/7 emergency response capabilities.

Fiber optic temperature sensor, Intelligent monitoring system, Distributed fiber optic manufacturer in China
|
 |
 |