 INNO fibre optic temperature sensors ,temperature monitoring systems.
- Transformer hot spot temperature directly impacts insulation lifespan—every 8°C increase halves the expected service life
- Traditional oil temperature gauges and winding temperature indicators (WTI) contain measurement errors of ±5-15°C, failing to reflect actual hot spot conditions
- Fluorescent fiber optic temperature sensors provide the most accurate direct measurement solution with electrical isolation, EMI immunity, and ±1°C precision
- Different transformer types—oil-immersed transformers, dry-type transformers, distribution, and transmission—require customized monitoring configurations
- Real-time hot spot monitoring enables dynamic load management, increasing transformer capacity utilization by 15-30%
- Leading utilities worldwide have reduced failure rates by over 50% through hot spot monitoring systems, with ROI periods of 2-4 years
- This comprehensive guide covers technology comparison, installation procedures, system integration, and proven global implementations
Table of Contents
1. What is Transformer Hot Spot Temperature and Why Does It Matter?

1.1 Understanding Transformer Hot Spot Temperature Fundamentals
The hot spot temperature represents the highest temperature point within transformer windings, typically 10-15°C above the average winding temperature. In oil-immersed transformers, this critical point usually occurs in the upper portions of high-voltage windings where heat dissipation is least efficient. For dry-type transformers, hot spots commonly develop at winding center sections or coil corners due to restricted airflow.
Heat generation stems from I²R losses in conductors combined with localized stray flux effects. When load current flows through winding resistance, thermal energy concentrates in areas with poorest cooling circulation. The physics behind hot spot formation involves complex thermal dynamics where copper losses, core losses, and dielectric losses interact with cooling medium flow patterns.
| Transformer Type | Typical Hot Spot Location | Temperature Gradient | Primary Cause |
|---|---|---|---|
| Oil-Immersed Distribution | HV winding upper discs | 10-15°C above avg | Limited oil circulation |
| Oil-Immersed Power | HV/LV winding interfaces | 15-20°C above avg | Stray flux concentration |
| Cast Resin Dry-Type | Winding center sections | 20-30°C above avg | Embedded heat retention |
| Ventilated Dry-Type | Coil turn corners | 15-25°C above avg | Restricted airflow paths |
1.2 Critical Impact on Insulation Lifespan
The “8-degree rule” governs insulation aging: for every 8°C temperature increase above rated conditions, expected insulation life reduces by half. This exponential relationship, derived from Arrhenius equation principles, makes accurate thermal monitoring financially critical. Paper insulation in oil-filled units degrades through depolymerization—long cellulose chains break down into shorter segments, losing mechanical strength and dielectric properties.
Industry statistics reveal that thermal stress accounts for 40-60% of large power transformer failures. Utilities operating 110kV-500kV transmission transformers valued at $1-5 million each face catastrophic losses from undetected overheating. A single unexpected failure can cost 10-50 times the monitoring system investment when factoring in replacement costs, emergency repairs, lost revenue from outages, and potential liability claims.
Modern insulation materials exhibit varying thermal resistance. Thermally upgraded Kraft paper withstands higher temperatures than standard cellulose, while aramid papers offer superior thermal performance. Understanding your specific insulation system determines appropriate hot spot temperature limits for safe operation.
1.3 International Standards Requirements

IEC 60076-7 specifies maximum hot spot temperatures: 98°C for normal operation and 120°C for emergency loading in oil-immersed units with 65°C average winding rise. IEEE C57.91 provides calculation methodologies but acknowledges direct measurement superiority when available. Different insulation classes permit varying limits—Class A (105°C total temperature), Class F (155°C), Class H (180°C)—making monitoring configuration dependent on transformer specifications.
| Insulation Class | Max Hot Spot (Normal) | Max Hot Spot (Emergency) | Typical Application |
|---|---|---|---|
| Class A (105°C) | 98°C | 120°C | Oil-immersed transformers |
| Class B (130°C) | 120°C | 140°C | Small dry-type units |
| Class F (155°C) | 145°C | 165°C | Cast resin dry-type |
| Class H (180°C) | 165°C | 185°C | High-temp dry-type |
1.4 Economic Value of Accurate Hot Spot Measurement

Avoiding catastrophic failures represents just one financial benefit. Precise thermal monitoring enables dynamic asset rating—safely increasing load during cool weather or light-load periods while protecting against thermal damage during peak demand. Utilities report 15-30% capacity increases without additional capital investment in new transformers.
Insurance companies increasingly offer premium reductions for facilities implementing comprehensive monitoring. Documented temperature tracking demonstrates proactive asset management, reducing underwriters’ risk exposure. Extended transformer lifespans from optimized thermal management defer costly replacement projects, preserving capital for other infrastructure improvements.
2. What Are the Limitations of Traditional Temperature Monitoring Methods?
2.1 Top Oil Temperature Measurement Deficiencies
Standard oil temperature gauges measure bulk oil at tank tops, providing only indirect winding assessment. The temperature differential between top oil and actual hot spots ranges from 30-50°C under heavy loads. Oil circulation patterns create thermal stratification—hot oil rises to the top while cooler oil remains near the bottom, but this top oil temperature lags significantly behind rapid winding temperature changes.
Oil thermal time constants typically range from 45-90 minutes for distribution transformers, extending to 2-4 hours for large power transformers. During sudden load increases, winding hot spots may reach dangerous levels while oil temperature readings remain deceptively stable. This delayed response makes oil temperature unsuitable for real-time protection schemes or dynamic loading applications.
2.2 Winding Temperature Indicator Systematic Errors
Winding temperature indicators (WTI) attempt hot spot estimation using top oil temperature plus heat from a current-proportional heating element. The WTI bulb contains oil heated by a resistor carrying current from a CT in the transformer bushing. Theory suggests this arrangement simulates winding thermal behavior, but reality proves far more complex.
Thermal modeling resistors drift with age—oxidation and thermal cycling alter their characteristics over 5-10 years of service. Current transformers introduce measurement errors of 1-3%, compounded by burden variations and saturation during fault conditions. Ambient temperature swings affect WTI calibration, particularly in outdoor installations experiencing -40°C to +50°C variations.
| Measurement Method | Typical Accuracy | Response Time | Maintenance Required | Initial Cost |
|---|---|---|---|---|
| Oil Temperature Gauge | ±2°C (oil only) | 45-240 minutes | Low | $200-500 |
| Winding Temperature Indicator | ±5-15°C | 10-30 minutes | Medium (calibration) | $800-2,000 |
| Thermal Model (calculated) | ±8-20°C | Real-time | Low (software) | $1,000-5,000 |
| Fiber Optic Direct Measurement | ±0.5-1°C | <1 second | None (25+ years) | $3,000-8,000 |
2.3 Calculation-Based Indirect Methods
IEEE C57.91 and IEC 60076-7 provide formulas estimating hot spot temperature from load current, ambient temperature, top oil temperature, and empirical thermal constants. While mathematically rigorous, these calculations depend on accurate knowledge of transformer thermal characteristics—data that varies with aging, oil quality degradation, cooling system fouling, and loading history.
Hot spot factors (H) derived from heat-run tests during factory acceptance represent new, clean conditions. After years of service, dust accumulation on radiators, oil oxidation products, and winding paper deterioration alter heat transfer characteristics. Calculated temperatures may diverge 15-25°C from actual values in aged transformers, undermining reliability of protection schemes based on thermal models.
3. Why Are Fiber Optic Temperature Sensors the Optimal Solution?

3.1 Fluorescent Fiber Optic Sensing Technology
Fluorescent fiber optic temperature sensors utilize rare-earth phosphor materials (typically GaAs crystal) whose fluorescent decay time varies precisely with temperature. An LED or laser diode sends optical pulses through the fiber to excite the sensor tip. The phosphor absorbs this energy and re-emits fluorescent light. The decay time of this fluorescence—measured in microseconds—changes predictably with temperature according to Boltzmann distribution principles.
Advanced signal processing analyzes the decay curve to extract temperature with ±0.5-1°C accuracy across -200°C to +300°C ranges. The measurement is absolute—no calibration drift occurs because temperature determines the fundamental quantum mechanical properties of the phosphor material. This physics-based approach ensures long-term stability impossible with electrical sensors subject to component aging.
3.2 Decisive Advantages Over Competing Technologies
Complete electrical isolation eliminates high-voltage insulation challenges that plague thermocouple and RTD sensors. Thermocouples require expensive mineral-insulated cables and grounding isolation; RTDs need complex 3-wire or 4-wire configurations to compensate for lead resistance. Both introduce metallic paths into high-voltage environments, requiring careful insulation coordination and creating potential failure points.
Electromagnetic immunity represents another critical advantage. Transformers generate intense magnetic fields—thousands of amperes creating flux densities exceeding 1.5 Tesla near windings. These fields induce voltages in metallic sensors and cables, causing measurement errors and potential safety hazards. Glass fiber optic cables remain completely unaffected, delivering accurate readings regardless of electromagnetic environment.
3.2.1 Technology Comparison Details
FBG (Fiber Bragg Grating) sensors offer multi-point measurement along single fibers through wavelength-division multiplexing. While elegant for distributed sensing, FBG systems cost 2-3x more than fluorescent types and require more complex demodulation equipment. For most transformer applications requiring 2-8 measurement points, fluorescent sensors provide superior cost-effectiveness.
Infrared thermal imaging detects surface temperatures externally but cannot access internal hot spots buried within windings. Acoustic partial discharge monitoring identifies insulation breakdown but provides no preventive thermal data. Dissolved gas analysis (DGA) reveals cellulose degradation but only after thermal damage has begun—too late for preventive action.
| Sensor Technology | Key Advantages | Primary Limitations | Best Applications |
|---|---|---|---|
| Fluorescent Fiber Optic | Perfect isolation, no EMI, drift-free, fast response | Higher initial cost, requires fiber expertise | All transformer types, critical assets |
| FBG Fiber Optic | Multiple points per fiber, distributed sensing | Expensive equipment, complex setup | Research, extensive monitoring networks |
| Thermocouple (K-type) | Low cost, rugged, wide temperature range | EMI susceptibility, requires HV isolation, drift | Low-voltage equipment, non-critical monitoring |
| RTD (Pt100) | High accuracy, stability, standardized | Lead resistance errors, HV isolation complexity | Medium-voltage dry-type, industrial processes |
| Wireless (Battery) | No wiring, easy retrofit | Battery replacement (3-5 years), reliability concerns | Temporary monitoring, difficult-access locations |
4. Oil-Immersed Transformer Hot Spot Monitoring Solutions
4.1 Distribution Transformer Configurations (10kV-35kV)
For distribution transformers rated 315kVA-31.5MVA, a typical monitoring system includes two fiber optic probes embedded in high-voltage winding hot spot locations, one sensor measuring top oil temperature for reference, and one multi-channel temperature monitoring unit with 4-8 channel capacity and digital communication capabilities.
Compact sensor designs (3-5mm diameter, 10-15mm length) fit within limited winding spaces without compromising dielectric strength. Installation during manufacturing proves most cost-effective—sensors embedded between winding discs during assembly, with fiber optic cables routed through dedicated bushings. Retrofit solutions exist for pad-mounted and pole-mounted units, typically performed during scheduled maintenance outages.
4.2 Transmission Transformer Systems (110kV-500kV)
Large power transformers (50MVA-1000MVA) require comprehensive monitoring systems with 6-12 temperature points across multiple windings and phases. Critical measurement locations include HV and LV winding hot spots in each phase, top and bottom oil temperatures, and cooling system inlet/outlet differentials.
Additional monitoring points for OLTC (on-load tap changer) contacts detect arcing damage before catastrophic failure. Bushing connector temperatures identify developing contact resistance problems. Advanced systems correlate temperature data with load current, ambient conditions, and cooling equipment status to generate predictive maintenance alerts.
5. Dry-Type Transformer Temperature Monitoring Configurations
5.1 How Do Cast Resin Transformers Benefit from Embedded Sensors?
Epoxy-cast dry-type transformers serving data centers, hospitals, and commercial buildings require embedded sensors installed during manufacturing. Fiber optic temperature sensors positioned within resin-encapsulated windings before casting provide permanent, maintenance-free monitoring for the transformer’s 25-30 year service life.
Class F (155°C) and Class H (180°C) insulation systems benefit from precise monitoring preventing accelerated aging. Real-time temperature data enables coordinated control of forced-air cooling systems, reducing energy consumption while maintaining safe operating temperatures. Mission-critical facilities leverage this monitoring for redundancy verification and load balancing across parallel transformers.
6. How to Install Fiber Optic Sensors in Power Transformers?
6.1 New Transformer Factory Installation
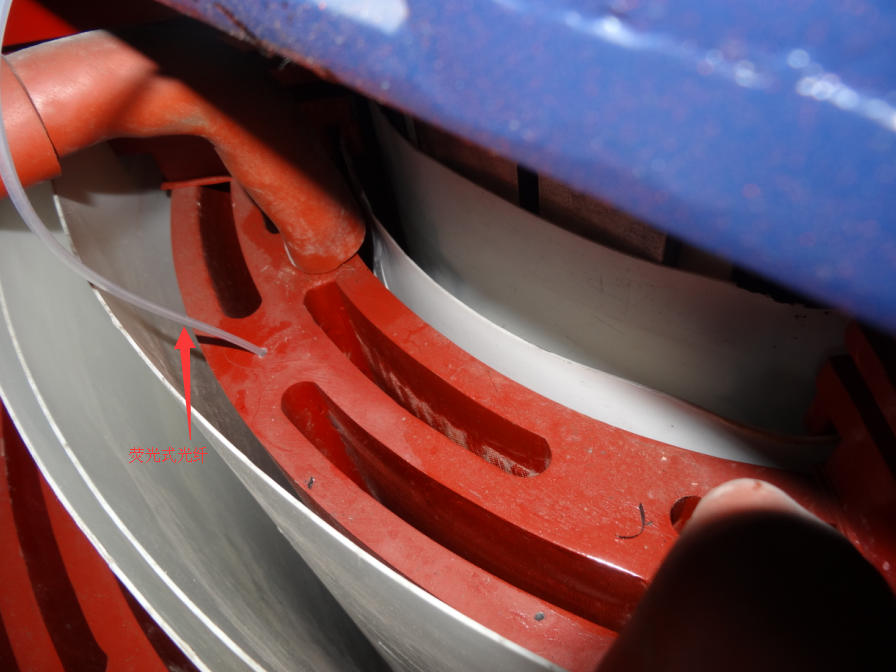
Optimal sensor placement occurs during winding assembly. Transformer manufacturers collaborate with monitoring system suppliers to position fiber optic probes at calculated hot spot locations per thermal modeling. Sensors secure between winding discs using non-metallic ties preventing movement during transportation and operation.
Fiber routing follows the shortest path to exit points while maintaining minimum 40mm bend radius protecting the fragile glass core. Dedicated fiber-optic bushings with appropriate voltage ratings and IP68 sealing bring cables outside the tank. Heat-run tests during factory acceptance validate sensor accuracy against design predictions, establishing baseline thermal performance.
6.2 What’s Involved in Retrofit Installation?
Existing transformers accept sensors through scheduled maintenance outages. The process begins with oil drainage and nitrogen blanketing to prevent moisture ingress. Technicians open inspection manholes and carefully insert sensors between winding discs using specialized insertion tools—long, flexible rods with sensor gripping mechanisms.
Tank penetrations for fiber-optic feedthrough bushings require precision machining maintaining oil seal integrity. Welded fittings or compression glands with multiple O-ring seals prevent leaks. After sensor installation and fiber routing, technicians refill oil under vacuum to eliminate dissolved gases and moisture. Pressure tests verify seal integrity before re-energization.
7. Temperature Monitoring System Architecture and Integration
7.1 System Hardware Components
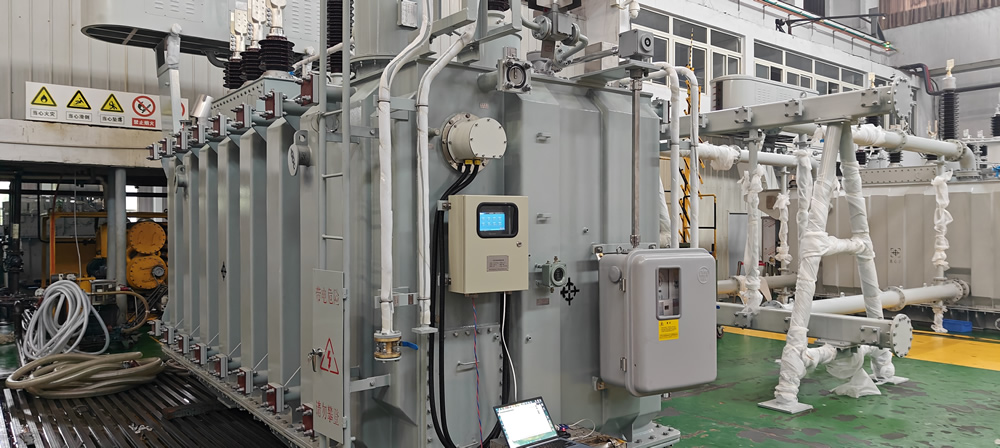
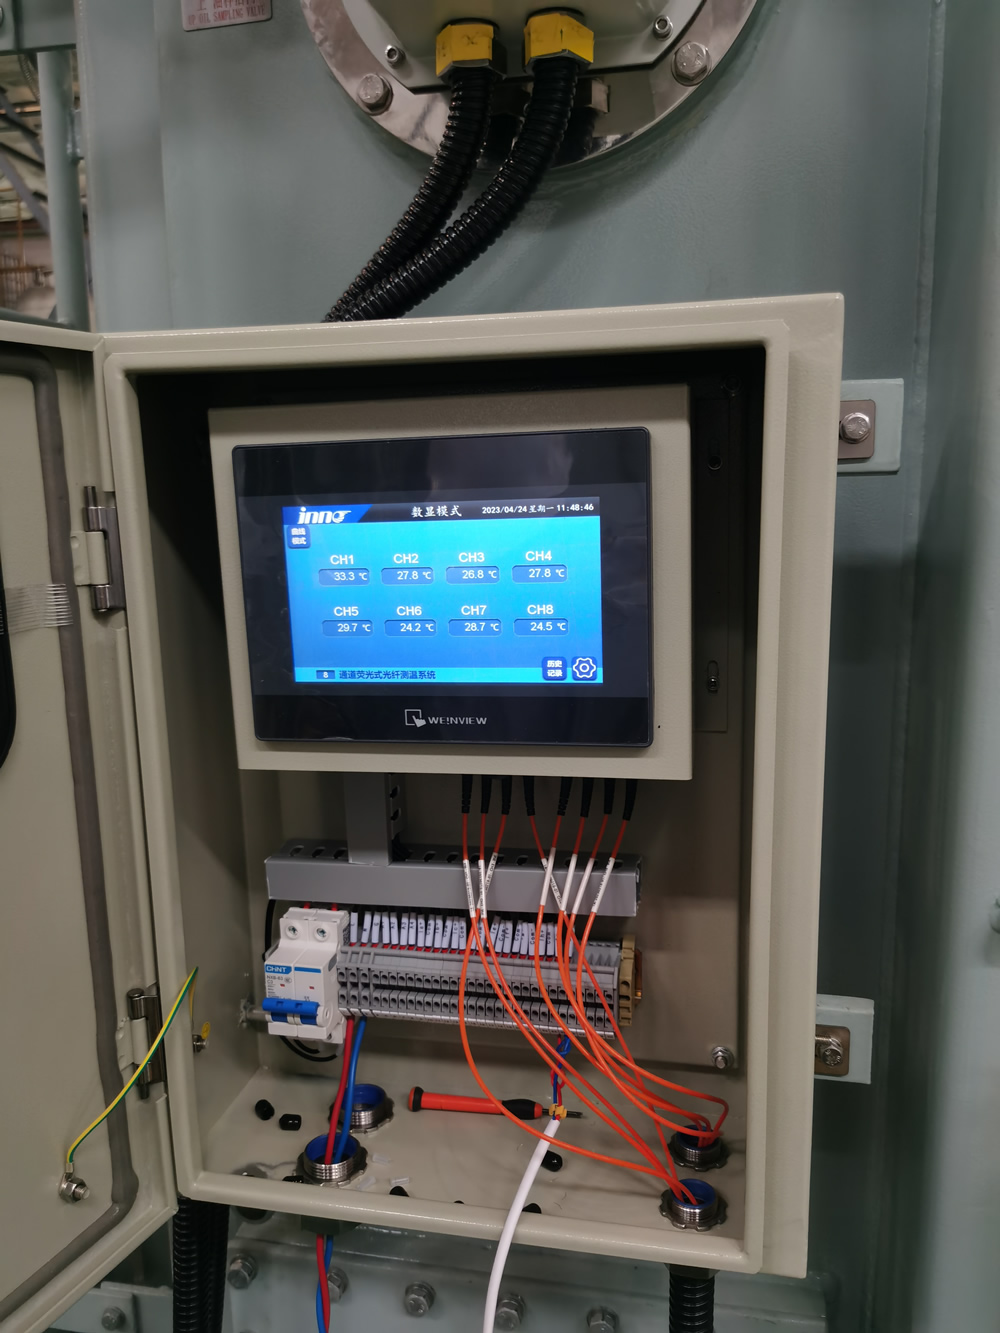
A complete fiber optic temperature monitoring system comprises several key elements: fluorescent fiber optic sensors (measurement probes), optical cables connecting sensors to electronics, signal conditioning units (demodulators) converting optical signals to temperature readings, and display/communication modules interfacing with control systems.
Modern demodulators support 4-32 channels, enabling monitoring of multiple transformers from centralized equipment rooms. Microprocessor-based units provide local displays, configurable alarm outputs (relay contacts and 4-20mA analog signals), and digital communication via Modbus RTU/TCP, DNP3, or IEC 61850 protocols for SCADA integration.
7.2 Integration with Substation Automation Systems
Temperature monitoring systems integrate seamlessly with substation automation platforms, sharing data with asset management databases, predictive maintenance software, and energy management systems. IEC 61850 compliance ensures interoperability across multi-vendor environments, standardizing data models and communication services.
Advanced analytics correlate temperature trends with loading patterns, ambient conditions, and equipment degradation indicators. Machine learning algorithms identify abnormal thermal behavior suggesting developing faults—blocked cooling ducts, failing fans, or incipient winding insulation failure—enabling intervention before failure occurs.
8. Global Implementation Case Studies
8.1 European Utility Transmission Network
A major European transmission operator installed fiber optic hot spot monitoring on 250 substations featuring 400kV, 300MVA autotransformers valued at €3.5 million each. The five-year implementation program yielded remarkable results: zero thermal-related failures versus 2.8% annual failure rate previously, 15% load capacity increase through dynamic rating, €45 million avoided replacement costs, and complete ROI achieved within 28 months.
Monitoring data revealed that 40% of transformers operated with 20-25°C thermal margin during 95% of operating hours, enabling temporary overloads during system contingencies without life reduction. This flexibility deferred construction of two new 400kV substations, saving €180 million in capital expenditure.
8.2 North American Data Center Application
A hyperscale data center operator deployed monitoring on 48 cast-resin dry-type transformers (2.5MVA each, 13.8kV/480V) supporting critical IT loads. Continuous winding temperature tracking enabled predictive maintenance scheduling based on actual thermal stress rather than fixed intervals, reducing outages by 67%.
Temperature-based control optimized forced-air cooling, reducing HVAC energy consumption 12% annually—$340,000 savings across the facility. Documented thermal management extended projected transformer life from 18 to 25+ years, deferring $6.8 million in replacement costs.
8.3 Offshore Wind Farm Reliability Enhancement
Offshore wind farms utilize fiber optic temperature sensors in subsea transformer stations where access requires specialized vessels costing $50,000+ per day. Real-time hot spot monitoring prevents failures in these critical, difficult-to-service locations. One 400MW North Sea wind farm reports 99.7% transformer availability since implementing comprehensive monitoring in 2019, compared to 97.2% industry average for unmonitored offshore substations.
Early detection of cooling pump degradation through temperature trend analysis enabled scheduled maintenance during planned outages rather than emergency repairs, avoiding €2.1 million in lost revenue from forced downtime.
9. Frequently Asked Questions
Q1: What accuracy can fiber optic sensors achieve in transformer applications?
Fluorescent fiber optic sensors provide ±0.5-1°C accuracy across -40°C to +250°C operating ranges, significantly superior to ±5-15°C typical of winding temperature indicators. This precision enables accurate loss-of-life calculations and dynamic rating with confidence intervals suitable for asset management decisions.
Q2: How long do fiber optic temperature sensors last?
Quality fiber optic probes demonstrate 25+ year operational life with zero calibration drift. The phosphor sensing element exhibits no aging mechanisms—temperature measurement depends on fundamental material properties rather than mechanical or electrical characteristics subject to degradation. This longevity matches or exceeds transformer service life, eliminating sensor replacement concerns.
Q3: Can sensors be installed in energized transformers?
No. Installation requires complete de-energization and typically coincides with scheduled maintenance outages to minimize service disruption. For oil-immersed units, oil drainage is necessary for internal sensor placement. Planning sensor installation during major inspections or refurbishments optimizes outage duration and cost-effectiveness.
Q4: What monitoring system features matter most for transformer applications?
Critical capabilities include multi-channel measurement (4-32 points), protocol support for SCADA integration (Modbus, DNP3, IEC 61850), trending analysis with configurable time scales, multiple alarm thresholds with hysteresis, data logging meeting regulatory compliance requirements (10+ year storage), and cybersecurity features for network-connected installations.
Q5: How does hot spot monitoring improve transformer loading capacity?
Accurate hot spot temperature data enables dynamic rating—safely increasing load during cool periods while protecting against thermal damage during peak demand. Utilities report 15-30% capacity increases compared to conservative nameplate ratings. This additional capacity defers new transformer purchases and substation construction, providing ROI through avoided capital expenditure.
Q6: What’s the typical ROI for transformer monitoring systems?
Payback periods range from 2-4 years for critical transmission transformers, considering avoided failure costs, extended equipment life, and dynamic rating benefits. For distribution transformers, ROI extends to 5-8 years but remains attractive when fleet management strategies aggregate benefits across multiple units.
10. Leading Transformer Hot Spot Monitoring Manufacturers

🏆 #1 Fuzhou Innovation Electronic Scie&Tech Co., Ltd.
| Established | 2011 |
| Specialization | Fluorescent fiber optic temperature sensors, multi-channel monitoring systems, SCADA integration solutions |
| Key Products |
|
| Global Reach | 3,000+ installations across 45 countries | Major projects in Europe, Middle East, Southeast Asia |
| web@fjinno.net | |
| WhatsApp/WeChat/Phone | +86 135 9907 0393 |
| 3408968340 | |
| Address | Liandong U Grain Networking Industrial Park, No.12 Xingye West Road, Fuzhou, Fujian, China |
| Why Choose | Industry-leading ±0.5°C accuracy | 25+ year sensor lifespan | Comprehensive technical support | Competitive pricing with 18-month warranty |
Recommended for: Utilities seeking reliable, cost-effective transformer monitoring with proven international track record. Excellent retrofit solutions and responsive technical support team.
🥈 #2 Fuzhou Huaguang Tianrui Photoelectric Technology Co., Ltd.
| Established | 2016 |
| Specialization | Advanced FBG (Fiber Bragg Grating) sensors, distributed temperature monitoring, high-precision demodulation systems |
| Key Products |
|
| Market Focus | Premium market segment | Research institutions | Large-scale transmission projects requiring extensive monitoring |
| Certifications | ISO 9001:2015 | CE | RoHS | IEC 61850 Type Tested |
| Location | Fuzhou High-Tech Industrial Development Zone, Fujian Province, China |
| Competitive Advantages | Cutting-edge FBG technology | In-house R&D capabilities | Customized solutions for complex applications | Strong academic partnerships |
Recommended for: Utilities requiring advanced distributed sensing capabilities, research projects demanding maximum precision, and large transmission transformers needing comprehensive multi-point monitoring.
Partner with Proven Transformer Monitoring Experts
Implementing effective transformer hot spot monitoring requires selecting appropriate technology, proper installation, and reliable long-term support. Whether you’re monitoring a single critical asset or deploying fleet-wide solutions, choosing the right partner determines success.
FJinno specializes in advanced fiber optic temperature sensing solutions for power transformers worldwide. Our engineering team provides comprehensive support from initial sensor selection and system design through installation commissioning and ongoing technical assistance. With over 3,000 successful installations across 45 countries, we understand the unique challenges of transformer monitoring in diverse environments and applications.
Visit www.fjinno.net to discuss your specific monitoring requirements, request technical documentation, or schedule a consultation with our transformer monitoring specialists. Our team responds to inquiries within 24 hours and provides customized solutions tailored to your operational needs and budget constraints.
Disclaimer
This article provides general information about transformer hot spot monitoring technologies and solutions based on industry best practices and published technical standards. While we strive for accuracy and completeness, specific applications require professional engineering evaluation considering local conditions, regulations, and operational requirements.
Transformer monitoring system design, installation, and operation must comply with applicable electrical codes (NEC, IEC), manufacturer specifications, and safety regulations in your jurisdiction. High-voltage equipment installation requires qualified personnel with appropriate training, certifications, and safety equipment. Improper installation may compromise transformer safety, violate warranties, or create hazardous conditions.
FJinno and www.fjinno.net assume no liability for decisions made based on this content. Product specifications, industry standards, and best practices evolve over time—verify current information with manufacturers and consulting engineers before implementation. Performance claims and case study results represent specific installations and may not apply universally to all applications or operating conditions.
Always consult qualified electrical engineers, follow established safety procedures, and adhere to manufacturer instructions when working with high-voltage equipment. Contact equipment manufacturers directly for definitive technical specifications, compatibility verification, and application-specific guidance.

Fiber optic temperature sensor, Intelligent monitoring system, Distributed fiber optic manufacturer in China
 |
 |
 |