 INNO fibre optic temperature sensors ,temperature monitoring systems.
Why Choose Transformer PD Online Monitoring?
- ✅ 24/7 Real-Time Monitoring – Continuous detection without power outages
- ✅ Early Warning Capability – Detect insulation defects 6-18 months in advance
- ✅ High Sensitivity Detection – 5pC measurement precision captures weak discharges
- ✅ Non-Invasive Installation – External TEV sensors without structural modifications
- ✅ Intelligent Diagnostics – Automated discharge type identification and severity assessment
- ✅ Reduced Maintenance Costs – Decrease unplanned outage losses by 85%
- ✅ Seamless System Integration – RS485/Modbus connectivity with SCADA platforms
- ✅ Industrial-Grade Protection – IP65 rating for harsh environments
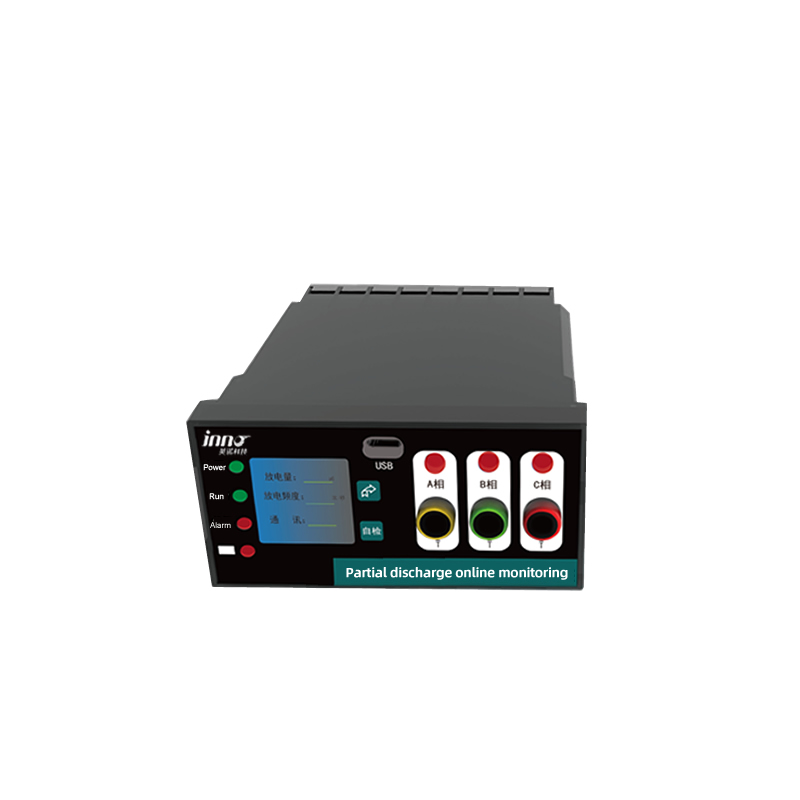
Standard System Configuration
- 📡 TEV Transient Earth Voltage Sensors – Detect discharge signals on tank surface
- 🎤 Ultrasonic Sensors (Optional) – 300kHz-500kHz acoustic detection
- 🖥️ PD Monitoring Host – Multi-channel signal processing (4-8 channels)
- ⚡ Power Supply – AC 220V rated voltage
- 🔌 Communication Interface – RS485 Modbus RTU/TCP protocol
- 🛡️ Environmental Protection – IP65 enclosure rating
- 📊 Analysis Software Platform – PRPD pattern recognition and trend analysis
- 🌡️ Optional: Fiber Optic Temperature Monitoring – Winding/oil temperature comprehensive monitoring
- ☁️ Cloud Platform Connection – Remote monitoring and data analytics
Table of Contents
- What is Transformer Partial Discharge Online Monitoring Device? Core Functions Explained
- Why Do Transformers Experience Partial Discharge? Common Causes Analysis
- How Does TEV Transient Earth Voltage Detection Technology Work? Principle Explained
- What Are the Core Components of Transformer PD Monitoring Sensors?
- How to Properly Install PD Sensors? Where Are the Optimal Installation Locations?
- What Sensitivity Can the Monitoring System Achieve? What Does 5pC Precision Mean?
- How Does the Monitoring System Interface with Automation Platforms? Communication Protocol Explanation
- How to Identify Different Types of Insulation Defects? Diagnostic Techniques Revealed
- PD + Oil Temperature Comprehensive Monitoring: How to Achieve Complete Transformer Health Assessment?
- How to Select the Right PD Monitoring Solution? Key Technical Specifications
- Frequently Asked Questions (FAQ)
- Recommended Manufacturer
- Contact Information
- Disclaimer
1. What is Transformer Partial Discharge Online Monitoring Device? Core Functions Explained

A transformer partial discharge online monitoring system is a specialized intelligent device designed for real-time monitoring of insulation conditions in power transformers. Unlike traditional offline testing methods that require scheduled shutdowns, these systems provide continuous 24/7 surveillance of transformer health status.
Working Principle
The system captures discharge signals through TEV sensors and ultrasonic sensors mounted on the transformer tank surface. When partial discharge occurs within the insulation system, it generates electromagnetic pulses and acoustic waves that propagate through the oil and tank structure. The sensors detect these signals and transmit them to the monitoring host for real-time analysis.
Primary Functions
Real-Time Monitoring Capability
The system operates continuously without interrupting transformer service. It processes signals from multiple sensors simultaneously, providing instant alerts when discharge activity exceeds preset thresholds. This enables maintenance teams to respond to developing problems before they escalate into catastrophic failures.
Insulation Condition Assessment
Partial discharge monitoring equipment evaluates insulation integrity by analyzing discharge patterns, intensity, and frequency. The system generates comprehensive health reports that help determine remaining useful life and optimal maintenance timing.
Predictive Maintenance Intelligence
By tracking discharge trends over time, the system identifies gradual deterioration patterns. This data-driven approach enables maintenance scheduling based on actual equipment condition rather than arbitrary time intervals, reducing unnecessary interventions while preventing unexpected outages.
Comparison: Online vs. Offline Detection
| Aspect | Online Monitoring | Offline Testing |
|---|---|---|
| Availability | 24/7 continuous operation | Requires scheduled outage |
| Early Detection | 6-18 months advance warning | Snapshot at test moment |
| Operating Conditions | Under actual load and voltage | De-energized state only |
| Installation Method | External non-invasive sensors | Internal test connections |
| Data Continuity | Continuous trending analysis | Periodic snapshots only |
2. Why Do Transformers Experience Partial Discharge? Common Causes Analysis
Understanding the root causes of partial discharge in transformers is essential for implementing effective monitoring strategies. Discharge activity typically results from insulation system degradation triggered by multiple stress factors.
Insulation Material Aging Mechanisms
Thermal Aging
Sustained operation at elevated temperatures accelerates chemical breakdown of cellulose insulation and mineral oil. The Arrhenius equation demonstrates that each 8°C temperature increase approximately doubles the aging rate. Thermal cycling during load variations creates mechanical stress that compounds degradation.
Electrical Stress
Continuous exposure to high electric fields causes gradual polarization and molecular chain scission in solid insulation materials. Overvoltage events during switching operations or lightning strikes can create localized damage that initiates discharge sites.
Mechanical Stress
Short-circuit forces generate tremendous mechanical loads on windings and insulation structures. Repeated electromagnetic forces during fault conditions can loosen clamping structures and create gaps where discharges develop.
Chemical Contamination
Moisture ingress, oxidation byproducts, and dissolved gases chemically attack insulation systems. Water content above 2% significantly reduces dielectric strength, while acids from oil degradation accelerate paper insulation deterioration.
Manufacturing and Installation Defects
Gas Bubbles in Insulation Oil
Incomplete degassing during manufacturing or improper oil filling procedures can trap air bubbles. These low-density voids have significantly lower dielectric strength than surrounding oil, creating preferential discharge sites.
Internal Voids in Solid Insulation
Inadequate vacuum impregnation or poor manufacturing quality control can leave microscopic cavities within pressboard barriers and paper wrapping. These voids ionize at voltages well below the bulk material breakdown strength.
Damaged Winding Insulation
Transportation damage, rough handling during installation, or manufacturing defects can create punctures or abrasions in conductor insulation. These compromised areas concentrate electric stress and initiate discharge activity.
Poor Connection Contact
Loose terminal connections or improper lead positioning create localized hot spots and enhanced electric fields. The combination of thermal and electrical stress at these junctions frequently triggers discharge phenomena.
Operating Environment Impact Factors
| Environmental Factor | Impact on Insulation | Resulting Defect |
|---|---|---|
| Oil Quality Deterioration | Reduced dielectric strength, increased acidity | Surface tracking, general degradation |
| Temperature Cycling | Thermal expansion/contraction cycles | Void formation, mechanical loosening |
| Moisture Ingress | Hygroscopic absorption in cellulose | Reduced breakdown voltage, accelerated aging |
| Overload Operation | Excessive temperature, increased electrical stress | Rapid insulation degradation, hot spots |
Consequences of Undetected Partial Discharge
Without proper PD monitoring systems, minor discharge activity progressively erodes insulation integrity. Statistics from utility operators demonstrate that 60% of transformer failures involve insulation breakdown that developed over months or years. The financial impact includes:
- Emergency replacement costs averaging $500,000-$2,000,000 per unit
- Lost revenue from extended outages ($50,000-$200,000 per day for critical substations)
- Collateral damage to adjacent equipment from catastrophic failures
- Regulatory penalties for reliability standard violations
- Potential safety hazards including fire and explosion risks
3. How Does TEV Transient Earth Voltage Detection Technology Work? Principle Explained

TEV sensors represent a breakthrough in non-intrusive partial discharge detection methodology. This technology exploits the electromagnetic pulse propagation characteristics inherent to discharge phenomena.
Physical Principles
Electromagnetic Pulse Propagation
When partial discharge occurs within transformer insulation, the rapid charge movement generates a high-frequency electromagnetic pulse (typically 10 MHz to 100 MHz). This pulse propagates through the insulating oil and transformer tank structure at near light speed.
Tank Surface Voltage Formation
As the electromagnetic wave encounters the metal tank wall, it induces transient circulating currents in the conductive surface. These currents create momentary voltage differences between different points on the grounded tank – the transient earth voltage phenomenon.
TEV Signal Characteristics
Typical TEV signals exhibit pulse widths of 10-100 nanoseconds with peak amplitudes ranging from millivolts to several volts depending on discharge magnitude and sensor proximity. The signal frequency spectrum provides diagnostic information about discharge source type and location.
Signal Acquisition Process
Step 1: Electromagnetic Pulse Capture
Capacitive coupling sensors positioned on the tank exterior detect voltage transients without requiring galvanic connection. The sensor design incorporates high-frequency response characteristics (DC to 500 MHz) while rejecting low-frequency noise.
Step 2: Real-Time Digital Processing
Advanced PD monitoring devices employ high-speed analog-to-digital converters (100-500 MS/s sampling rates) to accurately capture the fast-rising TEV waveforms. Digital signal processing algorithms extract relevant parameters including pulse amplitude, repetition rate, and phase relationship to the power frequency.
Step 3: Signal Analysis and Identification
Sophisticated pattern recognition algorithms distinguish genuine partial discharge from electromagnetic interference sources such as switching transients, radio broadcasts, or corona from external equipment. Multi-sensor correlation and time-domain analysis enhance discrimination accuracy.
Step 4: Data Transmission
Processed discharge data transmits via RS485 or Ethernet communication to central monitoring systems. The data stream includes discharge magnitude, occurrence time, phase position, and diagnostic classifications.
Ultrasonic Detection Complementary Technology
Acoustic Detection Advantages
Ultrasonic sensors provide an independent measurement modality sensitive to the acoustic emissions generated by discharge events. Operating in the 20 kHz to 500 kHz frequency range, these sensors detect mechanical vibrations propagating through oil and tank structure. The combination of TEV and ultrasonic measurements provides superior noise rejection and location accuracy compared to either method alone.
Combined TEV and Ultrasonic Application
Dual-technology systems cross-validate detections, requiring coincident signals from both sensor types before triggering alarms. This approach reduces false positive rates to below 5% in high-noise industrial environments. Time-of-flight analysis from multiple ultrasonic sensors enables triangulation to pinpoint discharge source locations within ±10 cm accuracy.
4. What Are the Core Components of Transformer PD Monitoring Sensors?

A comprehensive partial discharge monitoring system integrates multiple subsystems working in coordinated fashion to deliver reliable condition assessment.
System Architecture
| Component | Specifications | Function |
|---|---|---|
| TEV Sensors | Frequency range: DC-500MHz, Sensitivity: 5pC minimum | Electromagnetic pulse detection on tank surface |
| Ultrasonic Sensors (Optional) | Frequency: 300-500kHz, Piezoelectric type | Acoustic emission detection for location |
| Monitoring Host | 4-8 channel inputs, 100MS/s ADC, 32-bit processor | Signal processing, pattern recognition, data storage |
| Analysis Software | PRPD analysis, trending, reporting modules | Discharge classification, health assessment |
| Communication Module | RS485 Modbus RTU/TCP, Ethernet, optional 4G | SCADA integration, remote data access |
| Installation Hardware | Magnetic mounts, adhesive pads, bolt fixtures | Sensor attachment to transformer tank |
Advanced Configuration Options
Wireless Communication Modules
For installations where hardwired connections are impractical, wireless options including 4G LTE or LoRaWAN provide reliable data transmission. Battery backup systems ensure continuous operation during power supply interruptions.
Edge Computing Units
Local processing capabilities enable real-time alarm generation and preliminary analysis without dependence on central server availability. This distributed architecture improves system resilience and reduces network bandwidth requirements.
Cybersecurity Modules
Network-connected monitoring systems incorporate industrial firewalls, encrypted communications (TLS 1.3), and role-based access control to protect against cyber threats targeting critical infrastructure.
5. How to Properly Install PD Sensors? Where Are the Optimal Installation Locations?
Proper sensor placement critically influences partial discharge detection effectiveness. Installation methodology must balance detection sensitivity with practical mounting considerations.
Installation Methods Comparison
| Method | Advantages | Limitations | Best Applications |
|---|---|---|---|
| Magnetic Attachment | Quick installation, removable, no surface preparation | Limited holding force on curved surfaces | Flat tank walls, temporary monitoring |
| Adhesive Bonding | Conforms to irregular surfaces, permanent installation | Surface preparation required, difficult removal | Curved surfaces, long-term monitoring |
| Bolt Fixation | Most secure, precise positioning, adjustable | Requires drilling, minor tank modification | Critical applications, permanent installations |
Optimal Sensor Placement Strategy
Tank Body Monitoring Points
Position sensors on the main tank walls at mid-height to maximize sensitivity to discharges occurring in core and coil regions. Avoid placement near structural reinforcements or cooling equipment that may shield electromagnetic signals.
Bushing Base Locations
The bushing-to-tank junction represents a critical stress concentration area. TEV sensors mounted within 30 cm of each bushing flange effectively monitor this high-risk zone where oil contamination and moisture often accumulate.
Tap Changer Region
Load tap changers generate significant discharge activity during normal operation. Dedicated sensor coverage of the LTC compartment enables discrimination between normal switching transients and abnormal discharge indicative of contact wear or diverter switch problems.
Lead Exit Areas
High-voltage leads penetrating the tank require adequate clearances that may deteriorate due to thermal cycling or mechanical movement. Sensors positioned near lead bushings provide early warning of developing insulation failures.
Multi-Sensor Configuration Guidelines
Small Transformers (≤10 MVA)
Deploy 2-4 PD sensors covering major tank surfaces and primary bushings. This minimal configuration provides adequate coverage for distribution transformers where economic constraints limit extensive instrumentation.
Medium Transformers (10-100 MVA)
Install 4-6 sensors including dedicated coverage for each phase bushing, LTC compartment, and main body zones. This arrangement enables basic location triangulation and redundant detection.
Large Transformers (≥100 MVA)
Comprehensive monitoring requires 6-12 sensors strategically distributed to cover all critical regions. Large power transformers justify extensive instrumentation given their capital value ($2M-$10M+) and system criticality.
Installation Best Practices
- Clean mounting surfaces with isopropyl alcohol to remove contaminants that degrade signal coupling
- Verify sensor orientation aligns with manufacturer specifications for optimal electromagnetic coupling
- Route signal cables away from high-current conductors to minimize inductive interference
- Document sensor positions with photographs and dimensional measurements for future reference
- Perform baseline measurements within 24 hours of installation to establish reference signatures
- Apply weatherproof sealant around cable entry points to maintain IP65 protection rating
6. What Sensitivity Can the Monitoring System Achieve? What Does 5pC Precision Mean?
Detection sensitivity directly determines how early partial discharge monitoring equipment can identify developing insulation problems. The industry-standard 5 picocoulomb (pC) threshold represents the state-of-the-art in modern systems.
Discharge Magnitude Classification
| Discharge Level | Typical Causes | Recommended Action | Time to Failure |
|---|---|---|---|
| 5-50 pC | Minor voids, early-stage contamination | Increase monitoring frequency, trend analysis | 12-24 months |
| 50-500 pC | Moderate void activity, surface tracking | Schedule inspection, oil analysis, consider filtration | 6-18 months |
| 500-5000 pC | Significant insulation damage, loose particles | Plan outage for internal inspection, prepare replacement | 3-12 months |
| >5000 pC | Severe breakdown, imminent failure risk | Emergency de-rating or immediate shutdown | Days to weeks |
Sensitivity and Noise Rejection Balance
Achieving 5pC detection capability while maintaining low false alarm rates requires sophisticated signal processing. Modern PD monitoring systems employ multiple discrimination techniques:
Noise Suppression Algorithms
Adaptive filtering techniques distinguish between periodic discharge pulses synchronized with power frequency and random electromagnetic interference. Fast Fourier Transform (FFT) analysis identifies frequency signatures characteristic of genuine partial discharge versus external noise sources.
Multi-Parameter Correlation Validation
Simultaneous evaluation of pulse amplitude, phase position, repetition rate, and frequency spectrum provides multi-dimensional classification. Discharge events must satisfy multiple criteria before triggering alarms, reducing spurious detections.
Machine Learning-Based Classification
Pattern recognition algorithms trained on databases containing thousands of confirmed discharge events achieve >95% classification accuracy. The system learns to distinguish between corona, surface discharge, void discharge, and various interference sources based on characteristic pulse shapes and phase-resolved patterns.
Voltage Class Considerations
Detection requirements scale with transformer voltage rating. High-voltage transformers (>230 kV) typically require sub-10pC sensitivity due to larger insulation clearances and higher dielectric stress. Distribution transformers (≤69 kV) may accept 10-50pC thresholds given the reduced stress levels and lower criticality.
7. How Does the Monitoring System Interface with Automation Platforms? Communication Protocol Explanation
Integration with existing SCADA systems and substation automation infrastructure enables centralized monitoring and coordinated asset management across multiple facilities.
Supported Communication Protocols
| Protocol | Interface Type | Data Rate | Typical Application |
|---|---|---|---|
| Modbus RTU | RS485 serial | 9600-115200 baud | Local substation networks, PLC integration |
| Modbus TCP/IP | Ethernet | 10/100 Mbps | SCADA systems, enterprise networks |
| IEC 61850 | Ethernet (GOOSE/MMS) | 100 Mbps/1 Gbps | Digital substations, IED interoperability |
| OPC UA | Ethernet/Internet | Variable | Enterprise integration, cloud connectivity |
Cloud Platform Capabilities
Real-Time KPI Visualization
Web-based dashboards provide instant access to current discharge levels, alarm status, and operating parameters from any internet-connected device. Customizable views enable different stakeholders (operators, engineers, management) to access relevant information at appropriate detail levels.
Historical Trend Analysis
Cloud storage retains years of discharge data enabling long-term degradation trend identification. Statistical analysis tools automatically detect accelerating deterioration rates that may indicate approaching end-of-life conditions.
Multi-Channel Alert Distribution
Alarm notifications distribute via email, SMS, mobile app push notifications, and phone calls based on severity levels and on-call schedules. Escalation procedures ensure critical alerts reach appropriate personnel even during off-hours.
Predictive Maintenance Scheduling
Advanced analytics correlate discharge trends with remaining useful life models to recommend optimal maintenance timing. This data-driven approach maximizes asset utilization while minimizing failure risk.
Automated Compliance Reporting
Regulatory requirements often mandate periodic condition assessment reports. Cloud platforms automatically generate formatted reports documenting monitoring activities, test results, and maintenance actions for regulatory submission.
SCADA Integration Architecture
Typical integration employs a hierarchical architecture where PD monitoring hosts function as intelligent field devices communicating via Modbus or IEC 61850 to substation controllers. These controllers aggregate data from multiple monitoring systems and forward processed information to central SCADA servers. This layered approach distributes processing load while maintaining system resilience if network segments fail.
8. How to Identify Different Types of Insulation Defects? Diagnostic Techniques Revealed
Accurate defect classification enables targeted maintenance interventions and appropriate urgency assessment. Partial discharge analysis employs multiple diagnostic methodologies to characterize insulation problems.
PRPD Pattern Recognition
Phase-Resolved Partial Discharge (PRPD) analysis displays discharge magnitude and quantity as a function of phase position in the AC voltage cycle. Different defect types produce characteristic fingerprint patterns in this phase-magnitude-number representation.
Typical Defect Signatures
| Defect Type | PRPD Characteristics | Common Locations | Urgency Level |
|---|---|---|---|
| Corona Discharge | Symmetrical peaks near voltage maxima (90°/270°) | Bushing terminals, lead connections | Low (unless amplitude increasing) |
| Void Discharge | Concentrated activity in rising voltage quadrants | Solid insulation (pressboard, paper wraps) | Medium-High (progressive damage) |
| Surface Discharge | Asymmetric pattern, more activity on one polarity | Oil-solid boundaries, contaminated surfaces | High (can lead to tracking failure) |
| Floating Particle | Irregular pulses throughout cycle, amplitude variation | Oil volume, especially near high-field regions | Medium (oil filtration may resolve) |
Advanced Diagnostic Capabilities
Modern monitoring systems achieve >95% automatic classification accuracy through pattern recognition algorithms trained on extensive discharge databases. Deep learning models analyze not only phase-position patterns but also pulse shape characteristics, frequency spectra, and temporal evolution to distinguish between defect types that produce similar PRPD fingerprints.
Multi-sensor correlation further enhances diagnostic confidence. When TEV and ultrasonic sensors simultaneously detect discharge activity, triangulation algorithms calculate the three-dimensional source position within the transformer. This location information narrows the defect diagnosis – for example, activity localized near the tap changer suggests contact problems rather than winding insulation issues.
9. PD + Oil Temperature Comprehensive Monitoring: How to Achieve Complete Transformer Health Assessment?
Comprehensive condition monitoring requires evaluating both electrical and thermal stresses since 60% of transformer failures involve combined mechanisms. Integrating partial discharge detection with fiber optic temperature monitoring provides complete health visibility.
Why Combined Monitoring?
Electrical insulation degradation and thermal aging proceed through interdependent mechanisms. Elevated temperatures accelerate chemical breakdown of insulation materials, while partial discharge generates localized heating that compounds thermal stress. Monitoring only one parameter provides an incomplete failure risk assessment.
Electrical Insulation Problems
PD monitoring detects dielectric breakdown, contamination, moisture ingress, and mechanical defects affecting insulation integrity. These electrical faults may develop without significant temperature rise until catastrophic failure occurs.
Thermal Fault Detection
Oil temperature monitoring identifies cooling system failures, blocked oil circulation, excessive load current, and contact resistance problems. Many thermal faults progress to failure without producing detectable partial discharge activity.
Fluorescent Fiber Optic Temperature System
| Specification | Value | Significance |
|---|---|---|
| Temperature Range | -40°C to +260°C | Covers all operating conditions including emergency overloads |
| Measurement Accuracy | ±1°C | Sufficient precision for hot spot detection and trending |
| Resolution | 0.1°C | Detects subtle temperature changes indicating developing problems |
| Channel Capacity | Up to 12 channels | Monitors multiple winding locations and oil regions simultaneously |
| Communication Interface | RS485 Modbus RTU/TCP | Integrates with same platforms as PD monitoring system |
| Certifications | Withstand voltage test reports, Type test certificates | Verified electrical safety and performance standards compliance |
Critical Temperature Measurement Points
Winding Hot Spot Locations
Fiber optic probes positioned within winding assemblies measure the hottest conductor temperatures directly. These readings provide accurate thermal aging assessment since insulation life halves for every 8°C temperature increase above rated levels.
Top Oil Temperature
The highest oil temperature in the main tank indicates overall thermal loading and cooling system effectiveness. Comparison with calculated values based on load current identifies cooling circuit blockages or pump failures.
Tap Changer Contact Temperature
Contact resistance increases due to wear, oxidation, or misalignment generate localized heating. Temperature monitoring of tap changer contacts provides early warning of developing contact problems before failure occurs.
Lead Connection Points
Terminal connections and internal lead joints represent potential weak points where inadequate contact pressure creates resistance heating. Temperature sensors at these locations detect progressive connection deterioration.
Integrated Condition Assessment Strategy
Thermal Runaway Detection
If winding temperature exceeds limits while partial discharge remains normal, the problem involves thermal mechanisms (cooling failure, overload). The system triggers load reduction before insulation damage occurs.
Insulation Degradation Identification
When partial discharge increases at normal operating temperatures, electrical insulation problems exist. Planned outage for inspection can proceed at convenient scheduling rather than emergency basis.
Combined Stress Warning
Simultaneous elevation of both discharge activity and winding temperature indicates severe operating conditions or multiple defects. This combination justifies immediate load reduction and expedited maintenance planning.
Statistical analysis from utility operators demonstrates that combined PD and temperature monitoring reduces false alarm rates by 60% compared to single-parameter systems while detecting 95% of failures that develop advance warning signatures.
10. How to Select the Right PD Monitoring Solution? Key Technical Specifications
Selecting appropriate transformer monitoring equipment requires evaluating technical capabilities against application requirements and budget constraints.
Core Technical Parameters
| Parameter | Minimum Requirement | Preferred Specification |
|---|---|---|
| Detection Sensitivity | 10-50 pC | 5 pC minimum detectable |
| Frequency Range | 100 kHz – 50 MHz | DC – 500 MHz |
| Sampling Rate | 50 MS/s | 100+ MS/s |
| Channel Count | 4 channels | 8+ channels with expansion capability |
| Installation Method | Non-invasive external sensors | Multiple mounting options (magnetic, adhesive, bolt) |
| Environmental Protection | IP54 | IP65 or higher |
| Communication Protocols | Modbus RTU | Modbus RTU/TCP, IEC 61850, OPC UA |
Supplier Evaluation Criteria
Certifications and Compliance
Verify that equipment holds relevant certifications including CE marking, UL/CSA approvals where applicable, and compliance with IEEE, IEC, or national standards for partial discharge measurement. Request third-party test reports validating performance claims.
Technical Support Capabilities
Assess the manufacturer’s ability to provide application engineering assistance, commissioning support, and ongoing technical consultation. Experienced suppliers offer training programs for maintenance personnel and rapid response to technical inquiries.
Customization Services
Standard configurations may not suit all applications. Evaluate the supplier’s willingness and capability to customize sensor configurations, software features, communication protocols, and reporting formats to match specific requirements.
Delivery Performance
Manufacturing lead times vary from 2-12 weeks depending on configuration complexity and order volume. Establish clear delivery schedules with penalty clauses for critical projects where delayed monitoring implementation increases failure risk.
System Expandability Considerations
Channel Expansion Capability
Initial installations may monitor limited transformer populations, but future expansion plans should influence system selection. Choose platforms supporting modular expansion without replacing core infrastructure.
Firmware Upgrade Support
Monitoring technology continues evolving with improved algorithms and new diagnostic capabilities. Select systems offering field-upgradeable firmware to extend equipment useful life and adopt advances without hardware replacement.
Smart Grid Standard Compatibility
Emerging smart grid initiatives employ standardized communication protocols like IEC 61850 for interoperability. Choose systems supporting these standards to ensure compatibility with evolving substation automation architectures.
Cloud Platform Connectivity
Remote monitoring and centralized asset management increasingly rely on cloud-based platforms. Verify that monitoring systems support secure internet connectivity and offer cloud service integration either directly or through gateways.
11. Frequently Asked Questions
What detection sensitivity can transformer PD monitoring achieve? What does 5pC mean?
Modern PD monitoring systems achieve 5 picocoulomb (pC) measurement precision, representing the electrical charge transferred during a single discharge pulse. For perspective, 5pC equals 3.1 million electrons – a remarkably small quantity requiring sophisticated electronics to detect reliably. This sensitivity enables early detection of minor insulation defects 6-18 months before they progress to failure, providing substantial lead time for planned maintenance scheduling.
How many transformers can one system monitor?
A single monitoring host typically supports 4-8 sensor input channels. Each transformer requires 2-12 sensors depending on size and criticality, so one host can monitor anywhere from one large critical transformer to 2-4 smaller distribution units. For larger installations, multiple hosts networked together provide scalable monitoring capacity. Some advanced systems offer channel expansion modules supporting 16+ inputs from a single processing unit.
How to distinguish genuine PD signals from external interference?
Advanced PD detection systems employ multiple discrimination techniques including phase-resolved pattern analysis, multi-parameter correlation validation, and machine learning-based classification algorithms. Genuine partial discharge exhibits characteristic phase relationships to the power frequency voltage, specific pulse shapes, and consistent repetition patterns. External interference typically appears as random pulses without phase correlation or displays frequency spectra distinct from discharge phenomena. Multi-sensor correlation requiring coincident detection from multiple locations further validates genuine discharge versus noise. Modern systems achieve >95% discrimination accuracy.
What types of insulation defects can the system identify?
Partial discharge analysis distinguishes between corona discharge from sharp points or loose connections, void discharge within solid insulation materials, surface discharge along contaminated boundaries, and floating particle activity in oil. Each defect type produces characteristic PRPD (Phase-Resolved Partial Discharge) fingerprints that automated classification algorithms identify. Combined with location information from multi-sensor triangulation, the system narrows diagnosis to specific components (bushings, tap changers, winding insulation) guiding targeted inspection and repair.
Does sensor installation require power shutdown?
No. TEV sensors use completely non-invasive external mounting methods requiring no electrical connection to the transformer. Installation via magnetic attachment, industrial adhesive, or bolt fixtures proceeds with the transformer fully energized and in service. Typical installation time ranges from 30 minutes to 2 hours depending on accessibility and the number of sensors deployed. This live-installation capability eliminates outage costs and enables immediate monitoring implementation.
What is the TEV sensor lifespan? Does it require maintenance?
Quality TEV sensors demonstrate operational lifespans exceeding 10-15 years in normal outdoor substation environments. The sensors contain no moving parts or consumable elements requiring replacement. Periodic maintenance consists of visual inspection for physical damage and verification that mounting hardware remains secure. Annual sensor response verification using portable calibration sources confirms continued performance. Properly installed sensors with IP65 or higher environmental protection operate reliably throughout this lifespan with minimal intervention.
How does the system interface with existing automation platforms?
PD monitoring systems support standard industrial protocols including Modbus RTU (RS485 serial), Modbus TCP/IP (Ethernet), IEC 61850 (digital substation standard), and OPC UA (enterprise integration). Configuration involves assigning register addresses for data points (discharge magnitude, alarm status, sensor readings) and setting communication parameters (baud rate, IP address, protocol variant). Most SCADA platforms and programmable logic controllers natively support these protocols enabling straightforward integration. Manufacturers typically provide protocol implementation guides and pre-configured templates for common automation platforms.
How is monitoring data stored long-term? What cloud platform capabilities exist?
Local monitoring hosts store recent data (typically 6-12 months) in internal flash memory. For long-term archival, systems transmit data to central servers or cloud platforms where retention extends to decades. Cloud platforms provide web-based dashboards accessible from any internet-connected device, automated report generation, multi-site comparative analysis, and predictive analytics identifying fleet-wide degradation trends. Advanced platforms incorporate machine learning models that analyze discharge patterns across thousands of transformers to refine diagnostic algorithms and improve prediction accuracy.
How to reduce false alarm rates? What is the typical false positive percentage?
Properly configured systems achieve false alarm rates below 5% through multiple techniques. Noise suppression algorithms filter electromagnetic interference from radio broadcasts, switching transients, and nearby equipment. Multi-sensor correlation requires simultaneous detection from multiple locations before triggering alarms. Adaptive threshold adjustment prevents alarms from normal background activity while maintaining sensitivity to abnormal discharge. Pattern recognition validates that detected signals match known discharge signatures rather than interference. Regular baseline updating accounts for gradual changes in normal operating signatures preventing spurious trending alarms.
What advantages does combined PD and oil temperature monitoring provide? What is the ROI?
Integrated monitoring addresses both electrical and thermal failure mechanisms, covering 60% of transformer failures involving combined stresses. Return on investment calculations demonstrate payback periods of 1-3 years for critical transformers when considering prevented outage costs, extended asset life, and optimized maintenance scheduling. For a $3 million power transformer in critical service, a $50,000 monitoring system investment prevents potential $500,000+ emergency replacement costs plus $100,000+ daily outage losses. The combined approach reduces false alarms by 60% while detecting 95% of failures exhibiting advance warning signatures.
12. Recommended Manufacturer
Fuzhou Innovation Electronic Stech Co., Ltd.
Established: 2011
Specialization: Transformer partial discharge monitoring systems, fiber optic temperature monitoring solutions, substation automation equipment
Why Choose Fuzhou Innovation Electronic?
- ✅ 13+ Years Industry Experience – Proven track record in power system monitoring applications
- ✅ Comprehensive Product Range – Complete solutions from sensors to cloud platforms
- ✅ Certified Quality Standards – ISO 9001 manufacturing, CE/RoHS compliance
- ✅ Technical Expertise – In-house R&D team with power system engineering backgrounds
- ✅ Customization Capability – Tailored configurations for specific application requirements
- ✅ Global Support Network – Technical assistance and spare parts availability
- ✅ Competitive Pricing – Factory-direct pricing without distributor markups
- ✅ Rapid Delivery – Standard configurations ship within 2-3 weeks
Product Portfolio
- 📡 TEV Partial Discharge Sensors – High sensitivity electromagnetic pulse detection
- 🎤 Ultrasonic PD Sensors – Acoustic emission detection for precise location
- 🖥️ Multi-Channel Monitoring Hosts – 4, 8, and 16 channel configurations
- 🌡️ Fluorescent Fiber Optic Temperature Systems – -40°C to +260°C measurement range
- 📊 PRPD Analysis Software – Advanced pattern recognition and trending
- ☁️ Cloud Monitoring Platforms – Web-based dashboards and mobile apps
- 🔌 Communication Gateways – Protocol conversion for legacy system integration
13. Contact Information
Request Free Technical Consultation
Our application engineers provide complimentary consultation services including:
- Site-specific monitoring system design recommendations
- Sensor quantity and placement optimization
- Integration planning with existing SCADA infrastructure
- Budget quotations with detailed specifications
- ROI analysis and payback period calculations
| web@fjinno.net | |
| WhatsApp/WeChat(China)/Phone: | +8613599070393 |
| 3408968340 | |
| Address | Liandong U Grain Networking Industrial Park,No.12 Xingye West Road, Fuzhou, Fujian, China |
| Website | www.fjinno.net |
Response Time Commitment: Technical inquiries receive response within 24 business hours. Quotation requests processed within 48 hours.
📞 Request Your Custom Quote Today – Expert Guidance for Optimal Monitoring Solutions
14. Disclaimer
Important Notice
Information Accuracy: This article provides general technical information about transformer partial discharge online monitoring systems based on industry standards and manufacturer specifications current as of January 2026. Technical details, product specifications, and pricing are subject to change without notice. Always verify current specifications with manufacturers before making procurement decisions.
Application Responsibility: Implementation of monitoring systems requires qualified electrical engineers and technicians familiar with high-voltage equipment safety procedures. The author and publisher assume no liability for equipment damage, personal injury, or other consequences resulting from application of information contained herein. Consult with licensed professional engineers for site-specific design and installation.
Product Specifications: Performance specifications cited represent typical values for commercial monitoring systems. Actual performance varies based on installation conditions, interference levels, transformer construction, and other site-specific factors. Conduct acceptance testing to verify installed system performance meets application requirements.
Third-Party Certifications: References to certifications, standards compliance, and test reports indicate general industry practices. Verify that specific products under consideration hold appropriate certifications from recognized testing laboratories. Request copies of actual test certificates rather than relying on claimed compliance.
Service Limitations: While monitoring systems provide valuable condition assessment tools, they cannot guarantee prevention of all transformer failures. Some failure modes develop too rapidly for advance detection, and monitoring effectiveness depends on proper installation, calibration, and interpretation. Maintain comprehensive maintenance programs including periodic offline testing, oil analysis, and visual inspections.
Warranty and Liability: Equipment warranties and liability limitations are governed by individual purchase agreements with manufacturers or authorized distributors. This article does not constitute a warranty or guarantee of product performance. Review warranty terms carefully and consider extended coverage for critical applications.
Professional Consultation: This information serves educational purposes and does not replace professional engineering consultation. Complex installations, custom applications, or critical infrastructure projects require detailed engineering studies by qualified specialists. Engage experienced consultants for comprehensive monitoring system design and integration planning.

Fiber optic temperature sensor, Intelligent monitoring system, Distributed fiber optic manufacturer in China
 |
 |
 |