 INNO fibre optic temperature sensors ,temperature monitoring systems.
- GIS (Gas Insulated Switchgear) uses SF6 gas insulation, reducing footprint by 80% compared to conventional equipment
- Ideal for urban substations, offshore platforms, underground distribution where space is limited
- Main advantages include high reliability, maintenance-free operation, environmental adaptability, and 40-year service life
- Common failures include SF6 gas leakage, partial discharge, contact overheating, and mechanical jamming
- Temperature monitoring is critical for safe GIS operation; fluorescent fiber optic sensors outperform traditional PT100 solutions
- 24/7 online monitoring of SF6 gas density, temperature, and partial discharge parameters is essential
Table of Contents
- What is Gas Insulated Switchgear Equipment
- How Does Gas Insulated Switchgear Work
- Functions of GIS Equipment
- Gas Insulated Switchgear Application Range
- How to Maintain GIS Systems
- Gas Insulated Switchgear vs Air Insulated Switchgear
- Common GIS Failures and Issues
- GIS Temperature Rise Solutions
- GIS Monitoring Equipment Components
- GIS Temperature Monitoring Solutions
- Temperature Sensor Comparison: Why Fluorescent Fiber Optic Sensors
- Substation Equipment Overview
- Fiber Optic Temperature Monitoring for Equipment Hotspot Detection
- Frequently Asked Questions
1. What is Gas Insulated Switchgear Equipment

Gas Insulated Switchgear (GIS) is a compact, high-voltage electrical substation that uses SF6 gas as the insulating medium instead of air. The equipment integrates all electrical components—including circuit breakers, disconnect switches, grounding switches, current transformers, and busbars—within sealed metal enclosures filled with pressurized insulating gas.
The basic structure consists of three primary elements: metal-clad compartments, SF6 insulating gas, and electrical switching components. GIS systems operate across voltage levels ranging from 12kV to 1200kV, making them suitable for both medium-voltage distribution networks and extra-high-voltage transmission systems.
The fundamental difference between GIS equipment and conventional Air Insulated Switchgear (AIS) lies in the insulation medium. While AIS uses atmospheric air and requires significant clearance distances, GIS leverages the superior dielectric strength of SF6 gas—approximately 2-3 times that of air at atmospheric pressure—enabling dramatically reduced equipment dimensions.
Since its commercial introduction in the 1960s, gas insulated switchgear technology has evolved from simple single-phase designs to sophisticated three-phase integrated systems with advanced monitoring capabilities. Modern GIS installations incorporate digital protection relays, online condition monitoring systems, and communication protocols compatible with smart grid infrastructure.
2. How Does Gas Insulated Switchgear Work
The operational principle of gas insulated switchgear relies on the exceptional insulating and arc-quenching properties of SF6 gas. When contained within sealed metal enclosures at pressures ranging from 0.4 to 0.6 MPa (absolute), SF6 provides robust electrical insulation between energized conductors and grounded enclosures.
SF6 Gas Insulation Mechanism
SF6 molecules possess strong electronegativity, rapidly absorbing free electrons that would otherwise initiate electrical breakdown. This characteristic gives SF6 its insulation strength of 2-3 times that of air, allowing for compact equipment design while maintaining necessary dielectric clearances.
Circuit Breaking Process
When a circuit breaker within the GIS operates to interrupt fault current, an electric arc forms between separating contacts. The pressurized SF6 gas flow through the arc region rapidly cools and deionizes the plasma, extinguishing the arc typically within 1-2 cycles (16-33 milliseconds at 50/60Hz).
Complete Operation Sequence
From closing to opening operation, the GIS system follows this sequence: The operating mechanism receives a command signal, stored mechanical or spring energy drives the moving contacts, current begins flowing through closed contacts, and upon a trip command, contacts separate rapidly while SF6 gas quenches the resulting arc. Disconnect switches then provide visible isolation, and grounding switches safely discharge residual energy.
3. Functions of GIS Equipment
Gas insulated switchgear serves multiple critical functions in electrical power systems, extending beyond simple circuit switching to comprehensive system protection and control.
Primary Control Functions
The GIS equipment enables operators to connect and disconnect electrical circuits under both normal load conditions and fault scenarios. Circuit breakers within the system can interrupt fault currents exceeding 63kA, protecting downstream equipment and maintaining system stability.
Protection Capabilities
Integrated protection relays monitor electrical parameters continuously, triggering rapid circuit interruption upon detecting overcurrent, short circuit, ground fault, or other abnormal conditions. Typical clearing times range from 30-80 milliseconds, minimizing equipment damage and system disruption.
Measurement and Monitoring
Current transformers (CTs) and voltage transformers (VTs) embedded within the GIS provide accurate measurements for metering, protection, and control systems. These instrument transformers operate with accuracy classes from 0.2 to 5P, depending on application requirements.
Safe Isolation
Disconnect switches create visible separation points for maintenance activities, while grounding switches ensure worker safety by discharging residual voltages and providing a grounded reference during servicing.
4. Gas Insulated Switchgear Application Range
GIS technology finds extensive application across diverse electrical infrastructure scenarios where space constraints, environmental challenges, or reliability requirements make conventional equipment impractical.
| Application Sector | Typical Voltage Level | Key Advantages | Common Configurations |
|---|---|---|---|
| Urban Substations | 72.5kV – 550kV | Minimal footprint, aesthetic appeal | Indoor, underground installations |
| Offshore Platforms | 12kV – 145kV | Corrosion resistance, compact design | Marine-grade enclosures |
| Industrial Facilities | 12kV – 36kV | High reliability, low maintenance | Manufacturing plants, refineries |
| Data Centers | 12kV – 36kV | Uninterrupted operation, fast switching | Redundant configurations |
| Renewable Energy | 36kV – 145kV | Environmental adaptability | Wind farms, solar plants |
| Underground Networks | 72.5kV – 145kV | Space efficiency, environmental protection | Below-grade vaults |
| High-Altitude Regions | 72.5kV – 550kV | Altitude-independent insulation | Mountain substations |
| Transportation Hubs | 12kV – 36kV | Safety, reliability | Airports, railway stations |
Urban Distribution Networks
Metropolitan areas increasingly adopt gas insulated switchgear to maximize land utilization. A typical 110kV GIS substation occupies only 15-20% of the space required for equivalent AIS equipment, making it ideal for high-property-value locations.
Harsh Environmental Conditions
Coastal regions with severe salt spray, desert areas with sand storms, and tropical zones with high humidity benefit from the sealed, climate-controlled environment within GIS enclosures. The equipment maintains rated performance across temperature ranges from -40°C to +50°C ambient.
Critical Infrastructure
Hospitals, financial centers, and government facilities requiring 99.99%+ availability utilize GIS systems with redundant configurations and rapid automatic transfer schemes to ensure continuous power supply.
5. How to Maintain GIS Systems
Proper maintenance of gas insulated switchgear ensures long-term reliability and optimal performance. Unlike air insulated equipment, GIS requires minimal routine intervention but demands rigorous adherence to manufacturer-specified procedures.
Daily and Weekly Inspections
Operations personnel should monitor SF6 gas density indicators daily, checking for pressure drops that might indicate leakage. Visual inspection of gas density relays, pressure gauges, and alarm indicators takes only 5-10 minutes per GIS bay. Any unusual sounds, odors, or local heating require immediate investigation.
Annual Preventive Maintenance
Yearly inspections include:
- SF6 gas quality testing – Analysis for moisture content, decomposition byproducts, and air contamination
- Partial discharge measurement – UHF or acoustic detection to identify developing insulation defects
- Mechanical operation testing – Verification of circuit breaker timing, travel characteristics, and operating energy
- Contact resistance measurement – Assessment of circuit breaker and disconnect switch contact condition
- Protection relay functional testing – Validation of tripping circuits and alarm systems
SF6 Gas Management
SF6 gas handling requires certified equipment and trained personnel. Gas recovery during maintenance must capture 99%+ of the gas to minimize environmental impact and comply with regulations. Moisture content should remain below 150 ppm by volume to prevent insulation degradation.
Major Overhaul (10-15 Year Intervals)
Comprehensive overhauls involve complete disassembly, contact replacement, spring mechanism refurbishment, seal renewal, and full electrical testing. This intensive maintenance extends equipment life to 40+ years of reliable service.
Maintenance Record Keeping
Digital asset management systems should track operation counts, maintenance activities, test results, and gas handling records. This data enables predictive maintenance strategies and regulatory compliance documentation.
6. Gas Insulated Switchgear vs Air Insulated Switchgear
The choice between gas insulated switchgear (GIS) and air insulated switchgear (AIS) involves careful evaluation of technical requirements, site constraints, and lifecycle economics.
| Comparison Factor | Gas Insulated Switchgear (GIS) | Air Insulated Switchgear (AIS) |
|---|---|---|
| Insulation Medium | SF6 gas at 0.4-0.6 MPa | Atmospheric air |
| Space Requirements | 10-20 m² per bay (145kV) | 80-120 m² per bay (145kV) |
| Installation Type | Indoor/outdoor/underground | Primarily outdoor |
| Environmental Sensitivity | Immune to pollution, humidity, altitude | Affected by contamination, weather, altitude |
| Reliability (MTBF) | 400+ years per bay | 200-300 years per bay |
| Maintenance Frequency | Annual inspections, 10-15 year overhaul | Quarterly inspections, 5-8 year maintenance |
| Initial Investment | 130-150% of AIS cost | Baseline (100%) |
| Operating Costs | Very low, minimal maintenance | Higher, regular maintenance required |
| Service Life | 40-50 years | 30-40 years |
| Expansion Flexibility | Limited, requires factory coordination | Easier field modifications |
| Fault Restoration Time | Longer (requires manufacturer support) | Shorter (field-repairable) |
| Environmental Impact | SF6 greenhouse gas concerns | Land use, visual impact |
| Safety During Operation | Excellent (sealed, grounded enclosures) | Good (requires safety clearances) |
| Seismic Performance | Superior (compact, rigid structure) | Good (requires bracing) |
Technical Performance Differences
The superior dielectric strength of SF6 gas enables phase-to-phase and phase-to-ground clearances of just 150-300mm in GIS versus 1500-3500mm required in AIS at the same voltage level. This fundamental difference drives the dramatic space savings.
Economic Considerations
While GIS equipment costs 30-50% more initially, total lifecycle costs often favor GIS in urban environments where land costs exceed $1000/m². A 145kV GIS substation might cost $2.5M versus $1.8M for AIS, but saves $500K+ in land acquisition costs.
Application-Specific Selection
Choose GIS when: space is severely limited, environmental conditions are harsh, high reliability is critical, or underground/indoor installation is required. Select AIS when: budget is constrained, future expansion is uncertain, site area is abundant, or local maintenance expertise with GIS is unavailable.
7. Common GIS Failures and Issues
Although gas insulated switchgear demonstrates exceptional reliability with failure rates below 0.01% annually, understanding typical failure modes enables proactive monitoring and rapid response.
SF6 Gas Leakage (30% of Failures)
SF6 gas leakage represents the most frequent GIS issue. Common leak paths include aging elastomer seals at flange joints, microscopic cracks in welded seams, and gasket degradation at instrument transformer interfaces. Modern SF6 monitoring systems detect pressure drops as small as 2-3% annually, triggering maintenance before insulation strength deteriorates.
Partial Discharge Activity (25% of Failures)
Partial discharge within GIS typically originates from:
- Metallic particles contaminating the gas space during manufacturing or maintenance
- Surface contamination on post insulators from moisture or decomposition products
- Defective cast resin components with internal voids
- Poor electrical connections creating localized field enhancement
UHF partial discharge monitoring detects incipient failures months before catastrophic breakdown occurs.
Contact Overheating (20% of Failures)
Excessive contact resistance in circuit breakers or disconnect switches causes localized heating. Contributing factors include inadequate contact pressure from weakened springs, surface oxidation reducing effective contact area, and mechanical misalignment preventing proper engagement. Temperature monitoring systems provide early warning when contact temperatures exceed 80°C.
Typical Temperature Progression
| Condition | Contact Temperature | Action Required |
|---|---|---|
| Normal Operation | 40-60°C | Continue monitoring |
| Elevated Temperature | 70-85°C | Increase monitoring frequency |
| Warning Level | 85-100°C | Schedule maintenance within 30 days |
| Critical Level | >100°C | Reduce load or take out of service |
Mechanical Malfunctions (15% of Failures)
Operating mechanisms may experience binding, excessive friction, or component failure. Inadequate lubrication, corrosion of pivot points, and spring mechanism degradation compromise reliable switching. Operation counters tracking mechanical cycles enable scheduled replacement before failure.
Insulation Breakdown (5% of Failures)
Catastrophic dielectric failure occurs when SF6 gas pressure drops below minimum threshold, moisture contamination exceeds 300 ppm, or defective insulating components experience flashover. Proper gas management and regular insulation testing prevent most breakdown events.
Secondary System Failures (5% of Failures)
Control circuits, auxiliary switches, and interlocking systems occasionally malfunction, preventing proper GIS operation even when primary equipment remains functional. Systematic testing during annual maintenance identifies deteriorating components.
8. GIS Temperature Rise Solutions
Abnormal temperature rise in gas insulated switchgear demands immediate attention to prevent equipment damage and service interruption. Effective thermal management combines monitoring, diagnosis, and corrective action.
Root Cause Analysis
When GIS temperature monitoring indicates elevated readings, investigate these common causes:
Electrical Factors
- Contact deterioration – Increased resistance at circuit breaker or disconnect switch contacts generates I²R heating
- Overloading – Current exceeding rated capacity by 10-20% produces proportional temperature increase
- Harmonic currents – Non-linear loads inject frequencies that increase effective resistance and heating
- Unbalanced loading – Phase current imbalance concentrates thermal stress
Environmental Factors
- Ambient temperature – High room temperature (>40°C) reduces thermal margin
- Inadequate ventilation – Blocked air circulation prevents heat dissipation
- Solar radiation – Direct sunlight on outdoor GIS enclosures adds thermal load
Equipment Condition
- Low SF6 pressure – Reduced gas density impairs heat transfer from conductors to enclosure
- Contaminated contacts – Surface films increase contact resistance
- Mechanical misalignment – Poor contact engagement reduces effective contact area
Immediate Corrective Actions
Upon detecting excessive temperature (>85°C):
- Load reduction – Transfer load to parallel circuits if available, reducing current to 70-80% of rated capacity
- Cooling enhancement – Improve air circulation with temporary fans, reduce ambient temperature with HVAC adjustments
- Operational scheduling – Shift heavy loads to cooler periods if possible
- Emergency planning – Prepare for forced outage if temperature continues rising despite interventions
Long-Term Solutions
Scheduled maintenance addressing the underlying cause:
- Contact maintenance – Clean, re-surface, or replace deteriorated contacts; verify contact pressure meets specifications (typically 500-800N for medium-voltage contacts)
- Gas system service – Replenish SF6 to rated pressure, remove moisture and contaminants
- Ventilation improvements – Install enhanced cooling systems for consistently high-load applications
- Uprating evaluation – Consider equipment upgrade if load growth exceeds original design assumptions
Temperature Monitoring Best Practices
Continuous temperature monitoring provides early warning before thermal issues escalate. Set alarm thresholds at 80°C (pre-warning) and 95°C (urgent action required). Trending analysis reveals gradual degradation, enabling planned maintenance rather than emergency response.
9. GIS Monitoring Equipment Components
Modern gas insulated switchgear installations incorporate comprehensive monitoring systems that continuously assess equipment health and operating conditions. These systems transform GIS from passive infrastructure to intelligent, self-diagnosing assets.
SF6 Gas Density Monitoring
Gas density monitors serve as the primary protection against insulation failure. Key components include:
- Density relays – Mechanical or electronic devices with temperature compensation, providing alarm and lockout contacts at preset density thresholds (typically 90% alarm, 80% lockout)
- Pressure transducers – 4-20mA analog outputs enabling SCADA integration and trending analysis
- Temperature sensors – PT100 RTDs or thermocouples providing gas temperature data for accurate density calculation
Partial Discharge Detection Systems
Online partial discharge monitoring identifies developing insulation defects years before failure:
UHF (Ultra-High Frequency) Sensors
Capacitive sensors mounted on dielectric windows detect electromagnetic radiation (300MHz-3GHz) emitted by partial discharges. Signal processing algorithms distinguish PD from external interference.
Acoustic Sensors
Piezoelectric transducers attached to GIS enclosures detect ultrasonic emissions (20-300kHz) from discharge activity. Time-domain analysis localizes PD sources to within ±0.5m.
TEV (Transient Earth Voltage) Monitoring
Sensors at enclosure joints measure voltage transients induced by internal PD, providing complementary detection to UHF methods.
Temperature Monitoring Systems
Critical components requiring temperature monitoring include:
- Circuit breaker contacts – Both fixed and moving contacts on each phase
- Disconnect switch blades – Contact points subject to mechanical wear
- Busbar joints – Bolted connections between GIS sections
- Cable terminations – Interface points between GIS and external cables
- Current transformer windings – Secondary windings vulnerable to overheating
Fluorescent fiber optic sensors provide reliable temperature data in the high-voltage, high electromagnetic field environment inside GIS enclosures.
Mechanical Condition Monitoring
Circuit breaker monitoring tracks operational parameters:
- Travel sensors – Linear potentiometers or rotary encoders measuring contact displacement versus time
- Velocity transducers – Verification that opening/closing speeds meet specifications (typically 3-7 m/s)
- Operation counters – Accumulated mechanical operations approaching maintenance intervals
- Motor current monitors – Spring charging motor current indicating mechanical binding or motor degradation
Integrated Monitoring Platforms
Modern GIS monitoring systems consolidate data from multiple sensors into unified platforms providing:
- Real-time dashboards with graphical status displays
- Historical trending and analysis tools
- Automated alarm management and notification
- Predictive analytics using machine learning algorithms
- Integration with substation automation via IEC 61850 protocol
- Mobile access for remote monitoring and diagnostics
10. GIS Temperature Monitoring Solutions
Effective temperature monitoring for gas insulated switchgear requires strategic sensor placement, appropriate technology selection, and intelligent data management to detect developing problems before they cause failures.
Monitoring Point Selection
Optimal sensor placement targets locations most susceptible to thermal stress:
Primary Monitoring Points
| Component | Monitoring Location | Typical Temperature Range | Alarm Threshold |
|---|---|---|---|
| Circuit Breaker | Fixed and moving contacts (6 points for 3-phase) | 50-70°C normal | 85°C warning, 100°C trip |
| Disconnect Switch | Blade contact points (3 points per phase) | 45-65°C normal | 80°C warning, 95°C trip |
| Busbar Connections | Bolted joints between sections | 40-60°C normal | 75°C warning, 90°C trip |
| Cable Terminations | GIS-to-cable interface | 45-65°C normal | 80°C warning, 95°C trip |
| Current Transformers | Secondary winding | 50-70°C normal | 90°C warning, 105°C trip |
System Architecture
A complete GIS temperature monitoring system comprises four functional layers:
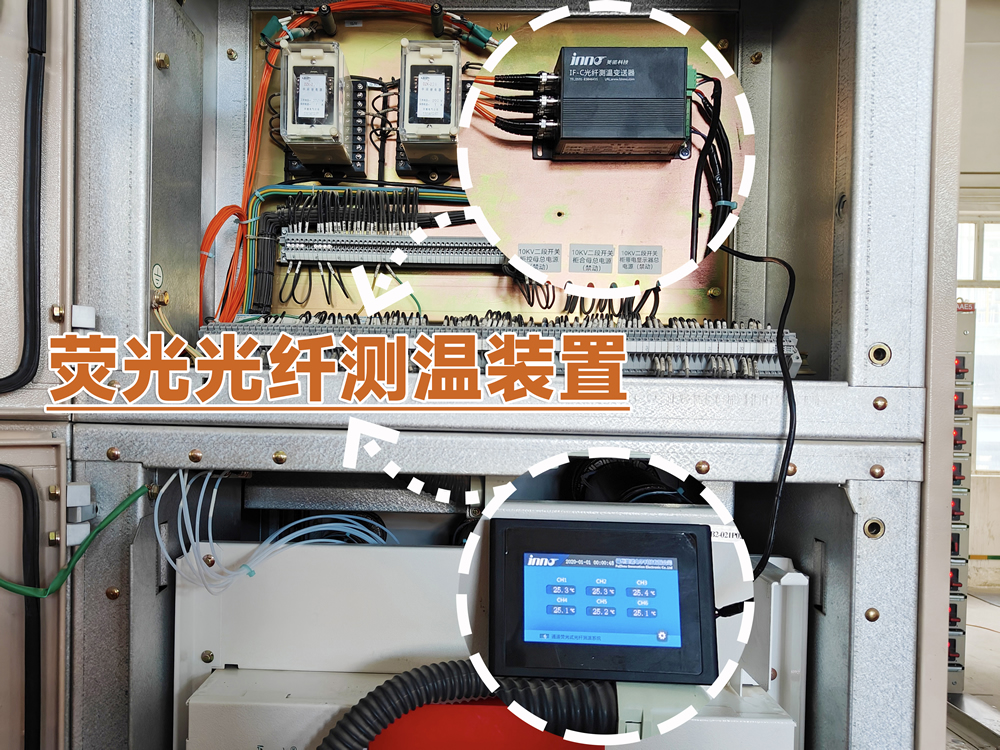
Sensor Layer
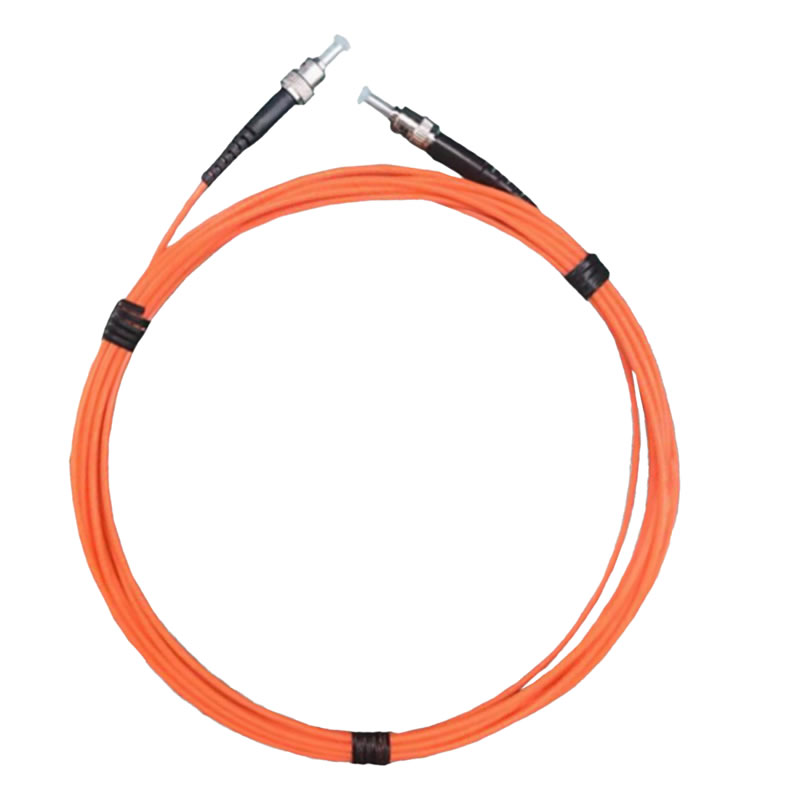
Fluorescent fiber optic temperature sensors installed at each monitoring point, connected via fiber optic cables to transmitter modules. Each sensor provides a dedicated measurement channel for one specific hotspot.
Data Acquisition Layer
Fiber optic temperature transmitters support 1-64 sensor channels, converting optical signals to digital temperature values. Transmitters provide local display, alarm outputs, and communication interfaces.
Communication Layer
Modbus RTU/TCP or IEC 61850 protocols transmit temperature data to substation automation systems, SCADA networks, and cloud-based analytics platforms. Typical update rates: 1-second for critical points, 10-second for routine monitoring.
Management Layer
Centralized monitoring software provides real-time visualization, historical trending, alarm management, and predictive maintenance scheduling based on thermal performance analysis.
Alarm Strategy Configuration
Multi-level temperature alarms enable graduated response:
- Pre-warning (75-80°C) – Logged notification, increased monitoring frequency, schedule investigation during next available maintenance window
- Warning (85-95°C) – Operator alarm, visual/audible annunciation, prepare for load reduction or equipment substitution
- Critical (>100°C) – Urgent alarm, automatic load shedding if configured, immediate maintenance action required
- Temperature rise rate – Alarm when temperature increases >10°C/hour regardless of absolute value, indicating rapid degradation
Data Analytics and Trending
Temperature trend analysis reveals degradation patterns:
- Gradual temperature increase over months indicates progressive contact deterioration requiring scheduled maintenance
- Seasonal temperature correlation with ambient conditions confirms adequate thermal margin
- Load-temperature correlation validates equipment rating and identifies overload conditions
- Comparative analysis across phases identifies unbalanced loading or single-phase defects
Integration with Asset Management
Temperature monitoring data feeds into comprehensive asset management systems, enabling:
- Remaining useful life estimation based on thermal stress accumulation
- Optimized maintenance scheduling aligned with actual equipment condition
- Spare parts inventory management based on failure probability
- Long-term investment planning supported by equipment health metrics
11. Temperature Sensor Comparison: Why Fluorescent Fiber Optic Sensors
Selecting appropriate temperature sensing technology for gas insulated switchgear monitoring critically impacts system reliability, accuracy, and long-term performance. Three primary technologies compete in this application: fluorescent fiber optic sensors, PT100 resistance temperature detectors, and infrared thermography.
Technology Principles
Fluorescent Fiber Optic Temperature Sensors
Fluorescent fiber optic sensors utilize temperature-dependent phosphorescent decay. A probe tip contains rare-earth phosphor material that fluoresces when excited by LED light transmitted through the optical fiber. The fluorescent decay time varies predictably with temperature, providing accurate measurement independent of light intensity variations. These sensors offer contact-type measurement with one fiber optic cable measuring one specific hotspot location.
PT100 Resistance Temperature Detectors
PT100 sensors exploit the positive temperature coefficient of platinum resistance (0.385Ω/°C). A platinum element with 100Ω resistance at 0°C changes resistance proportionally with temperature. Electronic transmitters convert resistance to temperature via standardized curves (IEC 60751).
Infrared Thermal Imaging
Infrared cameras detect electromagnetic radiation in the 8-14μm wavelength range emitted by objects according to Stefan-Boltzmann law. Surface temperature is calculated from radiation intensity and emissivity coefficient.
Comprehensive Performance Comparison
| Performance Parameter | Fluorescent Fiber Optic Sensor | PT100 RTD | Infrared Thermography |
|---|---|---|---|
| Measurement Principle | Phosphorescent decay time | Resistance variation | Thermal radiation detection |
| EMI Immunity | Complete immunity (non-metallic) | Susceptible to EMI/RFI | Not affected (non-contact) |
| Electrical Isolation | Inherently isolated (dielectric) | Requires isolation barriers | Completely isolated |
| Measurement Accuracy | ±1°C | ±0.3°C (Class A) | ±2-5°C (depends on emissivity) |
| Temperature Range | -40°C to +260°C | -200°C to +850°C | -20°C to +1500°C |
| Response Time | <1 second | 5-30 seconds (depends on construction) | <1 second |
| Fiber/Cable Length | 0-80 meters per sensor | Limited to 100m without amplification | N/A (line-of-sight required) |
| Probe Diameter | Customizable (typically 1-3mm) | 3-6mm typical | N/A |
| Installation Complexity | Simple (adhesive or mechanical attachment) | Moderate (wiring, grounding required) | Requires access windows/periodic surveys |
| High Voltage Environment | Excellent (no conductive path) | Requires special grounding/shielding | Excellent (remote measurement) |
| Long-Term Stability | Excellent (no drift, >20 years) | Good (±0.1°C drift over 5 years) | Depends on equipment calibration |
| Maintenance Requirements | Minimal (no calibration needed) | Periodic calibration verification | Camera calibration, window cleaning |
| Multi-Point Capability | 1 hotspot per fiber, 1-64 channels per transmitter | One sensor per measurement point | Full thermal imaging of viewed area |
| Continuous Monitoring | Yes (24/7 real-time) | Yes (24/7 real-time) | No (periodic surveys unless fixed installation) |
| Initial Equipment Cost | Moderate | Low | High |
| Installation Cost | Low (simple mounting) | Moderate (wiring labor) | Low (survey-based) to High (fixed installation) |
| Operating Cost | Very low | Low to moderate | Moderate (periodic surveys) to Low (automated) |
Why Fluorescent Fiber Optic Sensors Excel for GIS
Fluorescent fiber optic temperature sensors uniquely address the challenging requirements of gas insulated switchgear monitoring:
Intrinsic Safety in High-Voltage Environments
The complete absence of metallic components eliminates any possibility of creating ground loops, induced voltages, or electrical discharge paths. Sensors can be installed directly on high-voltage conductors without compromising electrical isolation—impossible with PT100 sensors that require complex grounding schemes and isolation amplifiers.
EMI/RFI Immunity
GIS environments contain intense electromagnetic fields during switching operations and fault conditions. Fiber optic sensors transmit data as optical signals completely immune to electromagnetic interference, ensuring accurate measurements even during transient events that would saturate electronic sensors.
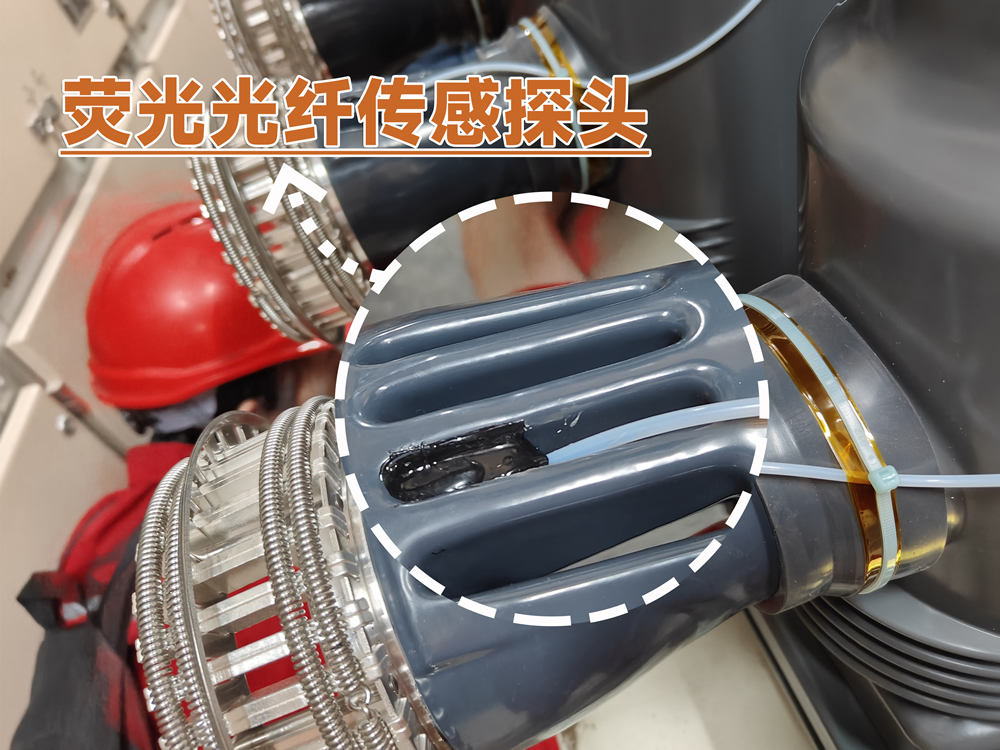
Compact Installation in Space-Constrained Locations
The small probe diameter (customizable from 1-3mm) and flexible fiber optic cable enable installation in tight spaces between high-voltage components where conventional sensors cannot fit. Adhesive mounting or mechanical clips provide secure attachment without drilling or invasive procedures.
Extended Transmission Distance
Fiber optic cables transmit signals up to 80 meters without signal degradation or need for active amplification. This capability allows centralized transmitter installation in safe, accessible locations while monitoring remote points deep within GIS assemblies.
Multi-Channel Scalability
A single fiber optic temperature transmitter accommodates 1-64 independent sensor channels, enabling comprehensive monitoring of an entire GIS bay with one compact device. Each channel provides dedicated measurement of one specific hotspot location with no cross-talk or interference.
Minimal Maintenance Requirements
The optical measurement principle exhibits exceptional long-term stability with no drift, eliminating periodic calibration requirements. Expected sensor lifespan exceeds 20 years with zero maintenance—a critical advantage for sealed GIS equipment where access for sensor replacement is expensive and disruptive.
Application-Specific Sensor Selection
While fluorescent fiber optic sensors provide optimal performance for continuous GIS monitoring, complementary technologies serve specific purposes:
- Use PT100 sensors for non-critical temperature monitoring in low-voltage auxiliary equipment where EMI is minimal and lower cost is prioritized
- Deploy infrared thermography for periodic diagnostic surveys of accessible GIS components, providing visual thermal maps that identify unexpected hot spots
- Implement fiber optic sensors for all critical high-voltage components requiring 24/7 monitoring with guaranteed reliability
Beyond Power Systems: Versatile Applications
Fluorescent fiber optic temperature sensors demonstrate exceptional versatility across diverse industries:
- Medical applications – MRI-compatible temperature monitoring, RF ablation procedures, patient monitoring in high-field magnetic environments
- Laboratory research – Cryogenic temperature measurement, chemical reactor monitoring, microwave heating processes
- Industrial processes – Induction heating systems, metal treatment furnaces, explosive atmosphere monitoring
- Transportation – Generator and traction motor monitoring in electric locomotives, battery thermal management in electric vehicles
The customizable specifications—including temperature range (-40°C to +260°C), probe diameter, cable length, and channel configuration—enable tailored solutions for virtually any temperature monitoring challenge.
12. Substation Equipment Overview
Electrical substations contain diverse equipment working in concert to transform voltage levels, distribute power, and protect the network. Understanding the complete equipment complement provides context for temperature monitoring requirements.
Primary Equipment
Power Transformers
Power transformers step voltage up or down according to transmission or distribution requirements. Units range from 1MVA distribution transformers to 500MVA+ transmission transformers. Critical monitoring points include winding hotspots, oil temperature, and bushing connections.
Gas Insulated Switchgear (GIS)
As discussed extensively in this guide, GIS equipment provides compact switching and protection in sealed SF6-insulated enclosures. Temperature monitoring focuses on circuit breaker contacts, disconnect switches, and busbar joints.
Circuit Breakers
Circuit breakers—whether air, oil, vacuum, or SF6 type—interrupt fault currents and normal load currents. Contact temperature monitoring prevents failures from contact erosion or spring degradation.
Disconnect Switches and Grounding Switches
Disconnect switches provide visible isolation for maintenance, while grounding switches ensure worker safety. Both contain mechanical contacts requiring thermal monitoring.
Surge Arresters
Surge arresters protect equipment from lightning and switching overvoltages. While typically requiring no temperature monitoring, internal degradation sometimes manifests as thermal signatures detectable by infrared surveys.
Instrument Transformers
Current Transformers (CTs)
Current transformers scale primary current to standard 1A or 5A secondary values for metering and protection. Secondary winding overheating from excessive burden or turn-to-turn faults requires monitoring in critical applications.
Voltage Transformers (VTs/PTs)
Voltage transformers provide scaled voltage signals for instrumentation. Thermal issues are rare but can occur with capacitor voltage transformers (CVTs) at harmonic frequencies.
Reactive Power Compensation
Capacitor Banks
Capacitor banks provide reactive power support and voltage regulation. Individual capacitor units can overheat from internal element failure or harmonic resonance, making thermal monitoring valuable for large installations.
Shunt Reactors
Reactors absorb reactive power on lightly loaded transmission lines. Oil-filled reactor winding temperature requires monitoring similar to power transformers.
Secondary and Control Equipment
Protection Relays
Microprocessor-based protection relays detect faults and initiate breaker tripping. Modern relays incorporate self-diagnostics but may benefit from ambient temperature monitoring in harsh environments.
Control and Automation Systems
Substation automation systems aggregate data from intelligent electronic devices (IEDs), providing centralized monitoring and control. These systems integrate temperature monitoring data alongside electrical measurements.
DC Systems
Station batteries and battery chargers provide reliable DC power for protection and control circuits. Battery temperature monitoring optimizes charging and extends service life.
Auxiliary Systems
Power Cables and Connections
Power cable terminations and joints represent common failure points. Temperature monitoring detects developing insulation degradation or connection resistance issues before catastrophic failure.
Busbars
Busbar systems distribute power within the substation. Bolted joints require periodic thermal inspection as contact resistance increases with mechanical loosening or corrosion.
HVAC and Cooling Systems
Environmental control maintains acceptable operating temperatures for equipment and personnel, particularly in underground or indoor substations.
13. Fiber Optic Temperature Monitoring for Equipment Hotspot Detection
Fiber optic temperature monitoring systems excel at detecting thermal anomalies across diverse substation equipment, providing early warning of developing failures and enabling predictive maintenance strategies.
GIS Equipment Monitoring Points
Circuit Breaker Contacts
Circuit breaker fixed and moving contacts represent the most critical monitoring points in GIS. Contact erosion from repeated interruptions, inadequate contact pressure, or surface contamination increases electrical resistance and generates excessive heat. Fluorescent fiber optic sensors mounted directly on the contacts detect temperature rise from normal operating range (50-65°C) to warning levels (85-95°C) before permanent damage occurs.
Case Study: 145kV GIS Circuit Breaker Contact Failure Prevention
A utility monitoring 145kV GIS circuit breaker contacts with fiber optic sensors detected gradual temperature increase on Phase B from 58°C to 82°C over six months. Scheduled maintenance revealed contact spring relaxation reducing contact force by 30%. Replacing the spring mechanism prevented an anticipated failure that would have caused 12+ hours outage affecting 50,000 customers.
Disconnect Switch Blade Contacts
Disconnect switch contacts experience mechanical wear from repeated operations and environmental effects. Temperature monitoring typically uses 3 sensors per phase (6 contact points per switch) to detect asymmetric heating indicating misalignment or uneven contact.
Busbar Connection Points
Bolted connections between GIS sections or at cable terminations may loosen from thermal cycling or inadequate initial torque. Monitoring these joints detects resistance increase before it progresses to arcing or complete separation.
Cable Termination Interfaces
The transition from GIS to external power cables concentrates electrical and thermal stress. Temperature sensors at these interfaces identify insulation degradation, moisture ingress, or connection deterioration.
Power Transformer Monitoring Applications
Winding Hotspot Temperature
Power transformer winding hotspots determine loading capability and insulation life consumption. While traditional transformers estimate hotspot temperature from top oil temperature and load current, direct measurement with fiber optic sensors embedded during manufacturing provides accurate data for dynamic loading and remaining life assessment.
Core and Structural Components
Abnormal heating in transformer cores or structural components indicates circulating currents from insulation failure or grounding issues. Strategic sensor placement detects these anomalies during commissioning tests or in-service monitoring.
Bushing and Tap Changer Contacts
Transformer bushings and load tap changers contain mechanical contacts subject to similar degradation as GIS equipment. Temperature monitoring supplements traditional diagnostic methods like dissolved gas analysis.
Switchgear and Distribution Equipment
Medium Voltage Switchgear
Metal-clad switchgear for medium voltage (5-38kV) distribution contains circuit breakers, disconnects, and bus systems requiring thermal monitoring. Fiber optic sensors prevent service interruptions from overheated connections—particularly important in industrial facilities with continuous process operations.
Low Voltage Power Distribution
Low voltage switchboards and motor control centers distribute power to end-use equipment. High current densities in compact enclosures make these systems vulnerable to connection overheating. Fiber optic monitoring provides early warning in mission-critical applications.
Cable System Monitoring
Cable Joints and Terminations
Power cable accessories represent the weakest points in cable systems. Improper installation, moisture ingress, or insulation degradation causes localized heating detectable by contact-type fiber optic sensors before complete failure.
Case Study: Underground Cable Joint Failure Prevention
A 33kV underground cable system serving a hospital complex incorporated fiber optic temperature sensors at all cable joints (24 monitoring points). One sensor detected temperature rise from 52°C to 88°C over three weeks. Excavation and inspection revealed moisture penetration compromising joint insulation. Replacing the joint prevented an outage that would have impacted critical medical services.
Cable Tunnel and Tray Monitoring
For cables in accessible tunnels or trays, distributed temperature sensing (DTS) using fiber optic cables provides continuous temperature profiles. However, for specific hotspot monitoring at joints and terminations, discrete fluorescent fiber optic sensors offer superior accuracy with one sensor measuring one critical point.
Rotating Machinery Applications
Generator Stator Windings
Large generators in power plants utilize embedded fiber optic sensors to monitor stator winding temperature at multiple points, enabling optimized loading while preventing insulation damage from excessive temperature.
Motor Bearings and Windings
Critical motors driving pumps, compressors, or fans in power plants and industrial facilities benefit from bearing and winding temperature monitoring, preventing unexpected failures in essential services.
Monitoring System Architecture for Comprehensive Coverage
A complete substation fiber optic temperature monitoring system typically includes:
| Equipment Type | Monitoring Points per Unit | Typical Sensor Count (110kV Substation) |
|---|---|---|
| GIS Circuit Breaker | 6 (2 per phase) | 12-18 (2-3 breakers) |
| GIS Disconnect Switch | 6 (2 per phase) | 18-24 (3-4 switches) |
| Power Transformer | 3-6 (windings, bushings) | 6-12 (2 transformers) |
| Cable Terminations | 3 per termination | 12-18 (4-6 circuits) |
| Busbar Connections | Variable | 6-12 |
| Total System | – | 54-84 sensors |
This monitoring point count typically requires 2-3 fiber optic temperature transmitters (32-channel models), providing redundancy and logical grouping of related equipment.
Thermal Fault Detection Success Metrics
Utilities implementing comprehensive fiber optic temperature monitoring report significant reliability improvements:
- 70-85% of developing thermal faults detected 30+ days before critical failure
- Unplanned outages reduced by 40-60% through predictive maintenance
- Equipment service life extended 15-25% by avoiding thermal stress damage
- Maintenance costs optimized by transitioning from time-based to condition-based schedules
14. Frequently Asked Questions
Q1: How long does GIS equipment typically last?
A: Properly maintained gas insulated switchgear provides reliable service for 40-50 years. The sealed, controlled environment protects components from environmental degradation that limits outdoor equipment lifespan. Critical maintenance milestones include 10-15 year major inspections and 20-25 year contact system overhauls. Some GIS installations from the 1970s continue operating successfully today.
Q2: Is SF6 gas dangerous to human health?
A: SF6 gas itself is non-toxic and poses no direct health hazard. However, it is heavier than air and can cause asphyxiation in confined spaces by displacing oxygen. Decomposition products from electrical arcing (primarily sulfur compounds and metal fluorides) are toxic and corrosive, requiring proper ventilation and respiratory protection during maintenance. Modern GIS designs incorporate gas handling systems that minimize personnel exposure.
Q3: How often does GIS equipment require maintenance?
A: GIS maintenance schedules typically include: daily visual inspections of gas density indicators (5 minutes), quarterly detailed inspections including infrared thermography (2-4 hours), annual preventive maintenance with electrical testing (1-2 days per bay), and major overhauls every 10-15 years (1-2 weeks per bay). Actual maintenance frequency may vary based on manufacturer recommendations, operating conditions, and regulatory requirements.
Q4: Why is GIS more expensive than conventional switchgear?
A: GIS equipment costs 30-50% more than equivalent air insulated switchgear due to precision manufacturing requirements, SF6 gas filling and testing, sophisticated sealing systems, and specialized installation procedures. However, total project cost often favors GIS when including land acquisition (70-80% space savings), civil works (minimal foundations), installation labor (shorter schedules), and lifecycle costs (reduced maintenance). Urban locations with high land values typically show 10-20% lower total ownership cost for GIS despite higher equipment prices.
Q5: Can GIS be installed outdoors?
A: Yes, outdoor GIS installations are common and successful when using equipment with appropriate environmental protection ratings. Outdoor GIS requires weatherproof enclosures, heating systems for cold climates, solar radiation protection, and adequate ventilation. Many utilities prefer outdoor GIS to minimize building costs while achieving space savings compared to outdoor AIS. Special attention to cable entry sealing prevents moisture ingress into the gas system.
Q6: How do you know when GIS equipment needs replacement?
A: GIS replacement decisions depend on multiple factors: equipment age exceeding 40 years with increasing maintenance costs, obsolete designs lacking spare parts availability, repeated failures indicating systemic issues, inability to meet updated performance standards, or cost-benefit analysis favoring replacement over continued maintenance. Condition assessment through partial discharge testing, gas quality analysis, mechanical operation analysis, and thermal monitoring provides data for informed decisions. Many utilities plan systematic GIS replacement programs at 45-50 year intervals.
Q7: Can GIS faults be repaired on-site?
A: Most GIS faults require factory repair rather than field maintenance. The sealed gas system, precision tolerances, and specialized test equipment necessary for proper restoration generally exceed site capabilities. Exceptions include external component replacement (operating mechanisms, relays, control wiring) and minor gas system repairs (seal replacement on accessible joints). Utilities typically maintain spare GIS modules or sections for rapid replacement, sending failed units to manufacturer service centers for refurbishment.
Q8: Is fluorescent fiber optic temperature monitoring difficult to install?
A: Fluorescent fiber optic sensor installation is straightforward and minimally invasive. Sensors attach to monitoring points using high-temperature adhesive, mechanical clips, or magnetic mounts—typically requiring 5-10 minutes per point. Fiber optic cables route through cable trays to centralized transmitter locations. The dielectric nature of fiber eliminates grounding and isolation concerns that complicate PT100 installation in high-voltage equipment. Most installations complete within 1-2 days for a complete substation bay.
Q9: How does temperature monitoring integrate with existing SCADA systems?
A: Modern fiber optic temperature transmitters provide industry-standard communication protocols including Modbus RTU/TCP, DNP3, and IEC 61850. Integration typically involves configuring the transmitter IP address and register mapping, then adding monitoring points to the SCADA database. Most systems support both polling (SCADA requests data) and event-driven reporting (transmitter sends alarms immediately). Integration timelines range from a few hours for simple Modbus connections to 1-2 days for full IEC 61850 implementation with object modeling.
Q10: What is the typical investment for a GIS temperature monitoring system?
A: Complete GIS temperature monitoring systems cost approximately $500-1,200 per monitoring point, including sensors, transmitters, communication interfaces, and software. A typical 145kV GIS bay with 24 monitoring points requires an investment of $15,000-25,000. Larger installations benefit from economies of scale, with 50+ point systems averaging $600-800 per point. Return on investment typically occurs within 2-4 years through prevented failures, optimized maintenance, and avoided outages. The investment represents 1-3% of total GIS equipment cost while providing disproportionate value in risk reduction.
Q11: What temperature range can fluorescent fiber optic sensors measure?
A: Standard fluorescent fiber optic temperature sensors measure from -40°C to +260°C, covering all GIS operating conditions from arctic installations to maximum allowable contact temperatures. Specialized sensors extend this range to -200°C for cryogenic applications or +400°C for industrial processes. The -40°C to +260°C range provides adequate margin for GIS monitoring, where normal operating temperatures rarely exceed 70°C and alarm thresholds typically set at 85-100°C.
Q12: How many sensors can one fiber optic transmitter support?
A: Fiber optic temperature transmitters are available in configurations from 1 to 64 channels, with each channel connecting to one dedicated fluorescent sensor measuring one specific hotspot. Common configurations include 4, 8, 16, 32, and 64-channel models. Channel selection depends on monitoring requirements—a single GIS circuit breaker might use a 6-channel transmitter (2 sensors per phase), while a complete substation bay could require a 32 or 64-channel transmitter. Modular designs allow field expansion as monitoring needs grow.
Q13: Can the same fiber optic technology monitor other substation equipment?
A: Absolutely. Fluorescent fiber optic sensors provide versatile temperature monitoring across all substation equipment including power transformers, cable systems, reactors, capacitor banks, circuit breakers, disconnect switches, and busbar systems. The technology’s immunity to electromagnetic interference and electrical isolation make it ideal for high-voltage applications. Beyond power systems, these sensors monitor equipment in medical facilities (MRI machines), laboratories (research reactors), industrial plants (induction furnaces), and transportation systems (locomotive traction motors).
Q14: What happens if a fiber optic sensor fails?
A: Fiber optic sensor failures are rare due to the robust optical measurement principle and absence of electrical components. If a sensor fails, the transmitter detects the fault and generates an alarm indicating which channel is affected. The remaining sensors continue operating normally—unlike distributed systems where one fiber break can disable multiple measurement points. Sensor replacement involves disconnecting the failed fiber, installing a new sensor at the monitoring point, and connecting it to the same transmitter channel—typically completed in 15-30 minutes without affecting other measurements.
Q15: How does fiber optic temperature monitoring contribute to smart grid initiatives?
A: Temperature monitoring data integrates seamlessly into smart grid architectures via standard protocols (IEC 61850, Modbus, DNP3). Real-time thermal status enables dynamic asset rating—adjusting equipment loading based on actual temperature rather than conservative nameplate limits. Historical trending supports predictive analytics and machine learning algorithms that forecast failures days or weeks in advance. Integration with automated demand response systems allows thermal constraints to influence grid optimization decisions. The data contributes to digital twin models that simulate substation behavior under various operating scenarios, supporting optimal grid management.
Get Expert GIS Temperature Monitoring Solutions
Contact us today to discuss your specific gas insulated switchgear monitoring requirements and receive a customized solution proposal.

Fiber optic temperature sensor, Intelligent monitoring system, Distributed fiber optic manufacturer in China
 |
 |
 |