 INNO fibre optic temperature sensors ,temperature monitoring systems.
- Core idea: A partial discharge detector captures tiny insulation discharges long before breakdown, enabling early, data-driven maintenance.
- What it includes: UHF/TEV/acoustic/ultrasonic/optical sensors, high-speed data acquisition, noise rejection, pattern analytics, and alarm logic.
- Why it matters: Reduces unexpected outages, prevents asset damage, and extends insulation life in transformers, switchgear, GIS, cables, and bus ducts.
Table of Contents
- 1. What Is a Partial Discharge Detector
- 2. Why Partial Discharge Detection Matters
- 3. Principle of Partial Discharge Detection
- 4. Main Components of a PD Detector System
- 5. Types of PD Detectors (Offline, Online, Portable)
- 6. UHF and TEV Sensors in PD Detection
- 7. Acoustic and Ultrasonic PD Detection
- 8. Optical and Fiber-Based PD Detection
- 9. PD Measurement Parameters and Indicators
- 10. PD Pattern Recognition and Analysis
- 11. PD Detection in Transformers
- 12. PD Detection in Switchgear and GIS Systems
- 13. PD Detection in Cables and Bus Ducts
- 14. Data Acquisition and Communication Interfaces
- 15. Integration with SCADA and Condition Monitoring Systems
- 16. Calibration and Testing of PD Detectors
- 17. Advantages of Intelligent PD Monitoring Systems
- 18. Typical Applications and Case Examples
- 19. Frequently Asked Questions (Technical FAQ)
- 20. About Our Manufacturing and PD Detection Solutions
1. What Is a Partial Discharge Detector
A partial discharge (PD) detector is a measurement instrument and sensor suite designed to capture short-duration electrical activity that occurs within or across insulation when local electric fields exceed a critical threshold. Unlike full breakdowns, PD events are localized, low-energy, and often intermittent; however, their presence accelerates insulation aging and can lead to catastrophic faults if left unchecked. Modern detectors combine high-bandwidth front-ends, advanced filters, time-synchronized acquisition, and analytics to quantify PD magnitude, repetition rate, phase relationship to the power frequency, and spectral signatures.
Depending on the asset class, PD can occur in gaseous voids within solid dielectrics, on contaminated surfaces, at sharp metallic edges, inside cable terminations, or around bushings and spacers. A detector’s role is to reveal these early indicators so that maintenance teams can clean, dry, re-seal, or re-terminate affected parts before failure propagates.
1.1 Key Outcomes
- Early-warning: Detect insulation defects months in advance of failure.
- Actionable data: Provide magnitude, repetition, and phase-resolved patterns for diagnosis.
- Operational context: Correlate PD activity with load, ambient humidity, and switching operations.
1.2 Assets Covered
- Power transformers (winding leads, spacers, bushings, OLTC compartments)
- MV/LV metal-clad switchgear and GIS compartments
- HV/MV cables, joints, terminations, and bus ducts
2. Why Partial Discharge Detection Matters

Undetected PD is a leading precursor to insulation breakdown. The high electric stress at microscopic defects deteriorates dielectric materials via thermal, chemical, and mechanical processes. Systematic PD monitoring and diagnostics deliver four strategic benefits:
2.1 Reliability and Safety
- Reliability: Trending PD magnitude and count rate prevents unplanned outages.
- Safety: Lower probability of flashover and arc events that endanger personnel and equipment.
2.2 Maintenance Optimization
- Condition-based scheduling: Plan interventions based on evidence, not fixed calendars.
- Reduced intrusion: Online detection avoids unnecessary de-energization for routine checks.
2.3 Financial Performance
- Cost avoidance: Prevents major repairs and asset replacements by addressing root issues early.
- Asset life extension: Minimizes cumulative insulation damage through timely mitigation.
2.4 Compliance and Forensics
- Standards alignment: Supports acceptance testing and in-service audits.
- Root-cause evidence: Phase-resolved patterns and event histories support investigations and warranty claims.
3. Principle of Partial Discharge Detection
Partial discharge arises when the local electric field at a defect site exceeds the dielectric strength of the medium (solid, liquid, or gas), generating a micro-discharge path. These events inject high-frequency current and electromagnetic energy into the surrounding structure. Detection modalities capitalize on different physical effects:
3.1 Electrical and Electromagnetic Effects
- UHF emission: PD radiates broadband electromagnetic energy in the 300 MHz–3 GHz range; suitable for GIS, transformers, and metal-clad switchgear.
- TEV effect: Transient earth voltage manifests on metal enclosures as fast surface currents; widely used in MV switchgear.
- RF current pulses: Conducted impulses detectable with high-frequency current transformers (HFCTs) on grounding paths and cable screens.
3.2 Acoustic and Ultrasonic Effects
- Ultrasonic emission: Ionization produces acoustic waves detectable at 20–300 kHz using airborne or contact probes; helpful for localization and surface tracking detection.
3.3 Optical Effects
- Light emission: Discharge channels emit in UV/visible spectrum; optical sensors and cameras (with filters) capture corona and surface activity, especially in open-air components.
3.4 Phase-Resolved PD (PRPD)
By aligning PD pulses with the power frequency phase, detectors form two-dimensional maps (magnitude vs. phase) or three-dimensional histograms (magnitude, phase, pulse count). Defect classes—internal voids, surface tracking, corona—produce characteristic patterns, aiding classification and severity ranking.
4. Main Components of a PD Detector System
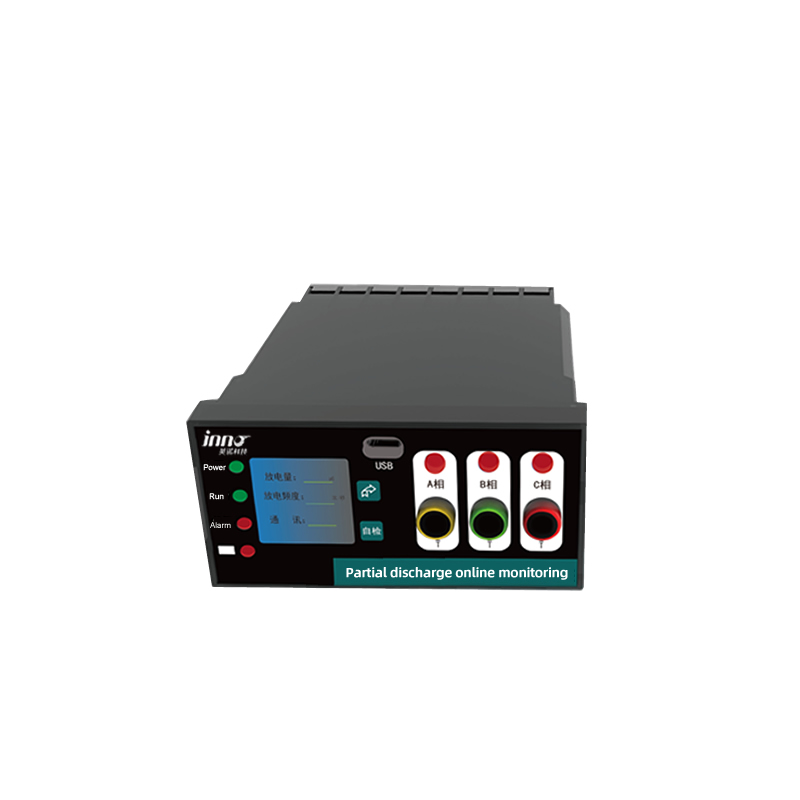
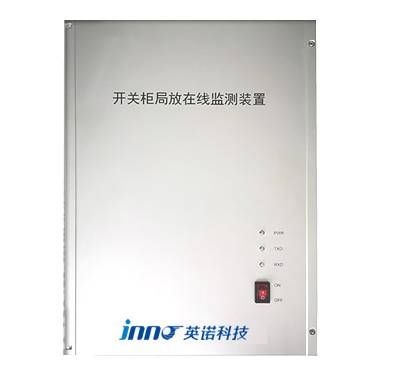
While form factors vary (portable, clamp-on, cabinet-integrated, substation-wide), PD detector systems share a common building-block architecture. The table summarizes core elements and their roles.
| Component | Function | Key Considerations |
|---|---|---|
| PD Sensors (UHF/TEV/HFCT/Ultrasonic/Optical) | Capture discharge signals via EM, conducted current, acoustic or light paths | Frequency response, sensitivity, mounting, environmental protection |
| Front-End Conditioning | Amplification, filtering, impedance matching | Noise floor, bandwidth, linearity, overload protection |
| High-Speed DAQ | Digitize pulses with accurate timing | Sampling rate, resolution, anti-aliasing, time sync (GPS/PTP) |
| Noise Rejection and Gating | Discriminate PD from interference and corona | Adaptive thresholds, coincidence logic, multi-sensor correlation |
| Analytics Engine | PRPD mapping, clustering, trend analysis | Defect classification, severity indexing, remaining-risk estimation |
| HMI/Software | Visualization, alarm configuration, reporting | Usability, export formats, historian, multi-asset dashboards |
| Communications | Integration with SCADA/CMMS/cloud | Protocols (IEC 61850, Modbus TCP, OPC UA, MQTT), cybersecurity |
4.1 Multi-Sensor Fusion
Combining modalities improves confidence. For example, UHF magnitude increases corroborated by HFCT pulses and a concurrent PRPD pattern shift strongly indicate internal PD growth versus external EMI. Ultrasonic probes aid localization by scanning along enclosures and joints.
4.2 Time Synchronization
Accurate timestamps enable phase-resolved analysis and multi-sensor triangulation. Substation deployments use GPS or IEEE 1588 PTP to align DAQs within microseconds, ensuring repeatable pattern recognition and cross-bay comparisons.
5. Types of PD Detectors (Offline, Online, Portable)

Detector choice depends on the asset’s criticality, accessibility, and operational constraints. Three deployment categories cover most scenarios:
5.1 Offline (Factory or Outage Testing)
- Use case: Acceptance tests, factory QA, maintenance outages.
- Features: High-voltage test sources, calibrated measurement circuits, sensitive noise-controlled environments.
- Pros/Cons: High accuracy and repeatability, but requires de-energization and does not capture real operational stresses.
5.2 Online (Permanent or Semi-Permanent)
- Use case: Continuous surveillance of critical transformers, GIS, and switchgear.
- Features: Permanently installed UHF/TEV/HFCT arrays, synchronized DAQs, real-time analytics, SCADA integration.
- Pros/Cons: Captures live behavior and trends; higher initial cost but lower risk of missing intermittent defects.
5.3 Portable/Handheld
- Use case: Rapid screening, diagnostics, and periodic audits.
- Features: Clamp-on HFCTs, handheld TEV/ultrasonic instruments, data logging.
- Pros/Cons: Flexible and affordable; snapshot views require expertise to interpret amid variable noise conditions.
5.4 Hybrid Programs
Many operators combine continuous monitors on high-risk assets with portable surveys across the wider fleet. Findings from handheld rounds inform where to install permanent sensors.
6. UHF and TEV Sensors in PD Detection

UHF and TEV techniques are widely adopted in metal-clad environments and GIS due to their sensitivity to electromagnetic energy from PD and practical mounting options.
6.1 UHF Sensors
- Principle: Capture radiated EM pulses in the 300 MHz–3 GHz range through coupling windows or internal ports.
- Applications: GIS spacers, transformer turrets, metal-clad compartments, cable terminations.
- Strengths: High immunity to power-frequency noise; useful for PRPD pattern formation and localization with multiple antennas.
- Considerations: Requires careful grounding, short coax runs, and shielding; antenna placement strongly affects sensitivity.
6.2 TEV Sensors
- Principle: Detect transient earth voltages induced on metal surfaces by internal discharges.
- Applications: MV switchgear doors and panels; cable boxes and bus enclosures.
- Strengths: Fast, simple installation; effective for screening during handheld rounds.
- Limitations: Susceptible to external interference; best when combined with ultrasonic or UHF confirmation.
6.3 HFCT for Conducted PD
- Principle: Clamp-on high-frequency current transformers detect PD pulses flowing in grounds or cable shields.
- Use: Suitable for cable joints/terminations and transformer grounding leads; complements UHF antennas for corroboration.
6.4 Installation and Tuning
| Item | Best Practice | Benefit |
|---|---|---|
| Grounding | Star-ground shields, avoid loops | Lower noise floor |
| Cabling | Short, low-loss coax; high-quality connectors | Preserve high-frequency content |
| Placement | Near suspected stress points (bushings, terminations) | Higher sensitivity to localized PD |
| Time Sync | GPS/PTP for multi-sensor arrays | Accurate PRPD and triangulation |
7. Acoustic and Ultrasonic PD Detection
Acoustic/ultrasonic detection captures mechanical waves generated by ionization and micro-arcs. These methods excel at localizing defects, especially where EM signals are attenuated or ambiguous.
7.1 Ultrasonic Probes
- Airborne probes: Scan along seams, inspection windows, and cable boxes to pick up airborne ultrasonic energy.
- Contact probes: Couple to the enclosure to detect structure-borne vibrations from discharge sites.
7.2 Frequency Bands and Filtering
- Typical bands: 20–300 kHz for ultrasonic; narrowband filters suppress industrial noise.
- Heterodyning: Convert ultrasonic to audible for headphone-assisted localization.
7.3 Localization Procedure
- Perform a coarse scan to identify high-energy zones.
- Switch to contact mode and refine positioning across seams and joints.
- Correlate with UHF/TEV readings and visual inspection to confirm root cause.
7.4 Strengths and Limits
| Aspect | Strength | Limitation |
|---|---|---|
| Localization | Pinpoints sources effectively | Requires access and operator skill |
| Noise immunity | Narrowband filtering reduces EMI issues | Mechanical noise can mask weak PD |
| Applicability | Useful in metal-clad and cable boxes | Less effective at long stand-off distances |
“`html
8. Optical and Fiber-Based PD Detection
Optical PD detection technologies rely on light emission or refractive index changes caused by partial discharges. When a discharge occurs, it generates ultraviolet or visible photons within the insulation medium. Fiber optic sensors or photodetectors capture these emissions to quantify and locate the event. In enclosed or oil-filled equipment, fiber optics offer an immune and intrinsically safe detection method, unaffected by electromagnetic interference.
8.1 Fluorescent Fiber Sensing in Transformers
Fluorescent fiber sensors can detect localized discharges and temperature changes within transformer windings or tap changers. The optical fiber routes light signals through dielectric-safe paths, providing simultaneous temperature and PD intensity monitoring. This dual capability enhances system awareness and enables integration with smart transformer monitoring systems.
8.2 Benefits of Fiber-Optic PD Detection
- High immunity to electromagnetic noise
- Safe for oil-immersed and high-voltage environments
- Real-time, multi-point measurement using distributed sensing networks
- Integration with existing optical temperature systems
9. PD Measurement Parameters and Indicators

A PD detector quantifies several parameters that describe discharge severity, frequency, and energy distribution. These metrics form the basis for risk assessment and maintenance decisions.
| Parameter | Description | Typical Unit |
|---|---|---|
| Apparent Charge (q) | Magnitude of discharge inferred from calibration | pC (picoCoulombs) |
| Pulse Repetition Rate | Number of discharges per power cycle | counts/s |
| Phase Relation | Phase angle of discharge occurrence | Degrees |
| PD Energy Spectrum | Frequency-domain distribution of PD pulses | dBμV |
| PRPD Pattern | Graphical mapping of PD magnitude vs. phase | – |
Interpreting these parameters requires both experience and software analytics. PRPD pattern clustering, trend trending, and frequency analysis help identify internal voids, surface tracking, corona discharges, and floating potentials.
10. PD Pattern Recognition and Analysis
Advanced PD detectors employ machine learning and statistical algorithms to automate pattern interpretation. By training on known defect libraries, the software can classify discharge types and estimate severity. This assists engineers in planning interventions without manual inspection every time.
10.1 Pattern Features
- Phase distribution asymmetry
- Amplitude envelope shape
- Pulse repetition density
- Spectral centroid movement over time
10.2 Trending and Forecasting
Continuous PD trending allows predictive maintenance. When a defect shows steadily rising discharge magnitudes, it signals progressive insulation deterioration. Combining PD data with temperature and load information enhances reliability modeling and long-term asset health prediction.
11. PD Detection in Transformers
Transformers are particularly vulnerable to PD activity within windings, bushings, tap changers, and lead exits. Discharges may occur in voids in paper-oil insulation, around conductor edges, or near unsealed interfaces. Partial discharge detectors provide vital early warnings before dielectric breakdown occurs.
11.1 Detection Methods
- UHF Antennas: Mounted in oil drain valves or inspection ports to detect electromagnetic radiation.
- HFCT Sensors: Installed on grounding leads to measure conducted PD currents.
- Optical Fiber Sensors: Embedded near winding hotspots for temperature and light detection.
- Acoustic Sensors: Identify structural vibrations resulting from discharges in oil or solid insulation.
11.2 Integration with Other Transformer Monitors
- Temperature Monitoring: Fiber optic sensing measures winding and core temperatures in real-time.
- Gas Analysis (DGA): Dissolved gas monitoring confirms discharge activity via hydrogen and acetylene growth.
- Moisture and Pressure Sensors: Detect environmental conditions contributing to PD formation.
11.3 Alarm and Protection Link
When PD activity exceeds pre-set thresholds, detectors issue alarms to the SCADA or local PLC system. Operators can reduce load, increase cooling, or trigger an automated oil filtration or dehumidification sequence to mitigate further risk.
12. PD Detection in Switchgear and GIS Systems
Gas-insulated switchgear (GIS) and metal-clad switchgear are common PD sources due to their compact design and high field stress. Typical PD sites include spacers, contacts, and gas voids. Continuous monitoring is essential to maintain reliability and safety.
12.1 Common PD Sites
- Defective spacer surfaces
- Contaminated or metallic particle surfaces
- Loose connections or floating electrodes
12.2 Monitoring Technologies
- UHF Sensors: Installed in GIS inspection windows or couplers for high sensitivity.
- TEV Probes: Applied externally for MV switchgear partial discharge detection.
- Ultrasonic Sensors: Scan seams and doors for audible/ultrasonic energy caused by surface discharges.
12.3 Trend Analysis and Alerts
Continuous PD monitoring platforms log data to databases, applying algorithms to detect spikes or pattern changes. Smart alarms prioritize events by severity and duration, helping maintenance teams schedule intervention efficiently.
13. PD Detection in Cables and Bus Ducts
Cables and bus ducts can suffer from void discharges in insulation, poor joint terminations, or moisture ingress. PD detectors for cables typically use HFCT clamps and traveling-wave methods for localization.
13.1 Cable PD Techniques
- Clamp HFCT sensors at both ends to measure propagation time difference.
- Use time-domain reflectometry to locate discharge positions.
- Combine PD data with insulation resistance and tan-delta tests for complete diagnostics.
13.2 Bus Duct and Joint Monitoring
Bus ducts are monitored using TEV and acoustic probes at junction boxes and connections. Modern digital systems correlate PD activity with temperature, humidity, and load data, producing comprehensive dashboards for asset managers.
14. Data Acquisition and Communication Interfaces
To transform raw PD pulses into usable insights, detectors employ synchronized data acquisition modules (DAQ) and digital communication protocols. Modern systems prioritize open architecture and interoperability.
14.1 Hardware Features
- Sampling rates from 100 MS/s to 1 GS/s for detailed pulse shapes
- 16–24-bit resolution for accurate magnitude measurement
- GPS or IEEE 1588 time stamping for multi-channel correlation
- Edge computing for local preprocessing and noise filtering
14.2 Communication Interfaces
- Ethernet: Standard RJ45 or fiber optics, supporting Modbus TCP/IP or IEC 61850 protocols
- RS485: For legacy systems and Modbus RTU integration
- Wireless Modules: Optional 4G/LTE or Wi-Fi for remote sites
- SCADA Integration: OPC UA, MQTT, or IEC 60870-5-104 for centralized monitoring
14.3 Data Visualization
Collected PD data is visualized through dashboards showing magnitude trends, PRPD maps, alarm logs, and cross-sensor comparisons. Multi-language interfaces and web-based analytics allow engineers to view health indices from any connected device.
15. Integration with SCADA and Condition Monitoring Systems
Integrating PD detectors with SCADA, IoT transformer sensors, and condition monitoring software centralizes asset management. Data flows from field devices through gateways into cloud or control room databases, where analytics identify early warnings across multiple assets.
15.1 Benefits of Integration
- Unified asset health dashboard combining PD, temperature, and vibration data
- Automatic event reporting and alarm forwarding
- Data-driven maintenance planning and spare part optimization
15.2 Typical Communication Protocols
| Protocol | Use Case | Compatibility |
|---|---|---|
| IEC 61850 | Substation automation and protection | Switchgear, transformer monitors |
| Modbus TCP/RTU | Industrial networks and gateways | Legacy integration |
| OPC UA | Cross-platform communication | SCADA, cloud analytics |
| MQTT | IoT and remote asset monitoring | Wireless/cloud-based systems |
16. Calibration and Testing of PD Detectors
Calibration ensures that partial discharge detectors measure apparent charge and pulse energy with precision. Without calibration, readings across different sites or instruments can vary widely, leading to misinterpretation. International standards such as IEC 60270 and IEC 62478 define test methods and verification requirements for PD measuring systems.
16.1 Calibration Procedure
- Use a standard PD calibrator capable of injecting known charge impulses (typically 5–5000 pC).
- Connect the calibrator across the measuring impedance of the detector.
- Apply repetitive pulses at different amplitudes to verify linearity.
- Adjust gain factors and verify phase-resolved accuracy using reference waveforms.
- Document results and revalidate at least once per year or after major hardware changes.
16.2 On-Site Verification
- Use built-in test pulse generators to verify system response without dismantling sensors.
- Compare live readings from multiple sensors (UHF + HFCT) to ensure cross-consistency.
- Confirm time synchronization between DAQ channels within ±1 μs accuracy.
16.3 Data Quality Assurance
Periodic system audits, environmental checks, and sensor cleaning help maintain reliable results. Software-based quality flags can automatically indicate data gaps, excessive noise, or calibration drift.
17. Advantages of Intelligent PD Monitoring Systems
Modern PD detectors are not standalone instruments—they form part of intelligent asset management systems that combine sensing, analytics, and remote control. These advanced features deliver substantial advantages over traditional manual tests.
17.1 Continuous Monitoring
- 24/7 tracking of PD activity under real load and environmental conditions.
- Elimination of missed events caused by short-lived or load-dependent discharges.
17.2 Predictive Maintenance
- AI algorithms predict insulation deterioration trends using multi-sensor input.
- Maintenance scheduling becomes condition-based rather than periodic.
17.3 Integration with Other Smart Devices
- Combine with transformer digital monitors, IoT transformer sensors, and fiber optic temperature systems.
- Unified dashboards show temperature, vibration, and PD risk levels side by side.
17.4 Operational Benefits
| Feature | Operational Benefit |
|---|---|
| Real-time alerting | Immediate awareness of insulation stress conditions |
| Historical trending | Long-term view of asset deterioration |
| Automated reports | Faster decision-making for engineers and management |
| Reduced inspection time | Remote access minimizes field visits |
18. Typical Applications and Case Examples
Partial discharge detectors are used worldwide across power utilities, heavy industries, and renewable energy projects. Below are selected examples showing practical implementation and benefits.
18.1 Malaysia — Transformer Online PD and Thermal Integration
In Malaysia’s utility sector, online PD detectors with fiber optic temperature sensing were installed on 132 kV transformers. The system integrated UHF antennas, HFCT sensors, and fluorescent fiber probes, transmitting data to a central SCADA via IEC 61850. Within six months, the platform detected abnormal PD bursts correlated with load peaks, prompting preventive oil filtration and averting failure.
18.2 Indonesia — GIS Substation Monitoring
Jakarta’s main grid operator deployed UHF PD monitoring on GIS bays. The detectors captured electromagnetic pulses caused by particle movement in SF₆ compartments. After maintenance, PD levels dropped by 70%, validating the system’s effectiveness and leading to standardization across multiple substations.
18.3 Middle East — Industrial Switchgear Reliability Upgrade
In a petrochemical plant, online PD detection and vibration monitoring were combined with predictive analytics. The hybrid system identified insulation degradation before shutdowns occurred, reducing maintenance cost by 40% annually.
18.4 Europe — Utility-Scale Renewable Integration
Wind farm transformers in Germany adopted PD monitoring combined with transformer oil moisture sensors and IR thermal cameras. The system transmitted live data to a cloud-based analytics platform, improving transformer uptime to 99.8%.
19. Frequently Asked Questions (Technical FAQ)
Q1. What is the main purpose of a partial discharge detector?
A PD detector identifies tiny insulation defects that release electrical energy as partial discharges. These small discharges act as early indicators of insulation weakness, allowing operators to take corrective action before catastrophic failure. The detector quantifies discharge magnitude, frequency, and phase to evaluate insulation condition objectively.
Q2. Can PD detection be done while equipment is energized?
Yes. Modern systems support online PD monitoring, meaning they can measure discharge activity under normal operating voltage. Online detection avoids outages and provides realistic insights into insulation stress, making it the preferred method for power utilities and industries.
Q3. How do UHF and HFCT sensors differ?
UHF sensors detect electromagnetic radiation in the GHz range and are ideal for GIS or metal-clad equipment. HFCT sensors measure high-frequency current pulses flowing through grounding conductors or cable shields, making them suitable for cable joints and transformers. Combining both offers comprehensive coverage and higher diagnostic confidence.
Q4. How often should a PD detector be calibrated?
Calibration is typically performed annually or after hardware modifications. Following IEC 60270 ensures consistent measurement of apparent charge. Many detectors now include self-test functions to verify calibration on-site using internal reference pulses.
Q5. What factors can cause false PD readings?
External electromagnetic noise, corona discharge, or switching transients can mimic PD signals. Using multiple sensor types, proper shielding, and noise gating algorithms minimizes false positives. Correlating PD events with temperature and humidity data helps confirm authenticity.
Q6. What role does fiber optic sensing play in PD systems?
Fiber optic sensors measure temperature and sometimes optical emissions caused by PD events. Their immunity to electromagnetic interference makes them ideal for transformers, GIS, and high-voltage applications. When combined with UHF and acoustic sensors, fiber optics provide a more complete diagnostic picture.
Q7. Is PD detection suitable for renewable power systems?
Absolutely. Wind farm transformers, solar inverter stations, and offshore substations all benefit from PD monitoring. In harsh climates, continuous online detection ensures long service life and compliance with reliability standards.
Q8. How can PD monitoring data improve maintenance planning?
By trending PD magnitude and count rate, operators can prioritize maintenance according to actual asset condition. Integration with CMMS software triggers work orders automatically when thresholds are exceeded, reducing downtime and maintenance costs.
20. About Our Manufacturing and PD Detection Solutions
We are a professional manufacturer of transformer and switchgear monitoring systems, supplying high-performance partial discharge detectors, fiber optic temperature sensors, and integrated monitoring platforms for global utilities and OEMs. Our production facilities are ISO 9001 certified, and all products undergo strict electromagnetic and thermal stress testing before shipment.
Our Offerings Include:
- UHF/TEV/HFCT PD sensors with modular DAQ units
- Fluorescent fiber optic temperature systems for transformers
- Complete transformer digital monitoring and IoT sensor packages
- SCADA and cloud-based monitoring software supporting IEC 61850 and Modbus TCP
Why Choose Us
- Factory-direct manufacturing with full customization support
- Global experience in Asia, the Middle East, and Europe
- Comprehensive technical support, commissioning, and training
- Competitive pricing and certified export documentation
Contact and Inquiry
To request detailed product data, system integration advice, or an official quotation, please contact our sales and engineering team. We provide OEM and ODM services for energy utilities, equipment integrators, and research institutes.
Commitment Statement
As a factory manufacturer, we deliver end-to-end transformer monitoring and protection solutions with full certification and proven reliability. Our mission is to help customers achieve higher equipment safety, lower maintenance costs, and smarter asset management through technology-driven innovation.

Fiber optic temperature sensor, Intelligent monitoring system, Distributed fiber optic manufacturer in China
 |
 |
 |