 INNO fibre optic temperature sensors ,temperature monitoring systems.
- A busbar is the high-current conductor backbone of every switchgear panel, power distribution board, and circuit breaker assembly — its failure triggers arc flash, fire, and total system outage.
- Switchgear busbar faults and circuit breaker connection faults develop silently over months; only real-time online monitoring catches them before they escalate.
- Continuous bus bar temperature monitoring is proven to prevent arc flash events, eliminate unplanned power outages, and reduce maintenance costs across industrial and utility electrical infrastructure.
- Fluorescence fiber optic temperature sensors deliver complete EMI immunity and galvanic isolation that no metallic sensor technology can match in live medium-voltage switchgear.
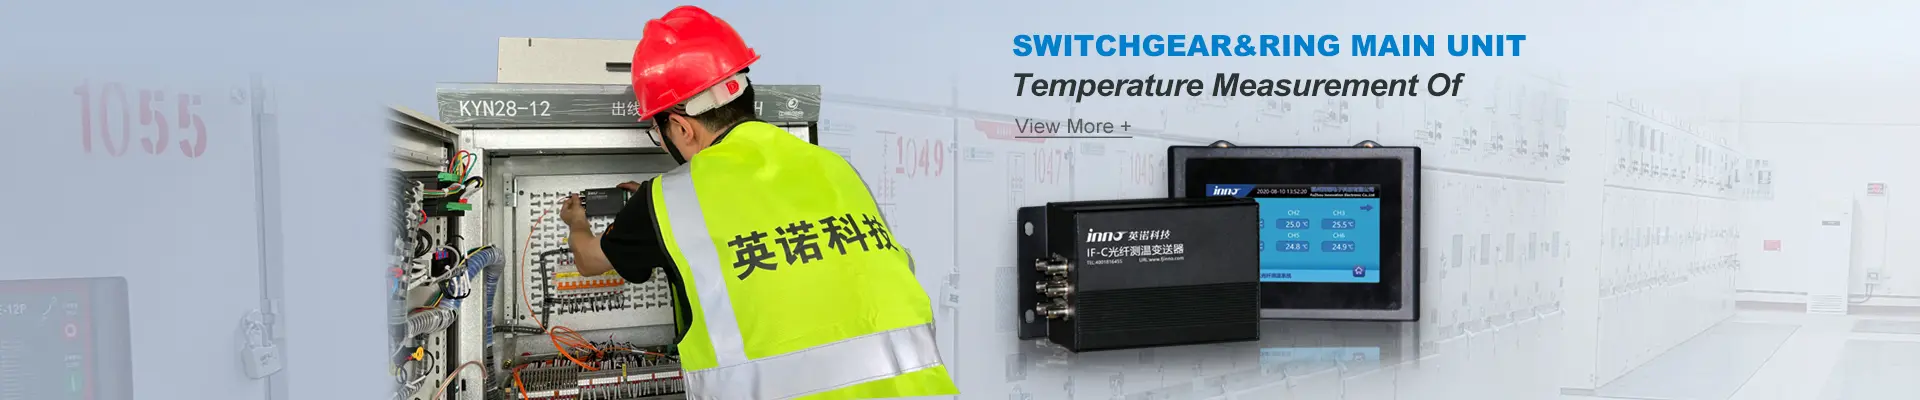
- A complete fluorescence fiber optic busbar monitoring system consists of a demodulator, sensing probes, fluorescence fiber, a display module, and monitoring software — five integrated components, one continuous protection layer.
- Fuzhou Innovation Electronic Scie&Tech Co., Ltd. has manufactured professional fiber optic busbar monitoring solutions since 2011 and supplies customized systems to power, industrial, and infrastructure projects worldwide.
1. What Is a Busbar in Switchgear and Power Distribution Systems
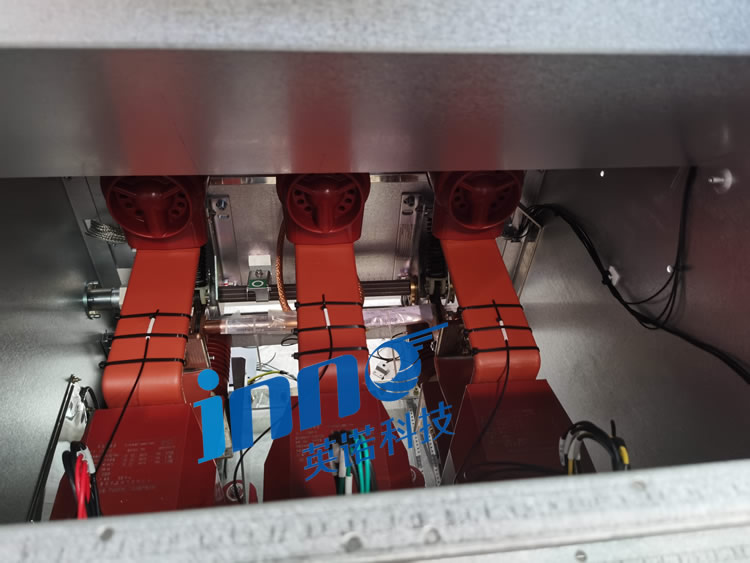
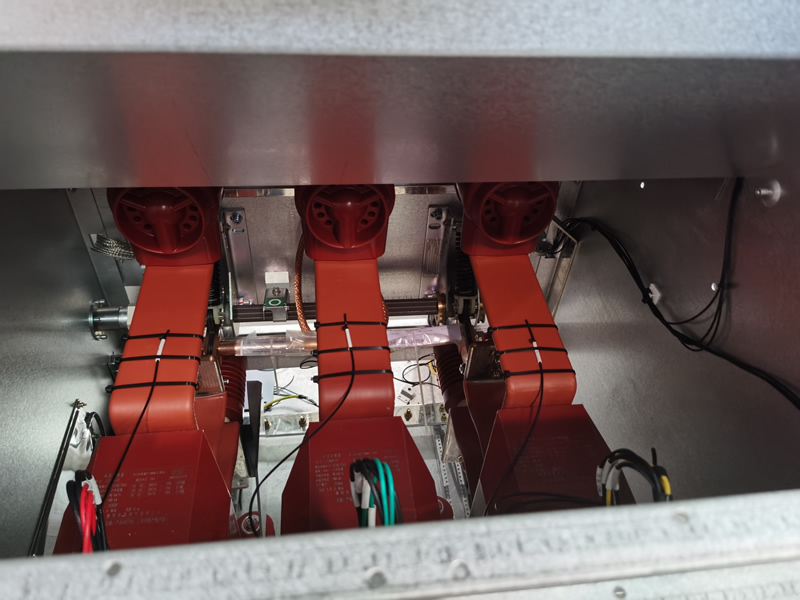
A busbar — also written as bus bar — is a rigid copper or aluminum conductor installed inside electrical switchgear panels, ring main units, motor control centers, and low-voltage distribution boards to collect and redistribute high-current power across multiple outgoing feeders from a single point. Every circuit in a facility ultimately traces its supply back through one or more busbars. The structural and electrical integrity of those busbars determines the reliability of the entire downstream power system.
1.1 Where Busbars Are Found in Electrical Power Infrastructure
Busbars are present at every voltage level of the power distribution hierarchy. In medium-voltage switchgear operating at 6 kV to 36 kV, the main busbar interconnects incoming supply feeders with outgoing circuit breaker panels and transformer secondaries. In low-voltage main distribution boards, busbars distribute power from the main incomer to sub-distribution boards, motor starters, and final circuits. In busbar trunking systems — also called busway systems or rising mains — enclosed busbars run vertically through multi-story buildings or horizontally across factory floors to deliver power to tap-off points without individual cables. Generator terminal busbars, transformer bushing connections, and traction rectifier output busbars in railway substations are further examples of critical busbar applications where continuous temperature monitoring is essential.
1.2 Why Busbar Integrity Is the Foundation of Electrical System Reliability
Unlike a fused circuit where a single cable fault affects only one final circuit, a fault on a main switchgear busbar affects every circuit fed from that switchgear section simultaneously. There is no selective protection that limits the impact. For facilities operating critical loads — data centers, hospitals, chemical plants, refineries, water treatment works — a main busbar fault is a business-critical event. The physical cause of most busbar failures is progressive thermal degradation at connection joints, a mechanism that develops slowly, is invisible to periodic inspection, and is reliably detectable only by continuous real-time busbar temperature monitoring.
2. Switchgear Busbar Faults: Root Causes, Escalation Risks, and the Role of Online Condition Monitoring

Switchgear busbar faults rank among the most costly and hazardous failures in any electrical power installation. Because the switchgear busbar serves as the common connection point for all panels in a switchboard lineup, a fault at this location is inherently widespread in its consequences. Understanding what causes busbar faults — and how online busbar condition monitoring intercepts them before they reach the destructive phase — is fundamental to any credible electrical asset management program.
2.1 Thermal Runaway at Bolted Busbar Joints
The dominant failure mechanism in medium-voltage switchgear busbars and low-voltage distribution panel busbars alike is thermal runaway at bolted connection joints. Every busbar section joint, every circuit breaker terminal, and every instrument transformer connection relies on a bolted interface to maintain electrical continuity. That interface depends on sustained clamping force between the mating surfaces to hold contact resistance at an acceptably low level. Thermal cycling — the repeated expansion and contraction of conductor material as load varies between day and night, season to season — gradually relaxes the tension in joint bolts. Vibration from nearby motors, transformers, and switching operations contributes additional mechanical fatigue. As clamping force decreases over years of service, contact area shrinks and contact resistance rises. Higher resistance under load means more heat generated locally. More local heat means faster oxidation of contact surfaces, which raises resistance further. This self-reinforcing cycle continues until the joint reaches a temperature that carbonizes adjacent insulation, ignites surrounding material, or initiates an arc.
2.2 Environmental Degradation Factors in Switchgear Panel Busbars
Beyond mechanical joint loosening, environmental factors accelerate switchgear panel busbar degradation. Humidity condensing on busbar insulation surfaces promotes the growth of oxide and sulfide films on exposed copper or aluminum contact areas. In coastal, industrial, and chemically aggressive environments, airborne contaminants deposit on insulation surfaces and create partial discharge paths between phases or between phase and earth. In facilities with poor cable management or inadequate ventilation, sustained elevated ambient temperature inside the switchgear enclosure adds thermal stress to all components simultaneously, shortening insulation life and accelerating joint degradation. Real-time busbar temperature monitoring provides the only continuous, quantitative record of thermal conditions at each joint and can differentiate between load-driven temperature rise and resistance-driven hot spot development.
2.3 Arc Flash: The Terminal Consequence of an Unmonitored Switchgear Busbar Fault
When a developing switchgear busbar fault is not detected and corrected, the end result is arc flash. The arc flash event releases enormous energy in milliseconds — temperatures at the arc root exceed 15,000 °C, vaporizing copper conductors and producing a rapidly expanding blast wave. Personnel within several meters face fatal or life-altering burn injuries from radiated heat flux. The blast pressure destroys equipment in the immediate vicinity. Damage typically extends well beyond the faulted panel, consuming the entire switchgear lineup in larger events. The operational, financial, legal, and human consequences of a single arc flash event in a main switchroom dwarf the total lifetime cost of a comprehensive switchgear busbar monitoring system by orders of magnitude. The economic and ethical case for continuous monitoring is unambiguous.
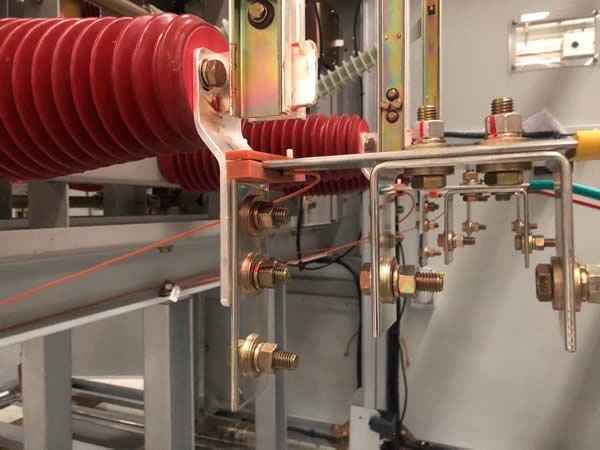
3. Circuit Breaker Busbar Connection Faults and the High-Risk Stab Terminal Zone in Power Switchgear

The mechanical interface between a circuit breaker and the main switchgear busbar is one of the most thermally and mechanically stressed locations in any power distribution assembly. Whether the breaker uses a draw-out stab-in connection or a fixed bolted terminal arrangement, this interface must simultaneously carry full rated current, withstand repeated fault-clearing mechanical shocks, and maintain dimensional stability across decades of thermal cycling. It is an inherently demanding duty, and it explains why circuit breaker terminal hot spots are among the most commonly identified faults in switchgear infrared inspection programs — and among the most dangerous when they go undetected between inspection intervals.
3.1 Mechanical Fatigue at Draw-Out Breaker Stab Connections
In draw-out switchgear designs, the circuit breaker connects to the main busbar through spring-loaded stab contacts that engage when the breaker is racked into the service position. The contact force maintaining this connection depends on the spring tension of the stab assembly and the dimensional tolerance of the contact surfaces. Over hundreds of rack-in and rack-out operations, combined with the impulse forces transmitted through the stab assembly each time the breaker clears a fault, these spring contacts fatigue. Contact pressure decreases, resistance rises, and thermal output at the stab zone increases under load. In a large industrial switchboard with dozens of draw-out breaker panels, continuous real-time circuit breaker busbar temperature monitoring at the stab zone of each panel is the only method that provides comprehensive coverage of this failure mechanism without repeated risky panel opening for manual inspection.
3.2 Why Standard Protection Relays Do Not Catch Developing Connection Faults
It is worth clarifying a common misconception: standard overcurrent protection relays, earth fault relays, and differential protection schemes are designed to detect and isolate complete electrical faults — they do not detect developing thermal faults in their early stages. A loose connection that has raised joint resistance enough to generate significant excess heat will still carry the full load current without tripping any protection element. The current flowing through the joint is unchanged — only the voltage drop across the joint and the heat dissipated in it have increased. By the time the fault has progressed far enough to cause a voltage disturbance or insulation failure that a protection relay can detect, it has already reached an advanced stage. Continuous online busbar condition monitoring fills this detection gap.
4. Why Real-Time Online Busbar Condition Monitoring Is Non-Negotiable for Modern Power Infrastructure
The argument for continuous, real-time bus bar monitoring rests on a simple and inescapable logic: the failure mechanism that destroys switchgear and injures personnel is invisible to all forms of periodic inspection, and it develops on timescales that make annual or even quarterly maintenance programs structurally incapable of catching it in time. Only a system that measures temperature continuously at every critical joint — and that alerts maintenance personnel the moment an abnormal trend begins — can reliably prevent the failure before it becomes a catastrophe.
4.1 From Time-Based to Condition-Based Electrical Maintenance
Traditional electrical maintenance programs schedule outages at fixed intervals — annually, semi-annually, or quarterly — for visual inspection, torque verification of bolted joints, and thermal scanning. This time-based approach made sense when continuous monitoring was not technically or economically viable. Today, fluorescence fiber optic busbar monitoring systems make permanent, continuous, cost-effective temperature monitoring of every critical joint in a switchgear installation straightforward. The transition from time-based to condition-based maintenance that this enables has measurable benefits: fewer planned outages, no emergency outages, maintenance labor focused on joints that actually need attention rather than divided equally across all joints, and a documented temperature history for every point in the system that supports asset life extension decisions.
4.2 Regulatory Standards Supporting Continuous Busbar Monitoring in Power Systems
IEC 62271-1 defines maximum permissible temperature rises for switchgear busbars and connection components. IEC 62271-200 addresses thermal requirements for enclosed medium-voltage switchgear busbars specifically. NFPA 70B recommends condition-based maintenance including continuous temperature measurement as the preferred strategy for electrical equipment asset management. NFPA 70E establishes arc flash risk reduction requirements that continuous switchgear panel monitoring directly supports by reducing the probability of arc flash initiation. IEEE C37.20.1 and C37.20.2 cover switchgear thermal performance requirements in North American markets. Facility risk managers, insurers, and regulatory authorities in a growing number of jurisdictions treat documented continuous monitoring as a baseline expectation for critical electrical infrastructure.
4.3 Financial and Operational Case for Busbar Monitoring Investment
The financial case for busbar condition monitoring does not require sophisticated modeling. The cost of a complete fiber optic monitoring system for a medium-voltage switchgear lineup is recoverable from the prevention of a single arc flash event, which typically results in total equipment loss, extended outage, structural building repair, emergency procurement costs, and — if personnel injuries occur — medical and legal costs that dwarf the monitoring investment. For facilities with continuous processes where even a brief unplanned outage causes production losses in the tens or hundreds of thousands of dollars per hour, the monitoring system pays for itself in risk reduction terms from the first day of operation.
5. Fiber Optic vs. Conventional Busbar Temperature Sensing Technologies: Full Performance Comparison
Several temperature sensing technologies are deployed in busbar monitoring and switchgear condition monitoring applications. The table below compares fluorescence fiber optic sensors against the four most commonly used alternatives across ten criteria that determine real-world suitability for live high-voltage power equipment monitoring. The comparison makes clear why fiber optic technology is the technically superior choice for permanent installation in medium-voltage switchgear, generator terminals, and other demanding power system environments.
| Criterion | Fluorescence Fiber Optic Sensor | Thermocouple (K/T) | RTD / PT100 | Wireless IR Sensor | Handheld Thermal Camera |
|---|---|---|---|---|---|
| EMI / EMC Immunity | ✅ Complete — sensing path carries light only, zero metal conductors | ❌ Metal leads act as antenna; significant interference in switchgear | ❌ Metal leads susceptible to EMI and ground loop errors | ⚠️ RF signal attenuated by metal enclosures; reliability variable | ❌ External tool; no continuous monitoring capability |
| High-Voltage Galvanic Isolation | ✅ Intrinsic isolation exceeds 100 kV — glass fiber, no conductive path | ❌ Metal conductors require additional insulation barriers at MV | ❌ Metal conductors require additional insulation; ground potential risk | ⚠️ Partial isolation only; depends on mounting and enclosure design | ❌ Panel door must be opened; direct arc flash exposure during use |
| Measurement Accuracy | ✅ ±0.5 °C to ±1 °C — stable over full service life | ⚠️ ±1 °C to ±2.5 °C; degrades with oxidation and thermal fatigue | ✅ ±0.1 °C to ±0.5 °C (4-wire); stable in clean environments | ⚠️ ±2 °C to ±5 °C; emissivity variation causes significant error | ⚠️ ±2 °C typical under ideal conditions; operator-dependent |
| Continuous Online Monitoring | ✅ 24/7 real-time data; no manual intervention required | ✅ Continuous | ✅ Continuous | ✅ Continuous within RF range | ❌ Snapshot only; periodic manual inspection |
| Installation on Live Equipment | ✅ Safe — non-conductive fiber; no energization hazard | ⚠️ Metal body near live conductor; de-energizing recommended | ⚠️ Metal body; de-energizing recommended for MV applications | ⚠️ Mounting inside live enclosure carries risk; varies by design | ❌ Panel opening required; arc flash exposure every inspection |
| Long-Term Service Life | ✅ Over 25 years; no recalibration required | ⚠️ 3–10 years; thermoelectric drift and oxidation cause output shift | ⚠️ 5–15 years; contamination and vibration degrade accuracy | ⚠️ 3–7 years; battery replacement and electronics aging | N/A — handheld instrument, not a permanent installation |
| Multi-Point Scalability | ✅ 1–64 channels per single transmitter unit | ⚠️ Typically one transmitter per channel; scales costly | ⚠️ Typically one transmitter per channel; scales costly | ⚠️ Limited by receiver bandwidth and RF interference environment | ❌ Sequential manual scanning; not scalable |
| Suitability for MV Switchgear (>1 kV) | ✅ Purpose-designed for medium and high-voltage power equipment | ❌ Significant insulation and safety engineering required | ❌ Significant insulation and safety engineering required | ⚠️ Limited commercial products rated for MV environments | ⚠️ Usable but creates arc flash exposure during every scan |
| Communication Output | ✅ RS485 / Modbus RTU — open standard, SCADA-ready | ⚠️ Analog 4–20 mA or RS485 via separate signal conditioner | ⚠️ Analog or RS485 via separate transmitter module | ⚠️ Proprietary RF protocol; gateway device required | ❌ No automatic data output; manual recording only |
| Overall Suitability for Permanent Busbar Monitoring | ✅ Highest — recommended for all MV and LV busbar applications | ⚠️ Acceptable in LV applications with low EMI | ⚠️ Acceptable in LV applications; not recommended for MV | ⚠️ Secondary option for LV; significant limitations at MV | ❌ Supplementary inspection tool only; not a monitoring system |
6. Fluorescence Fiber Optic Busbar Monitoring System: Five Core Components and Their Functions
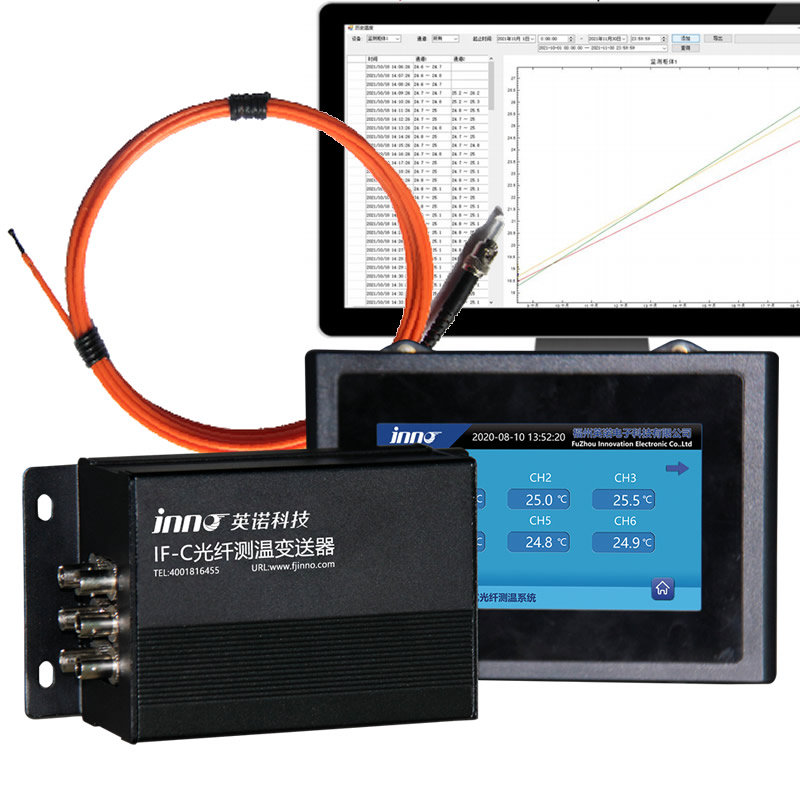
A complete fluorescence fiber optic busbar monitoring system integrates five purpose-designed components into a continuous measurement and alarm chain. Each component has a distinct role, and all five must work together correctly to deliver reliable real-time switchgear temperature monitoring.
6.1 Fluorescence Fiber Optic Temperature Demodulator
The fluorescence fiber optic demodulator — also called the fiber optic temperature transmitter or fiber optic interrogator — is the central processing unit of the monitoring system. It generates the optical excitation pulses, receives returning fluorescence signals from all connected probe channels, computes the temperature at each probe from the fluorescence lifetime decay characteristic, and outputs the results via the RS485 Modbus interface. A single unit serves 1 to 64 probe channels simultaneously.
6.2 Fluorescence Fiber Optic Sensing Probes
The fluorescence fiber optic sensing probe — or fiber optic point temperature probe — is the element placed directly at the busbar joint, breaker terminal, or connection point to be monitored. Its tip contains a rare-earth phosphor material whose fluorescence decay time is an exact function of temperature. Because the probe body and the optical fiber are entirely non-metallic, the probe is intrinsically immune to electromagnetic interference and provides complete galvanic isolation from the high-voltage conductor it touches.
6.3 Fluorescence Optical Fiber Cables
The fluorescence optical fiber is the light-conducting link between each sensing probe and the demodulator. It carries only photons — no electrical current — meaning it can be routed through live busbar compartments, past energized conductors at any voltage, without insulation coordination concerns or conducted noise. The fiber is the physical embodiment of the system’s dielectric isolation and EMI immunity.
6.4 Local Display Module
The fiber optic temperature monitoring display module provides on-site operators with a direct, real-time readout of temperatures across all monitored channels and visual indication of any active warning or critical alarms. It is panel-mounted in the instrument compartment of the switchgear or in an adjacent control cabinet, giving field personnel immediate visibility of busbar thermal status without any access to energized compartments.
6.5 Busbar Monitoring Software Platform
The busbar monitoring software aggregates all channel data from the demodulator via the RS485 interface and presents it on a centralized platform with real-time dashboards, configurable alarm thresholds, historical trend charts, and event logs. It connects to existing SCADA, DCS, BMS, or substation automation systems through standard Modbus TCP or other open protocols, positioning the bus bar monitoring system as one data source within a broader power system condition monitoring architecture.
7. How Fluorescence Fiber Optic Temperature Monitoring Works in Live High-Voltage Power Equipment

Fluorescence fiber optic temperature monitoring is based on the fluorescence lifetime decay method. The demodulator sends a short pulse of excitation light down the fiber to the probe tip. The rare-earth phosphor in the probe absorbs this pulse and emits a fluorescence signal whose intensity decays exponentially after the excitation ends. The time constant of that decay — the fluorescence lifetime — is a precise, material-specific function of temperature. The demodulator measures the decay time constant and converts it directly to a temperature reading. Because the measurement depends on a time ratio rather than an absolute signal intensity, it is unaffected by fiber bending losses, connector attenuation changes, or long-term variations in optical throughput. This self-referencing property is what gives fluorescence fiber optic sensors their long-term stability and eliminates the recalibration requirement that is an ongoing cost and operational burden with metallic sensing technologies.
7.1 Point Measurement at the Fault Origin in Switchgear and Power Equipment
The fluorescence fiber optic sensor is a point-measurement device: it measures temperature at the specific location of the probe tip. This is exactly what busbar connection monitoring requires. The thermal fault mechanism — rising contact resistance — generates heat at the joint, not along the length of the conductor. Placing a probe directly at the joint surface captures the temperature at the precise location where the fault originates. Distributed measurement techniques that average temperature over a length of busbar would dilute the localized hot spot signal and reduce sensitivity to early-stage faults. Point measurement at each joint is the correct approach, and it is what the fluorescence fiber optic probe architecture delivers.
7.2 Alarm Threshold Configuration for Effective Switchgear Busbar Fault Detection
Effective online busbar fault detection requires a two-tier alarm strategy. The first tier — a warning threshold — is set above the expected normal operating temperature at the monitored joint, triggering a maintenance investigation alert without requiring immediate action. The second tier — a critical threshold — is set near the maximum rated temperature of the conductor or insulation material, requiring prompt corrective response. Equally important is the differential alarm, which compares temperature readings between the three phase conductors at each joint location. Because all three phases in a balanced system carry the same current, they should run at similar temperatures under normal conditions. A phase-to-phase differential exceeding a configurable limit — typically 10 °C to 20 °C — immediately identifies the specific joint developing a high-resistance hot spot, even when the absolute temperature remains below fixed thresholds during low-load periods.
8. Switchgear, Power Distribution, and Industrial Applications for Fiber Optic Busbar Monitoring Systems
Fluorescence fiber optic busbar monitoring is applicable wherever high-current busbars operate in environments where conventional metallic sensors face limitations — which, in practice, means the majority of medium-voltage and high-current low-voltage electrical installations across every industry sector that depends on continuous and reliable power supply.
8.1 Medium-Voltage Switchgear and Primary Substation Busbars
Primary distribution substations and indoor medium-voltage switchgear rooms are the highest-priority applications. The combination of high fault energy potential, extended equipment replacement lead times, and critical load dependency makes continuous MV switchgear busbar monitoring a baseline protection measure for utility and industrial power systems alike.
8.2 Low-Voltage Main Distribution Boards and Busbar Trunking Systems
Low-voltage busbar monitoring in main distribution boards, sub-main switchboards, and enclosed busbar trunking systems is increasingly standard practice in data centers, hospitals, airports, and large commercial buildings where power continuity is a contractual or regulatory requirement.
8.3 Generator Terminal and Transformer HV/LV Bushing Connections
Generator output terminals and transformer primary and secondary bushing connections carry extremely high currents and are subject to significant mechanical vibration. Fiber optic temperature monitoring at these connection points provides early warning of loosening terminals and developing insulation faults in generating plant and transformer installations.
8.4 Railway Traction Substations and Rectifier Output Busbars
Railway traction substations operate DC busbars at very high current levels in environments with intense electromagnetic interference from traction return currents. The EMI immunity of fluorescence fiber optic sensors makes them the only reliable monitoring technology for traction rectifier output busbars and DC switchgear in railway power supply installations.
8.5 Renewable Energy Collector Switchgear and Offshore Installations
Wind farm collector switchgear, solar farm DC combiner boxes and MV transformers, and offshore platform electrical switchrooms all present challenging combinations of remote location, corrosive environment, and high cost of maintenance access. Permanent fiber optic busbar condition monitoring with remote data access reduces the frequency of physical inspections while maintaining comprehensive thermal surveillance of all critical connection points.
9. Manufacturer: Fuzhou Innovation Electronic Scie&Tech Co., Ltd. — Fiber Optic Busbar Monitoring Solutions Since 2011
Fuzhou Innovation Electronic Scie&Tech Co., Ltd. has designed and manufactured professional fluorescence fiber optic temperature monitoring systems for busbar monitoring, switchgear condition monitoring, power distribution temperature monitoring, and related high-voltage electrical applications since 2011. The company’s products are deployed across industrial power systems, utility substations, commercial building electrical infrastructure, and specialized high-voltage equipment in international markets. All systems are customizable for specific project requirements including channel count, fiber routing geometry, probe configuration, display and software integration, and communication protocol. Technical and application engineering support is provided directly by the manufacturing team.
- Founded: 2011
- Website: www.fjinno.net
- E-mail: web@fjinno.net
- WhatsApp / WeChat (China) / Phone: +86 135 9907 0393
- QQ: 3408968340
- Address: Liandong U Grain Networking Industrial Park, No.12 Xingye West Road, Fuzhou, Fujian, China
10. Frequently Asked Questions About Fiber Optic Bus Bar Monitoring and Switchgear Temperature Monitoring
Q1: What is the difference between bus bar monitoring and switchgear condition monitoring?
Bus bar monitoring refers specifically to the continuous measurement of temperature or other physical parameters at the busbar conductors and their connection joints inside a switchgear or distribution panel. Switchgear condition monitoring is a broader term that can include busbar monitoring alongside monitoring of other switchgear components such as circuit breaker mechanisms, insulation condition, partial discharge, and arc flash detection systems. In practice, busbar temperature monitoring is the most widely deployed and cost-effective component of a switchgear condition monitoring program because it addresses the most common failure mechanism directly.
Q2: How does fiber optic busbar monitoring integrate with an existing SCADA or BMS system?
The fluorescence fiber optic temperature demodulator communicates via the RS485 Modbus RTU interface, which is natively supported by virtually all SCADA platforms, substation automation systems, and building management systems. A Modbus TCP gateway can extend connectivity over Ethernet for IP-based systems. Integration requires configuration of the register map in the SCADA or BMS to read temperature values and alarm status from the demodulator. No proprietary middleware or additional hardware is needed beyond the gateway for IP-based connectivity.
Q3: Can the fiber optic busbar monitoring system be expanded after initial installation?
Yes. Because a single demodulator supports up to 64 channels, additional probe channels can be added at any time up to that capacity limit by connecting additional fiber optic probes to unused channel ports on the demodulator and updating the monitoring software configuration. For installations requiring more than 64 monitoring points, additional demodulator units can be networked together on the same RS485 bus and integrated into the same software platform.
Q4: What are the main causes of temperature alarms in a busbar monitoring system?
The most common causes of genuine temperature alarms in a busbar monitoring system are: loose or corroded bolted connections generating high contact resistance heat, overloading of the busbar or downstream circuit beyond its rated current capacity, failed or missing ventilation causing elevated enclosure ambient temperature, and — in draw-out switchgear — worn or misaligned stab contacts at circuit breaker connection points. Nuisance alarms can occur during very high ambient temperature events or during intentional overload conditions; correct threshold configuration accounting for normal load profile minimizes false positives.
Q5: Is fiber optic busbar monitoring suitable for DC power distribution systems?
Yes. The measurement principle of fluorescence fiber optic temperature sensors is indifferent to whether the monitored conductor carries AC or DC current. The sensor responds to the heat generated at the conductor surface, not to the electrical characteristics of the current. DC busbar applications including battery room busbars, UPS output busbars, rectifier output busbars, and traction power DC feeders are all fully supported. The EMI immunity of fiber optic sensors is particularly advantageous in DC power environments where high-frequency switching noise from power converters would interfere with conventional sensor outputs.
Q6: How does differential temperature alarm detection work in a switchgear busbar monitoring system?
In a three-phase power system, all three phase busbars in a balanced installation carry the same current and should therefore operate at closely similar temperatures under normal conditions. A differential temperature alarm continuously compares the temperature of each monitored point against the average of the corresponding points on the other two phases. When one phase temperature deviates from the average by more than a configurable threshold — indicating that a specific joint on that phase is generating abnormal resistance heat — an alarm is raised identifying the exact location of the developing fault. Differential alarms detect localized hot spots at load levels too low to trigger absolute temperature thresholds, providing earlier warning than absolute alarms alone.
Q7: What maintenance does a fiber optic busbar monitoring system require?
The fluorescence fiber optic busbar monitoring system requires minimal maintenance. The demodulator is an electronic instrument that benefits from periodic firmware updates and visual inspection during scheduled maintenance outages. The optical fiber cables and probe assemblies have no moving parts, no consumable components, and no battery — they require only that connectors and routing clamps remain physically secure. System health can be verified remotely through the monitoring software by checking that all channel readings are updating normally and that signal quality indicators are within normal range. No periodic recalibration is required.
Q8: How is the fiber optic probe physically attached to the busbar surface?
The most common attachment methods for fiber optic busbar temperature probes are stainless steel spring clips that clamp around the busbar profile, adhesive thermal interface mounts bonded directly to the busbar surface, and custom-machined saddle brackets matched to the specific busbar cross-section and available from the manufacturer for standard busbar profiles. For bolted joint monitoring, the probe tip is typically positioned against the head of the connection bolt or wedged into the joint interface to capture the joint temperature as directly as possible. All attachment methods are designed to be installed on energized conductors by qualified personnel.
Q9: What happens if a fiber optic cable is damaged inside the switchgear?
If a fluorescence optical fiber is severed or severely bent beyond its minimum bend radius, the affected channel in the demodulator will report a sensor fault alarm — it will not silently report a false temperature reading. The monitoring software flags the channel as offline and generates a maintenance notification. The fault is localized to the specific channel, and all other channels in the system continue monitoring normally and independently. Fiber repair is typically straightforward: damaged fiber is replaced by re-routing a new fiber length through the same cable path and reconnecting the probe, a task that can be performed without de-energizing the switchgear.
Q10: Which power system standards require or recommend busbar temperature monitoring?
IEC 62271-1 and IEC 62271-200 define maximum permissible temperature rises for switchgear busbars and enclosed busbar systems, providing the thermal limit benchmarks against which monitoring alarm thresholds are set. NFPA 70B recommends continuous condition monitoring for electrical equipment as the preferred maintenance strategy. NFPA 70E addresses arc flash risk reduction, supporting the use of monitoring systems that reduce the probability of arc flash initiation. IEEE C37.20.1 and C37.20.2 apply in North American markets. Additionally, many industry-specific standards for data centers, healthcare facilities, and hazardous area electrical installations reference continuous monitoring as a risk control measure for critical power distribution equipment.
Disclaimer
The information in this article is provided for general educational purposes only and does not constitute professional electrical engineering advice or a design specification for any particular installation. All electrical systems including busbars, switchgear, and monitoring equipment must be designed, installed, commissioned, and maintained by qualified electrical engineers in compliance with applicable national and local codes and standards. Fuzhou Innovation Electronic Scie&Tech Co., Ltd. and its affiliates accept no liability for any loss, damage, injury, or consequential outcome arising from the use or misuse of information contained herein. Always consult a certified electrical professional before making decisions affecting electrical safety or system design.

Fiber optic temperature sensor, Intelligent monitoring system, Distributed fiber optic manufacturer in China
 |
|
 |