 INNO fibre optic temperature sensors ,temperature monitoring systems.
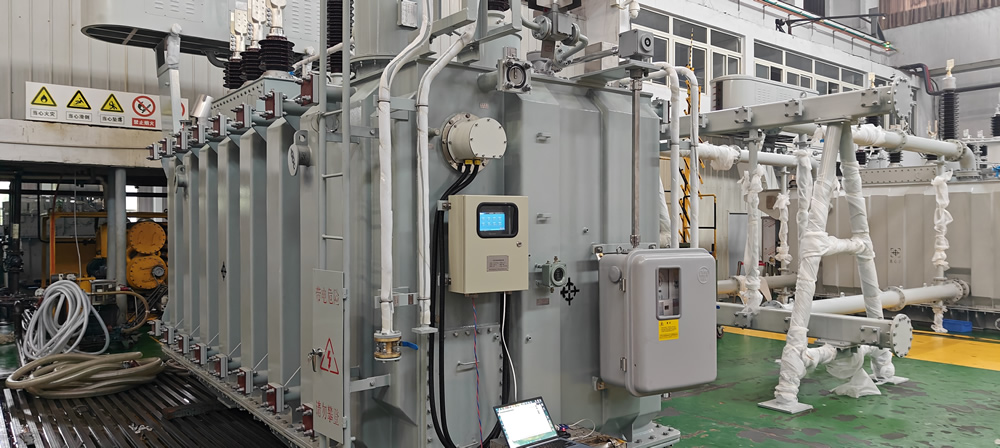
- Transformer online monitoring systems track 10+ critical parameters in real-time, providing 6-12 months early warning of potential failures with over 95% accuracy
- Fiber optic temperature monitoring, dissolved gas analysis (DGA), and partial discharge detection form the three core technologies for comprehensive transformer health assessment
- Fluorescent fiber optic temperature sensors deliver ±1°C accuracy with complete electromagnetic immunity, operating reliably in voltage environments up to 100kV
- Multi-point temperature profiling enables precise hot spot detection with 4-16 measurement points depending on transformer size and criticality
- System investment typically achieves ROI within 2-3 years through extended asset life (20-30% increase), reduced downtime, and optimized maintenance scheduling
- Full compliance with IEC 61850, IEEE C57.91, and Modbus protocols ensures seamless integration with existing SCADA infrastructure
- Applicable to oil-filled transformers, dry-type transformers, distribution transformers, and power transformers across industrial, utility, and transit applications
- Cloud-based monitoring platforms combined with edge computing enable remote diagnostics, trend analysis, and condition-based maintenance strategies
Table of Contents
- Transformer Online Monitoring System Architecture and Components
- Multi-Parameter Sensor Configuration for Power Transformers
- Temperature Monitoring Technologies for Transformers
- Hot Spot Temperature Monitoring and Thermal Analysis
- Oil Temperature Monitoring and Thermal Gradient Analysis
- Temperature Sensor Installation and Placement Strategy
- Temperature Rise Analysis and Thermal Aging Assessment
- Dissolved Gas Analysis (DGA) Monitoring System
- Partial Discharge Online Detection Technology
- Vibration and Acoustic Monitoring System
- Current and Load Monitoring Solutions
- Data Acquisition and Communication Protocol Configuration
- Monitoring Platform Features and Data Analysis
- Predictive Maintenance Strategy Implementation
- Distribution Transformer Monitoring Solutions
- Dry Type Transformer Condition Monitoring
- System Integration and Deployment Implementation
- Standards and Compliance Requirements
- Global Application Cases and Industry Examples
- Fluorescent Fiber Optic Temperature Measurement Applications
- Why Choose Our Monitoring Solutions
- Frequently Asked Questions
- Contact for Customized Solutions
1. Transformer Online Monitoring System Architecture and Components
1.1 Four-Layer System Architecture
Modern transformer online monitoring systems employ a hierarchical architecture consisting of sensor layer, data acquisition layer, communication layer, and application layer. This design ensures reliable transformer remote monitoring while maintaining system flexibility and scalability.
1.2 Sensor Layer Components
The sensor layer integrates multiple transformer monitoring equipment types including fiber optic temperature sensors, transformer vibration sensors, transformer current monitoring sensors, and gas detection units. Each sensor provides continuous data streams for comprehensive asset health assessment.
1.3 Edge Computing Units
Local processing units perform real-time data validation, preliminary analysis, and alarm generation. This distributed intelligence reduces network bandwidth requirements while enabling immediate response to critical conditions in power transformer operations.
1.4 Cloud Platform Integration
The transformer IoT system connects field devices to centralized cloud platforms, enabling multi-site monitoring, advanced analytics, and mobile access. This architecture supports smart transformer monitoring across entire electrical networks.
2. Multi-Parameter Sensor Configuration for Power Transformers
2.1 Essential Monitoring Parameters
| Parameter Category | Measurement Points | Sensor Type | Update Frequency |
|---|---|---|---|
| Thermal Monitoring | Winding hot spot, top oil, bottom oil | Fiber optic temperature sensors | 1-60 seconds |
| Electrical Parameters | Load current, voltage, power factor | Current transformers, voltage sensors | Real-time |
| Oil Quality | Dissolved gases (H2, CH4, C2H2, etc.) | DGA analyzer | 15-60 minutes |
| Mechanical Condition | Tank vibration, winding stability | Accelerometers | Continuous |
| Partial Discharge | UHF signals, acoustic emissions | UHF sensors, acoustic arrays | Continuous |
| Auxiliary Systems | Oil level, moisture, cooling efficiency | Level gauges, humidity sensors | 5-15 minutes |
2.2 Sensor Selection Matrix
For oil filled transformer applications, the sensor configuration emphasizes thermal and oil quality monitoring. Dry type transformer systems focus on winding temperature and environmental conditions. Distribution transformer monitoring typically implements reduced parameter sets optimized for cost-effectiveness.
2.3 Redundancy and Reliability Design
Critical measurement points employ dual sensors to ensure continuous monitoring capability. The transformer digital monitor system validates sensor health and automatically switches to backup channels when primary sensors fail.
3. Temperature Monitoring Technologies for Transformers

3.1 Why Temperature Monitoring is Critical for Transformer Life

Temperature directly governs insulation aging rates in electrical transformer systems. According to the Arrhenius equation, every 8°C increase above rated temperature doubles the aging rate. Accurate transformer temperature monitoring enables precise life assessment and loading optimization.
3.2 Fiber Optic Temperature Sensors vs Traditional Methods
| Technology | Accuracy | EMI Immunity | Voltage Withstand | Lifespan |
|---|---|---|---|---|
| Fluorescent Fiber Optic | ±1°C | Complete | 100kV+ | 20+ years |
| Thermocouples | ±2-5°C | Poor | Limited | 5-10 years |
| RTD Sensors | ±0.5-2°C | Moderate | Requires isolation | 10-15 years |
| Thermal Calculation | ±10-15°C | N/A | N/A | N/A |
Fiber optic temperature measurement eliminates electromagnetic interference issues that plague conventional sensors in high-voltage environments, making it the preferred choice for industrial transformer critical applications.
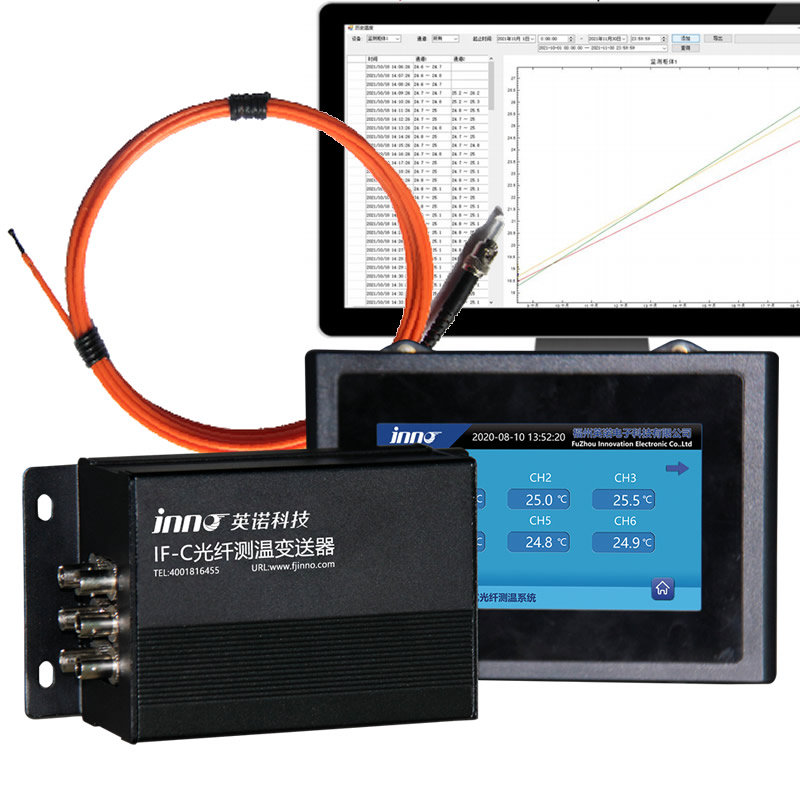
3.3 Fluorescent Fiber Optic Temperature Measurement Systems

Fluorescent optical temperature sensor technology measures temperature through fluorescence decay time. When excited by specific wavelength light, rare earth materials at the probe tip emit fluorescence. The decay time of this fluorescence afterglow varies predictably with temperature, enabling precise measurement.
3.3.1 Operating Principle
The system transmits excitation light through quartz fiber to the sensing tip containing fluorescent material. Temperature-dependent fluorescence decay time is measured with microsecond precision, providing immunity to fiber bending, connector losses, and light source intensity variations.
3.3.2 Technical Specifications
- Temperature range: -40°C to +260°C (customizable to higher ranges)
- Measurement accuracy: ±1°C (±0.5°C available)
- Response time: <1 second
- Fiber diameter: 2.5mm (smaller sizes available)
- High voltage withstand: 100kV
- Fiber length: Customizable 0-20 meters
3.4 Fiber Bragg Grating (FBG) Multi-Point Monitoring
FBG-based systems enable multiple temperature measurement points along a single optical fiber. Wavelength shifts in reflected light from periodic refractive index variations provide temperature data. This technology supports quasi-distributed sensing with 4-16 points per fiber.
3.4.1 Advantages for Large Transformers
For power transformer units exceeding 100 MVA, FBG arrays provide comprehensive thermal mapping. Single fiber runs reduce installation complexity while capturing temperature profiles across winding height and radial positions.
3.5 Winding Hot Spot Temperature Detection Technology
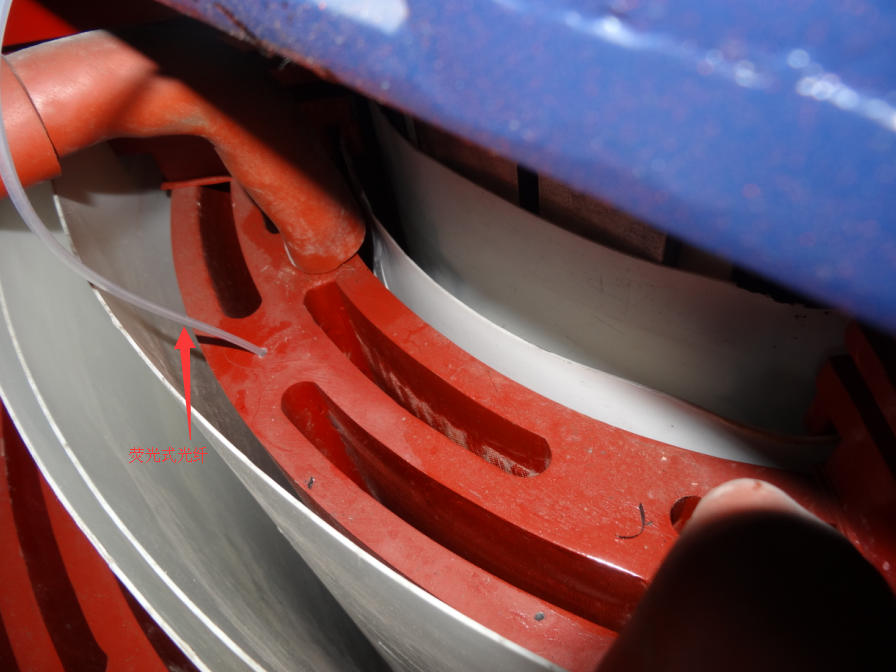
Direct hot spot measurement requires sensor placement at the innermost winding layers where maximum temperature occurs. Transformer winding hot spot temperature monitoring during manufacturing embeds sensors optimally, while retrofit installations utilize access points created during maintenance outages.
4. Hot Spot Temperature Monitoring and Thermal Analysis
4.1 Hot Spot Temperature Determination Methods
Two primary approaches exist for hot spot temperature monitoring: direct measurement using embedded fiber optic temperature sensors and indirect calculation using thermal models. Direct measurement provides superior accuracy (±1°C) compared to calculation methods (±10-15°C).
4.2 Direct Measurement vs Thermal Calculation Comparison
IEEE C57.91 thermal models estimate hot spot temperature from top oil temperature, load current, and transformer-specific thermal time constants. While suitable for loading guides, these calculations cannot detect localized heating from internal faults or cooling system degradation that direct transformer temperature sensor monitoring reveals immediately.
4.3 Multi-Point Temperature Profiling in Windings
Advanced monitoring systems deploy 4-8 sensors per winding to capture thermal gradients. This profiling identifies:
- Axial temperature distribution (top, middle, bottom sections)
- Radial gradients between inner and outer winding layers
- Phase imbalance indicating unequal loading or cooling issues
- Transient thermal responses during load changes
4.4 Real-Time Hot Spot Temperature Tracking Systems
Continuous monitoring at 1-second intervals enables dynamic thermal analysis. The transformer IoT system processes temperature trends to detect abnormal heating rates, predict thermal equilibrium points, and calculate time-to-alarm under emergency loading conditions.
4.5 Hot Spot Temperature Alarm Configuration
| Alarm Level | Temperature Threshold | Action Required | Typical Response |
|---|---|---|---|
| Advisory | 95°C (oil-filled), 130°C (dry-type Class F) | Review loading, check cooling | Notification only |
| Warning | 110°C (oil-filled), 155°C (dry-type Class F) | Reduce load, inspect system | Alarm + logging |
| Critical | 130°C (oil-filled), 180°C (dry-type Class H) | Emergency load reduction | Multiple alarms + control actions |
| Emergency Trip | 140°C (oil-filled), 200°C (dry-type) | Immediate shutdown | Circuit breaker trip |
5. Oil Temperature Monitoring and Thermal Gradient Analysis

5.1 Top Oil Temperature Measurement
Top oil temperature serves as a key reference parameter for oil filled transformer thermal management. Traditional winding temperature indicators (WTI) simulate winding temperature by heating elements in the top oil, but direct fiber optic temperature monitoring of both oil and windings provides superior accuracy.
5.2 Bottom Oil Temperature and Temperature Gradient
The difference between top and bottom oil temperatures indicates oil circulation effectiveness. Typical gradients range from 5-15°C under normal cooling operation. Increasing gradients suggest cooling system degradation or blocked oil passages requiring investigation.
5.3 Oil Temperature Distribution Pattern Analysis
Multi-point oil temperature monitoring reveals:
- Vertical stratification indicating natural convection patterns
- Asymmetric distributions suggesting cooling system imbalance
- Localized hot zones near high-loss components
- Cooling effectiveness across different load conditions
5.4 Cooling System Efficiency Evaluation
By correlating oil temperature rise with cooling fan/pump operation, the monitoring system assesses cooling effectiveness. Degraded heat transfer coefficients indicate fouled radiators, reduced oil flow, or fan motor issues requiring maintenance.
5.5 Oil Circulation Status Monitoring
Temperature response times to load changes indicate oil circulation health. Prolonged thermal time constants suggest restricted flow, while rapid temperature rises may indicate pump failures in forced-oil-cooled transformers.
6. Temperature Sensor Installation and Placement Strategy
6.1 Oil-Immersed Transformer Sensor Positioning
For power transformer applications, optimal sensor placement includes:
- Primary hot spot: Top layer of HV winding innermost turn
- Secondary points: LV winding top, mid-winding positions
- Oil measurements: Top oil pocket, bottom sump, radiator inlet/outlet
- Core monitoring: Core top surface (when accessible)
6.2 Dry Type Transformer Temperature Monitoring Point Selection
For dry type transformer units, direct winding access enables surface-mounted sensors at:
- Winding hottest spot (typically top center of LV winding)
- Phase windings for balance verification
- Core laminations near high-flux regions
- Ambient air temperature (inlet and outlet)
6.3 Sensor Quantity Configuration Guide
| Transformer Rating | Winding Sensors | Oil Sensors | Total Points | Application Type |
|---|---|---|---|---|
| < 1 MVA (Distribution) | 1-2 | 1-2 | 2-4 | Distribution transformer |
| 1-10 MVA | 2-4 | 2-3 | 4-7 | Medium power transformer |
| 10-100 MVA | 4-8 | 3-4 | 7-12 | Large electrical transformer |
| > 100 MVA | 8-16 | 4-6 | 12-22 | Critical industrial transformer |
6.4 Fiber Optic Sensor Routing Solutions
Fiber routing through transformer tank requires hermetic sealing to maintain oil integrity. Common methods include:
- Dedicated fiber optic feedthroughs with compression fittings
- Integration with existing cable bushings
- Tank-mounted junction boxes for external fiber connections
- Dual-path routing for critical sensors ensuring redundancy
6.5 Sealing and Protection Measures
All penetrations maintain transformer oil containment and moisture barriers. Fiber optic cables utilize Teflon protective sleeves rated for continuous 200°C operation. Tank entry points employ elastomeric seals compatible with mineral oil and ester fluids.
7. Temperature Rise Analysis and Thermal Aging Assessment
7.1 Temperature Rise Characteristic Curve Analysis
The monitoring system records thermal response to load variations, generating characteristic curves that reveal:
- Thermal time constants for oil and windings
- Ultimate temperature rise at steady-state conditions
- Cooling effectiveness across load ranges
- Deviations from nameplate thermal performance
7.2 Temperature-Based Aging Rate Calculation
Following IEEE and IEC standards, the system calculates insulation aging acceleration factor based on actual hot spot temperatures. The relative aging rate equation:
Aging Rate = e^[(15000/383) – (15000/(273+θ_HS))]
where θ_HS is the hot spot temperature in °C. This enables accurate transformer life assessment based on actual operating conditions rather than assumptions.
7.3 Insulation Life Loss Evaluation
Cumulative life consumption tracking integrates aging rates over time, accounting for load cycling and temperature variations. The transformer digital monitor displays remaining life percentage and projects end-of-life dates under current loading practices.
7.4 Thermal Accumulation Effect Monitoring
Short-duration overloads may be permissible if followed by cooling periods. The monitoring system tracks thermal accumulation to ensure cumulative effects remain within safe limits per IEEE C57.91 emergency loading guidelines.
7.5 Remaining Life Prediction Models
Statistical models correlate temperature history with insulation degradation markers from oil analysis. Machine learning algorithms refine predictions based on fleet-wide data, improving accuracy of maintenance timing and replacement planning.
8. Dissolved Gas Analysis (DGA) Monitoring System

8.1 Online DGA Technology Overview
Continuous transformer oil monitoring detects fault gases (H2, CH4, C2H2, C2H4, C2H6, CO, CO2) at ppm levels. Online analyzers use gas chromatography or photoacoustic spectroscopy to track dissolved gas concentrations without manual sampling.
8.2 Key Gases and Fault Indicators
- Hydrogen (H2): Corona, partial discharge
- Acetylene (C2H2): High-energy arcing (>700°C)
- Ethylene (C2H4): Overheating above 300°C
- Methane (CH4): Low-temperature thermal faults
- Carbon monoxide (CO): Cellulose degradation
8.3 Diagnostic Methods
The system applies multiple interpretation techniques:
- Rogers Ratio Method: Ratios of key gas pairs classify fault types
- Duval Triangle: Graphical representation for fault identification
- IEC 60599 Method: Comprehensive fault classification system
- Rate of Rise Analysis: Detects developing faults through gas generation rates
8.4 Trending and Alarm Thresholds
Absolute concentrations and rate-of-change thresholds trigger alarms. Trending algorithms differentiate normal aging from active faults, reducing false alarms while maintaining sensitivity to emerging problems.
9. Partial Discharge Online Detection Technology
9.1 PD Monitoring Technologies

Transformer partial discharge monitor systems employ multiple sensing methods:
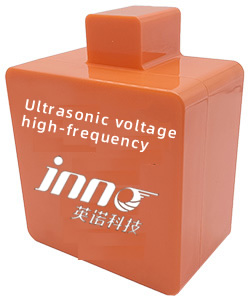
- UHF (Ultra-High Frequency): Electromagnetic waves from PD events (300 MHz – 3 GHz)
- Acoustic sensors: Ultrasonic emissions detected by piezoelectric transducers
- High-frequency current transformers: Electrical pulse detection
- Dissolved gas (H2) tracking: Chemical byproducts of partial discharge
9.2 UHF and Acoustic Sensor Arrays
Multiple sensors installed on tank surfaces enable triangulation of discharge sources. Sensor arrays distinguish between internal PD and external interference, improving detection reliability in noisy electrical environments.
9.3 Pattern Recognition and Localization
Advanced algorithms classify PD patterns (corona, surface discharge, internal void discharge) and locate sources within the transformer. Time-difference-of-arrival calculations from sensor arrays provide spatial coordinates for targeted inspections.
9.4 Integration with Other Parameters
Correlating PD activity with temperature, loading, and DGA data provides comprehensive insulation condition assessment. Simultaneous increases in PD magnitude and hydrogen generation indicate progressive insulation deterioration requiring immediate attention.
10. Vibration and Acoustic Monitoring System
10.1 Vibration Sensor Installation
Transformer vibration sensor placement on tank walls and core supports captures mechanical condition indicators. Accelerometers measure vibration amplitude and frequency across the audible and ultrasonic ranges (20 Hz – 100 kHz).
10.2 Frequency Spectrum Analysis
Spectral analysis identifies characteristic frequencies:
- 100/120 Hz: Core magnetostriction (fundamental + second harmonic)
- Load-dependent frequencies: Winding electromagnetic forces
- Cooling system frequencies: Fan, pump, and oil flow signatures
- Anomalous frequencies: Loose parts, winding movement
10.3 Winding Clamping Assessment
Changes in vibration patterns indicate winding movement or clamping structure loosening. Frequency response analysis (FRA) combined with vibration monitoring detects mechanical deformation from short-circuit forces or shipping damage.
10.4 Cooling System Monitoring
Transformer noise monitoring verifies proper operation of fans, pumps, and radiator valves. Bearing wear and cavitation produce distinctive acoustic signatures enabling predictive maintenance of auxiliary equipment.
11. Current and Load Monitoring Solutions
11.1 Current Transformer Integration
Transformer current monitoring sensor systems measure per-phase loading using current transformer secondaries or Rogowski coils. High-accuracy measurements (0.2% class or better) enable precise thermal calculations and loading optimization.
11.2 Load Profile Analysis
Continuous load recording creates historical profiles showing:
- Daily and seasonal loading patterns
- Peak demand periods and duration
- Load factor and utilization rates
- Overload frequency and magnitude
11.3 Overload Management
The system calculates permissible emergency loading based on actual temperature measurements, ambient conditions, and pre-load thermal state. This enables safe temporary overloads while preventing insulation damage.
11.4 Power Factor and Harmonics
Power quality monitoring identifies capacitive/inductive loading conditions and harmonic content. High harmonic currents increase losses and temperatures, factors incorporated into thermal models and life assessment calculations.
12. Data Acquisition and Communication Protocol Configuration
12.1 Sampling Rates and Resolution
Different parameters require varying update frequencies:
- Thermal parameters: 1-60 seconds (adjustable based on thermal time constants)
- Electrical parameters: Real-time (sub-second for transient capture)
- DGA: 15-60 minutes (sufficient for gas diffusion rates)
- Vibration/PD: Continuous waveform capture with event triggering
12.2 Protocol Selection Guide
| Protocol | Application | Advantages | Typical Use |
|---|---|---|---|
| IEC 61850 | Substation automation | Standardized object models, interoperability | Utility power transformer integration |
| Modbus RTU/TCP | Industrial control | Simplicity, wide support | Industrial transformer monitoring |
| OPC UA | Enterprise systems | Security, platform independence | Multi-site monitoring platforms |
| DNP3 | Utility SCADA | Event reporting, time synchronization | Grid-connected transformers |
| MQTT | IoT applications | Lightweight, cloud-friendly | Transformer IoT system deployments |
12.3 Cybersecurity Measures
Protection against cyber threats includes:
- Network segmentation isolating monitoring systems from corporate networks
- Encrypted communications (TLS/SSL) for data transmission
- Role-based access control and authentication
- Regular security updates and vulnerability patching
- Intrusion detection systems monitoring network traffic
12.4 Remote Access Configuration
Transformer remote monitoring enables off-site diagnostics through secure VPN connections. Multi-factor authentication and session logging ensure accountability while providing necessary access for emergency response and expert consultation.
13. Monitoring Platform Features and Data Analysis
13.1 Real-Time Display Interfaces
Web-based dashboards present current status with customizable layouts showing temperature trends, alarm status, and key performance indicators. Color-coded status indicators enable rapid assessment of fleet-wide transformer health.
13.2 Historical Data Management
Long-term data storage (10+ years typical) supports trend analysis and regulatory compliance. Efficient data compression maintains full-resolution records for critical parameters while summarizing less critical data.
13.3 Automated Reporting Functions
Scheduled reports generate compliance documentation, performance summaries, and maintenance recommendations. Customizable templates adapt to utility, industrial, and regulatory reporting requirements.
13.4 Mobile App Access
Smartphone applications provide alarm notifications, real-time data viewing, and basic control functions. Emergency response personnel receive immediate alerts with sufficient detail for informed decision-making.
14. Predictive Maintenance Strategy Implementation
14.1 Health Index Calculation
Transformer predictive maintenance strategies utilize multi-parameter health indices combining thermal, electrical, chemical, and mechanical indicators. Weighted algorithms produce overall health scores (0-100%) guiding maintenance priorities.
14.2 Remaining Life Estimation
Temperature-based aging models combine with oil quality trends and loading history to project remaining service life. Conservative estimates ensure reliable operation while optimizing asset replacement timing.
14.3 Maintenance Scheduling Optimization
Condition-based transformer maintenance schedule approaches replace fixed-interval servicing. Maintenance occurs when indicators reach thresholds rather than arbitrary time periods, reducing costs while improving reliability.
14.4 Cost-Benefit Analysis
The monitoring system quantifies avoided failures, extended asset life, and optimized loading benefits. Typical ROI analysis shows payback within 2-3 years for critical transformers, with lifetime savings exceeding initial investment by 5-10x.
15. Distribution Transformer Monitoring Solutions
For distribution transformer applications, cost-optimized monitoring systems focus on essential parameters:
| Parameter | Monitoring Method | Value Proposition |
|---|---|---|
| Top Oil Temperature | Single fiber optic sensor | Overload protection, life assessment |
| Load Current | CT integration or clamp sensors | Utilization tracking, capacity planning |
| Basic DGA (H2, C2H2) | Simplified gas detector | Fault detection at lower cost |
| Ambient Temperature | External sensor | Loading correction factor |
Wireless communication options reduce installation costs in remote locations. Battery-powered systems with solar charging enable monitoring where AC power is unavailable.
16. Dry Type Transformer Condition Monitoring

Dry type transformer monitoring emphasizes thermal parameters given the absence of oil indicators. Key differences include:
- Direct winding surface temperature measurement using embedded or surface-mounted fiber optic temperature sensors
- Enclosure temperature and ventilation air flow monitoring
- Partial discharge detection adapted for air/resin insulation systems
- Acoustic monitoring for winding movement and core vibration
Installation simplicity with sensors applied during maintenance windows without oil drainage requirements. Typical 4-8 channel systems provide comprehensive monitoring at moderate cost.
17. System Integration and Deployment Implementation
17.1 New Installation vs Retrofit
Factory-installed monitoring (new transformers) offers optimal sensor placement and integration. Retrofit projects achieve 80-90% of new installation benefits with careful planning and execution during scheduled outages.
17.2 Installation Requirements
| Installation Type | Outage Required | Duration | Special Requirements |
|---|---|---|---|
| External sensors only | No (partial) | 4-8 hours | Panel space, communication infrastructure |
| Oil sensors (retrofit) | Yes (full) | 2-5 days | Oil processing, vacuum capabilities |
| Winding sensors (retrofit) | Yes (extended) | 5-10 days | Tank opening, specialized tools, factory support |
| Complete system (new unit) | N/A | Factory integration | Procurement lead time coordination |
17.3 Commissioning Procedures
Systematic testing verifies sensor operation, communication paths, and alarm functions. Baseline measurements establish normal operating signatures for future comparison.
17.4 System Validation
Acceptance testing confirms measurement accuracy through comparison with calibrated reference instruments. Protocol compliance testing ensures proper SCADA integration before final acceptance.
18. Standards and Compliance Requirements
18.1 Applicable International Standards
- IEC 60076-7: Loading guide for mineral-oil-immersed power transformers
- IEEE C57.91: Guide for loading mineral-oil-immersed transformers and step-voltage regulators
- IEC 60599: Mineral oil-filled electrical equipment in service – Guidance on the interpretation of dissolved and free gases analysis
- IEEE C57.104: Guide for the interpretation of gases generated in mineral oil-immersed transformers
- IEC 61850: Communication networks and systems for power utility automation
18.2 Quality Certifications
Monitoring equipment should carry relevant certifications including ISO 9001 quality management, CE marking for European markets, and UL/CSA approval for North American applications.
18.3 Interoperability Standards
Open protocol implementation ensures multi-vendor compatibility. IEC 61850 certification testing verifies interoperability with different manufacturer equipment and SCADA systems.
19. Global Application Cases and Industry Examples
19.1 Utility Power Generation Applications
Large power plants deploy comprehensive monitoring across generator step-up (GSU) transformers rated 100-500 MVA. Multi-point fiber optic temperature monitoring combined with DGA and PD detection prevents catastrophic failures in critical generation assets. Case studies demonstrate 99.9%+ availability improvement and 15-year life extension through optimized loading and predictive maintenance.
19.2 Urban Rail Transit Systems
Metro and light rail networks utilize online monitoring for traction power transformer reliability. Temperature, vibration, and partial discharge monitoring ensure continuous operation during revenue service. Systems installed in 60+ cities worldwide provide 24/7 surveillance of transformers in substations with limited physical access.
19.3 Industrial Manufacturing Facilities
Industrial transformer monitoring in steel mills, chemical plants, and manufacturing operations prevents production disruptions. High-temperature applications benefit from fluorescent fiber optic temperature sensors rated to 240°C, while harsh environments leverage EMI immunity of optical sensing technology.
19.4 Renewable Energy Integration
Wind farms and solar installations employ monitoring systems on collector transformers experiencing frequent load cycling. Dynamic thermal analysis enables maximum energy capture while preventing overheating during peak generation periods.
19.5 Data Center Critical Infrastructure
Mission-critical data centers require 100% transformer uptime. Redundant monitoring systems with dual sensors and communication paths ensure continuous surveillance. Integration with building management systems enables automated load transfer before transformer failures occur.
19.6 Oil & Gas Offshore Platforms
Remote offshore installations benefit from transformer remote monitoring reducing costly maintenance visits. Wireless communication via satellite links provides real-time data to onshore control centers, enabling condition-based maintenance scheduling during planned shutdowns.
20. Fluorescent Fiber Optic Temperature Measurement Applications

20.1 Medical Applications
Medical fiber optic temperature sensors provide patient-safe monitoring in MRI environments and RF ablation procedures. Complete electromagnetic immunity eliminates interference with imaging equipment while preventing patient burns from induced currents in metallic sensors. Applications include:
- Hyperthermia cancer treatment monitoring
- Cardiac ablation temperature control
- MRI-compatible patient monitoring
- Pharmaceutical manufacturing process control
20.2 Transformer Monitoring Systems
Fluorescent fiber optic sensors in transformer applications deliver superior reliability in high-voltage environments. The intrinsic safety and longevity of optical sensing makes it the preferred technology for:
- Oil-filled transformer winding hot spot detection
- Multi-point thermal profiling in large power transformers
- Generator transformer monitoring at 500kV+ voltage levels
- Traction transformer applications with dynamic loading
20.3 Dry Type Transformer Applications
Intelligent monitoring systems for dry-type transformers integrate fluorescent temperature sensors with comprehensive condition monitoring. The PHM (Prognostic Health Management) platform combines:
- 6-channel fiber optic winding temperature measurement
- Partial discharge detection and localization
- Vibration and acoustic monitoring
- Environmental temperature and humidity tracking
- Fan control and thermal management automation
20.4 Generator Set Monitoring
Fiber optic temperature systems for generator sets monitor stator windings, bearings, and exhaust temperatures. High-temperature variants rated to 300°C withstand turbine exhaust conditions while maintaining measurement accuracy.
20.5 Cable Joint Temperature Monitoring
Cable joint monitoring in ring main units prevents failures in underground distribution networks. Compact sensors installed during cable installation provide early warning of connection degradation before insulation damage occurs.
20.6 Semiconductor Manufacturing
Semiconductor processing equipment utilizes fiber optic sensors for precise thermal control in CVD reactors, plasma etchers, and wafer heating systems. Sub-degree accuracy enables tight process control while EMI immunity prevents interference with RF plasma systems.
20.7 Microwave and RF Heating Applications
Microwave electromagnetic anti-interference systems enable accurate temperature measurement in intense RF fields where conventional sensors fail. Applications include:
- Microwave heating and drying processes
- RF induction heating systems
- Plasma processing chambers
- Industrial microwave food processing
20.8 Laboratory and Experimental Equipment
32-channel experimental equipment monitoring systems support research applications requiring simultaneous multi-point measurement. Customizable channel counts (1-64 channels) adapt to specific research needs in materials testing, thermal analysis, and process development.
20.9 Large-Scale Multi-Point Systems
64-channel fluorescent fiber optic systems provide comprehensive monitoring for complex installations. Applications include distributed sensing in:
- Large industrial furnaces and kilns
- Multi-transformer substations
- Chemical reactor arrays
- Building HVAC optimization
21. Why Choose Our Monitoring Solutions

21.1 Comprehensive Product Portfolio
Our complete range includes:
- Fluorescent fiber optic temperature systems (1-64 channels)
- FBG-based multi-point monitoring solutions
- Integrated transformer digital monitor platforms
- DGA analyzers and transformer partial discharge monitor systems
- Complete smart transformer monitoring packages
21.2 Proven Technology Leadership
As a pioneer in fiber optic temperature monitoring since 2011, we have:
- Deployed systems in 60+ countries across six continents
- Protected over 10,000 transformers worldwide
- Achieved 99.5%+ system uptime across installed base
- Maintained zero critical failure rate in high-voltage applications
21.3 Application Engineering Support
Our technical team provides:
- Customized sensor configuration design
- Thermal modeling and simulation
- Protocol integration assistance
- Commissioning and training services
- 24/7 technical support for critical installations
21.4 Quality and Certifications
All products manufactured under ISO 9001 certified processes with:
- 100% factory testing and calibration
- CE, UL, and CSA safety certifications
- NIST-traceable calibration standards
- Extended warranty programs available
22. Frequently Asked Questions
What parameters should be monitored in oil filled transformer online systems?
Essential parameters for oil filled transformer monitoring include winding hot spot temperature, top oil temperature, dissolved gas concentrations (H2, CH4, C2H2, C2H4, C2H6, CO, CO2), load current, partial discharge activity, and tank vibration. Advanced systems add oil level, moisture content, cooling system status, and bushing temperature monitoring.
How does fiber optic temperature monitoring improve power transformer reliability?
Fiber optic temperature monitoring provides direct hot spot measurement with ±1°C accuracy, enabling precise loading optimization and early detection of cooling system degradation. Unlike calculated temperatures, direct measurement reveals localized heating from internal faults, blocked oil ducts, or winding deformation before catastrophic failure occurs.
Can online monitoring systems be retrofitted to existing distribution transformers?
Yes, distribution transformer retrofit installations are feasible during scheduled maintenance outages. External sensors (current, vibration, acoustic) install without transformer de-energization. Oil and winding sensors require tank opening but achieve 80-90% of new installation monitoring capability. Payback periods of 2-4 years justify retrofit for critical or aging assets.
What is the accuracy of dissolved gas analysis in transformer oil monitoring?
Online DGA systems typically measure gas concentrations with ±10-15% accuracy at ppm levels. While less precise than laboratory analysis, continuous monitoring detects rate-of-change trends reliably. Combined with temperature and electrical monitoring, DGA provides 90%+ fault detection accuracy when properly interpreted using Rogers ratios or Duval analysis methods.
How do partial discharge monitors detect insulation problems in electrical transformers?
Transformer partial discharge monitor systems detect high-frequency electromagnetic pulses or acoustic emissions from electrical discharges in insulation voids, along surfaces, or from sharp points. UHF sensors (300 MHz – 3 GHz) capture electromagnetic signals, while piezoelectric transducers detect ultrasonic waves. Pattern analysis distinguishes PD types and localizes sources for targeted maintenance.
What communication protocols are supported for industrial transformer monitoring integration?
Industrial transformer monitoring systems support multiple protocols including Modbus RTU/TCP (most common), IEC 61850 (utility substations), DNP3 (SCADA integration), OPC UA (enterprise systems), and MQTT (IoT platforms). Multi-protocol gateways enable simultaneous connections to different control systems for maximum flexibility.
How often should transformer vibration sensors be calibrated?
Transformer vibration sensor calibration intervals depend on application criticality and environmental conditions. Typical recommendations are annual verification for critical applications, 2-year intervals for standard installations. Most modern sensors feature built-in self-test capabilities verifying operational status between formal calibrations. Trending analysis detects sensor drift before accuracy degradation affects diagnostics.
What is the typical payback period for transformer online monitoring investment?
ROI analysis shows 2-3 year payback for critical power transformer units valued at $500K-$5M+. Benefits include avoided catastrophic failures ($2M-$10M+ each), extended asset life (20-30% increase worth $100K-$1M+), optimized loading (5-15% capacity increase), and reduced maintenance costs (30-50% savings). Distribution transformers show 3-5 year payback depending on criticality and replacement cost.
Can dry type transformer monitoring systems operate without external power?
Some dry type transformer monitoring systems offer battery backup for continued operation during power outages, maintaining critical alarm functions for 8-72 hours. Solar-powered systems with energy harvesting enable completely autonomous operation in remote locations. Standard systems require 24V DC or 120/240V AC power, often sourced from station batteries or the monitored transformer itself.
How does transformer IoT system enable predictive maintenance?
Transformer IoT system platforms analyze historical data patterns to predict failure modes weeks to months in advance. Machine learning algorithms correlate temperature trends, DGA profiles, and load patterns with known failure signatures. Automated alerts trigger when conditions match developing fault characteristics, enabling proactive intervention before service interruption occurs.
What alarms are included in transformer safety alarm systems?
Transformer safety alarm functions include temperature thresholds (warning, critical, trip), gas generation rate alarms, partial discharge magnitude limits, oil level high/low, moisture content exceedance, cooling system failure, and loss of sensor communication. Multi-level alarming with configurable delays prevents nuisance trips while ensuring safety protection. Integration with circuit breaker controls enables automatic load shedding or shutdown.
How many sensors are needed for current transformer monitoring?
Current transformer monitoring in three-phase systems requires minimum 3 CTs (one per phase) for balanced load applications. Critical installations add neutral current monitoring (4 CTs total) to detect ground faults and unbalanced conditions. Multi-winding transformers need CTs on each winding, with 6-9 CTs typical for dual-secondary configurations. High-accuracy revenue metering may specify redundant CTs.
Does online monitoring affect transformer protection systems operation?
Properly designed monitoring systems operate independently from transformer protection systems, sharing sensor inputs without interfering with protective relay functions. Monitoring typically uses separate CTs or voltage taps with isolated circuits. Some integrated systems combine protection and monitoring in unified platforms, maintaining IEC 61850-compliant separation between critical protection and non-critical monitoring functions.
What data storage capacity is required for transformer remote monitoring?
Transformer remote monitoring systems typically require 1-5 GB per transformer annually for comprehensive data (1-minute sampling). Ten-year retention (regulatory common) needs 10-50 GB per unit. Cloud storage costs are negligible ($1-5/month per transformer). Local edge storage handles 1-3 years with 128-512 GB industrial SSD/SD cards. Data compression and selective archiving reduce requirements by 50-80%.
How reliable are transformer digital monitor systems in harsh environments?
Transformer digital monitor systems designed for outdoor substation deployment withstand -40°C to +70°C ambient temperatures, 100% humidity, and severe electromagnetic interference. NEMA 4X/IP66 enclosures protect electronics from moisture and contaminants. Mean time between failures (MTBF) exceeds 100,000 hours for quality systems. Regular self-diagnostics detect component degradation before functional failure occurs.
What is the lifespan of fiber optic temperature sensors in transformer oil?
Fiber optic temperature sensors in mineral oil typically last 20-25 years matching transformer service life. Fluorescent probe materials maintain calibration stability within ±0.5°C over this period. Quartz fiber withstands continuous 200°C operation without degradation. Ester fluids and silicone oils show similar compatibility. Accelerated aging tests at 150°C demonstrate 30+ year projected lifespan under normal 90-110°C operating conditions.
What is the measurement accuracy of hot spot temperature monitoring systems?
Hot spot temperature monitoring using fluorescent fiber optic sensors achieves ±1°C absolute accuracy and ±0.1°C resolution. This exceeds thermal calculation methods (±10-15°C) and RTD sensors (±2-5°C with installation uncertainties). Direct measurement eliminates assumptions about thermal gradients and cooling effectiveness, providing true hot spot temperature for loading decisions and life assessment calculations.
How should multi-point temperature monitoring systems arrange measurement points?
Multi-point systems optimize sensor placement based on thermal modeling and CFD analysis. Typical configurations place sensors at: (1) HV winding top layer innermost turn (primary hot spot), (2) LV winding hottest predicted location, (3) mid-winding verification points, (4) top oil, (5) bottom oil, (6) core surface when accessible. Large transformers add radial and axial profiling with 12-16 points total, while distribution units use 4-6 strategically placed sensors.
23. Contact for Customized Solutions

Our engineering team provides expert consultation on transformer online monitoring system design, integration, and optimization. We offer:
- Application-specific sensor configuration design
- Custom channel count solutions (1-128 channels)
- Protocol integration for legacy SCADA systems
- Training programs for operations and maintenance staff
- Comprehensive documentation and technical manuals
- Commissioning support and system validation
- Long-term service contracts and spare parts programs
Request detailed specifications, application notes, or quotations:
Primary Manufacturer: Fuzhou Innovation Electronic Scie&Tech Co., Ltd.

| Established | 2011 (13 years of manufacturing experience) |
| Specialization | Fluorescent fiber optic temperature sensors, transformer monitoring systems |
| web@fjinno.net | |
| Phone | +86 13599070393 |
| +86 13599070393 | |
| WeChat (China) | +86 13599070393 |
| 3408968430 | |
| Address | Liandong U Grain Networking Industrial Park, No.12 Xingye West Road, Fuzhou, Fujian, China |
| Website | www.fjinno.net |
| Certifications | ISO 9001, CE, Professional OEM/ODM capabilities |
Partner Manufacturer: Fuzhou Huaguang Tianrui Optoelectronics Technology Co., Ltd.
| Established | 2016 |
| Specialization | Advanced fiber optic sensing solutions, distributed sensing systems |
| Collaboration | Joint development of next-generation monitoring technologies |
| Focus Areas | FBG-based systems, distributed temperature sensing, high-channel-count platforms |
Both manufacturers maintain research partnerships with leading universities and maintain comprehensive quality management systems ensuring consistent product performance and reliability.
Disclaimer
This technical guide provides general information about transformer online condition monitoring systems, technologies, and implementation strategies. Actual system specifications, performance characteristics, and installation procedures vary based on specific transformer designs, operating environments, and application requirements. All transformer monitoring work should be performed by qualified personnel following applicable safety standards, manufacturer guidelines, and local electrical codes.
The information presented does not constitute professional engineering advice for specific installations. Temperature thresholds, alarm settings, and maintenance recommendations must be adjusted based on transformer nameplate ratings, insulation class, cooling methods, and operating conditions. Consult with certified transformer specialists and conduct thorough engineering analysis before implementing monitoring systems on critical assets.
Product specifications, communication protocols, and industry standards referenced are subject to updates and revisions. Always verify current manufacturer specifications and applicable standards before procurement and installation. While monitoring systems significantly improve transformer reliability, they do not eliminate the need for periodic offline testing, oil analysis, and professional inspections per manufacturer and utility requirements.
Performance claims and ROI projections are based on industry studies and field experience but may vary significantly based on transformer condition, operating practices, and maintenance strategies. Economic benefits depend on factors including transformer criticality, replacement cost, outage consequences, and existing maintenance programs. Conduct site-specific cost-benefit analysis before investment decisions.

Fiber optic temperature sensor, Intelligent monitoring system, Distributed fiber optic manufacturer in China
 |
 |
 |