 INNO glasvezel temperatuursensoren ,temperatuurbewakingssystemen.
- Gas insulated switchgear (GIS) concentrates high-voltage components in sealed, SF₆-filled compartments where even a minor insulation defect can escalate into a catastrophic failure with extremely long repair times — making enhanced partial discharge monitoring essential rather than optional.
- UHF (Ultrahoge frequentie) detectie in the 300 MHz–3 000 MHz band is the preferred method for GIS because the metallic enclosure acts as a natural electromagnetic shield, providing exceptional signal-to-noise ratios that other PD detection techniques cannot match in this environment.
- A modern GIS PD monitoring system with 5 pC sensitivity, 4–6 acquisition channels, En 3D PRPD pattern analysis can identify and classify corona, surface, void, and floating-potential discharge — turning raw signals into actionable maintenance decisions.
- Seamless SCADA-integratie via IEC 61850, Modbus, and DNP3 embeds GIS insulation health data into the substation automation layer, enabling condition-based maintenance at fleet scale.
Inhoudsopgave
- Why GIS Demands a Different Approach to Partial Discharge Monitoring
- How PD Occurs Inside Gas Insulated Switchgear — Failure Mechanisms
- Why UHF Is the Superior Detection Method for GIS Partial Discharge
- Core Architecture of an Enhanced GIS PD Monitoring System
- UHF Sensor Specifications That Determine Detection Performance
- Multi-Channel Acquisition Host — Technical Parameters
- PRPD Pattern Analysis — Identifying Discharge Types in GIS
- Backend Software and SCADA Integration
- Installation and Deployment Considerations for GIS Environments
- How to Choose a GIS PD Monitoring System — Selection Criteria
- Veelgestelde vragen (Veelgestelde vragen)
1. Waarom GIS Demands a Different Approach to Partial Discharge Monitoring
Gasgeïsoleerde schakelapparatuur is niet simpelweg een transformator of kabel in een ander pakket; het biedt een fundamenteel andere monitoringuitdaging. Alle actieve componenten — rails, stroomonderbrekers, scheiders, huidige transformatoren, en bussen — zijn ingesloten in geaarde metalen behuizingen gevuld met SF₆-gas onder druk. Deze gesloten architectuur elimineert visuele inspectie, voorkomt directe akoestische koppeling met externe sensoren, en maakt conventionele IEC 60270 elektrische PD-metingen onpraktisch in het veld.
Tegelijkertijd, de gevolgen van een onopgemerkte isolatiefout in GIS zijn onevenredig ernstig. Een storing in een enkel compartiment kan maanden aan reparatie vergen, omdat vervangende onderdelen op maat worden vervaardigd en de gasverwerking plaatsvindt, demontage, en het herinbedrijfstellingsproces is complex en tijdrovend. Voor transmissie-spanning GIS werkend op 110 kV, 220 kV, of 500 kV, the resulting outage can affect grid stability across an entire region. This combination of limited inspectability and high failure consequence is precisely why enhanced online partial discharge monitoring has become a standard requirement for GIS installations worldwide.
2. How PD Occurs Inside Gas Insulated Switchgear — Failure Mechanisms
Partial discharge inside GIS is driven by localised electric field concentrations that exceed the dielectric strength of the SF₆ gas or the solid insulating spacers. Four root causes account for the vast majority of GIS PD events.
Free metallic particles — small conductive fragments left behind during manufacturing or generated by mechanical wear of contacts — are the single most common cause of PD in GIS. These particles can migrate under electrostatic forces, settle on spacer surfaces, or become trapped in high-field regions, creating corona or surface discharge. Contamination on spacer surfaces, whether from moisture, stof, or handling residue, reduces surface flashover voltage and initiates tracking discharge along the solid–gas interface. Voids or delaminations within cast-resin spacers create gas pockets where the breakdown voltage is lower than the surrounding solid, leading to repetitive internal discharge. Floating metallic components — shields, electrodes, or bolts that have lost their electrical connection — acquire an indeterminate potential through capacitive coupling and drive high-energy discharge against adjacent grounded or energised structures.
Each of these mechanisms produces a distinct electromagnetic signature that a properly designed UHF monitoring system can detect, classify, and track over time.
3. Why UHF Is the Superior Detection Method for GIS Partial Discharge
Er bestaan verschillende PD-detectiemethoden: elektrisch (IEC 60270), akoestische emissie, transient earth voltage (TEV), en UHF – maar de fysica van GIS-operaties geeft overweldigend de voorkeur aan de UHF-benadering voor permanente online monitoring.
Wanneer er een gedeeltelijke ontladingspuls optreedt in een GIS-compartiment, het straalt elektromagnetische energie uit over een breed frequentiespectrum. De metalen behuizing van het GIS fungeert als golfgeleider, waardoor UHF-signalen in de 300 MHz–3 000 MHz bereik om zich efficiënt langs het buskanaal te verspreiden met een relatief lage demping. Cruciaal, dezelfde metalen behuizing beschermt UHF-sensoren tegen externe elektromagnetische interferentie: radio-uitzendingen, transiënten schakelen, corona van bovengrondse lijnen – die detectiemethoden met een lagere frequentie in een onderstationomgeving zouden overweldigen. This natural shielding effect gives UHF detection an inherent signal-to-noise advantage that no other method can replicate inside GIS.
By comparison, TEV sensors measure voltage transients on the outer enclosure surface. While useful for portable spot-checks, TEV has lower sensitivity to internal defects, cannot reliably distinguish PD types, and is more susceptible to external noise. Acoustic sensors struggle with the multiple reflections and attenuation paths inside the metal-enclosed gas volume. De IEC 60270 electrical method, though highly accurate in laboratory settings, vereist koppelcondensatoren die onpraktisch zijn om achteraf in te bouwen op operationeel GIS. Voor continu, geïnstalleerde monitoring van GIS, UHF is de duidelijke technische keuze.
4. Core Architecture of an Enhanced GIS PD Monitoring System
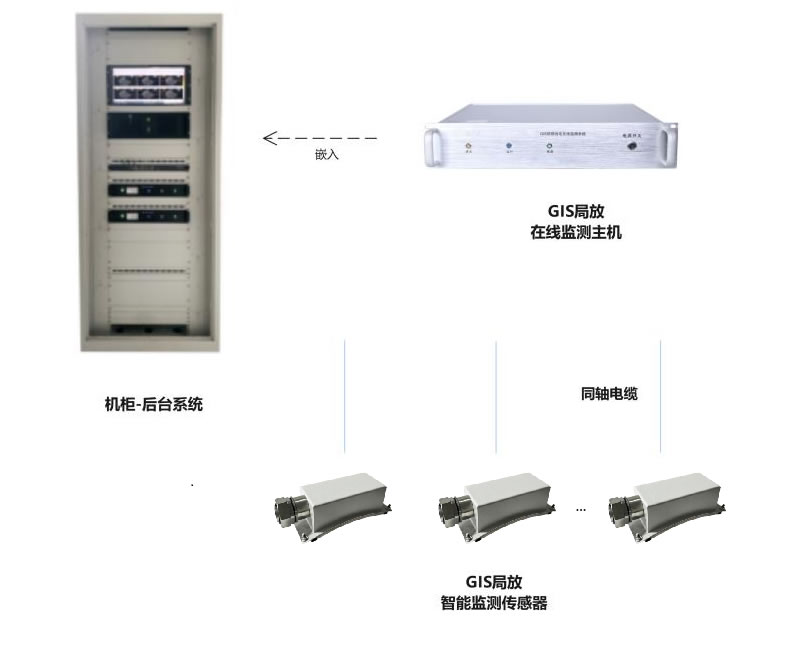
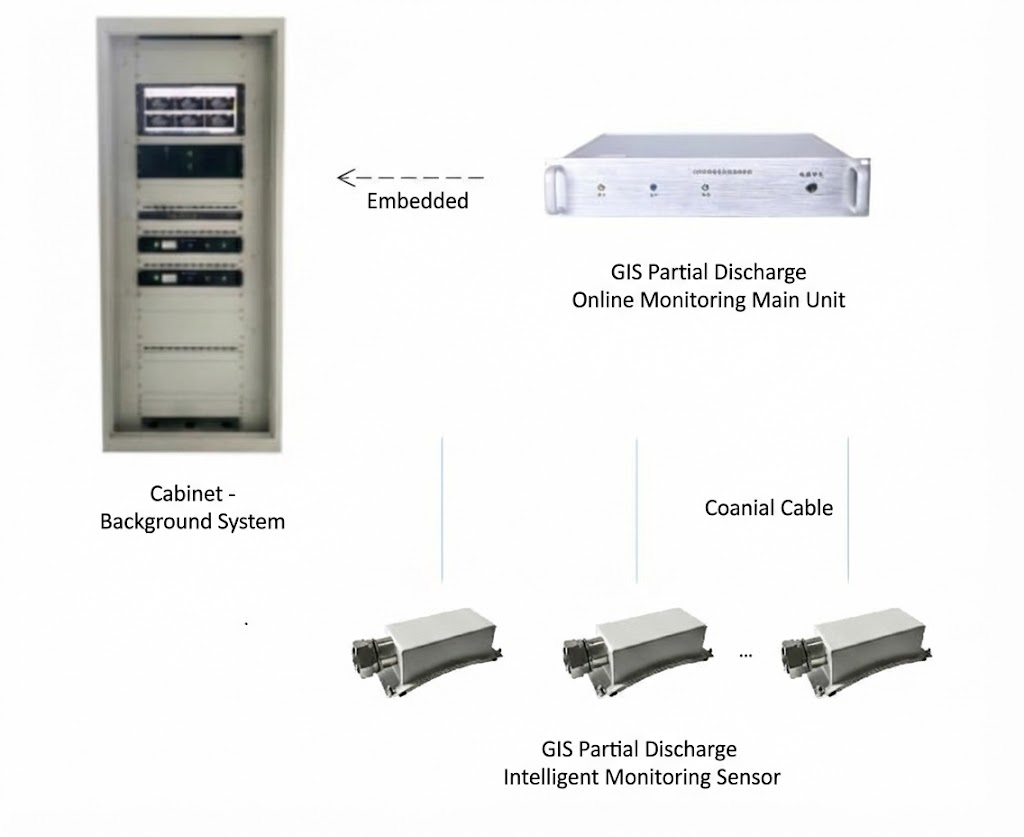
Een complete GIS PD-monitoringinstallatie bestaat uit drie lagen: veld sensoren, een gecentraliseerde acquisitie- en verwerkingshost, en back-end diagnostische software. De architectuur is zo ontworpen dat elke laag een specifieke functie vervult en naadloos communiceert met de volgende.
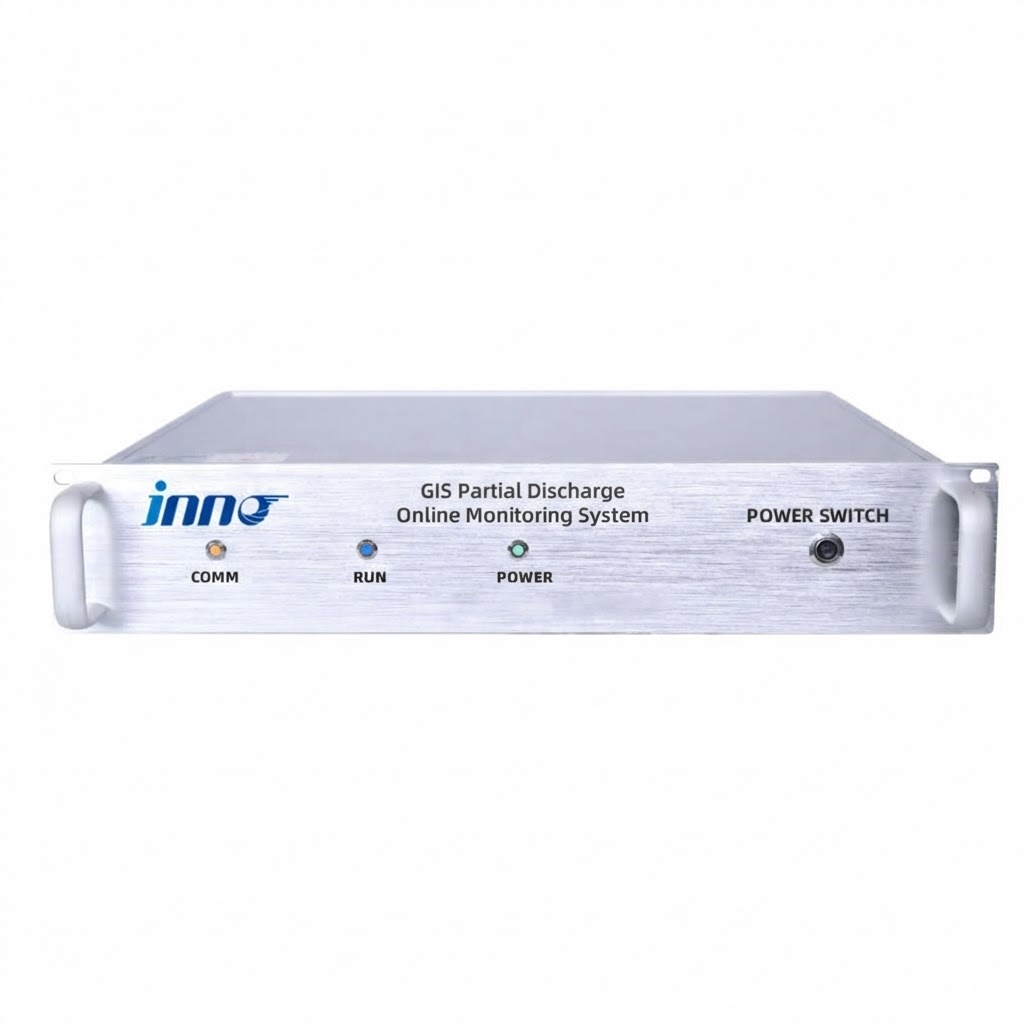
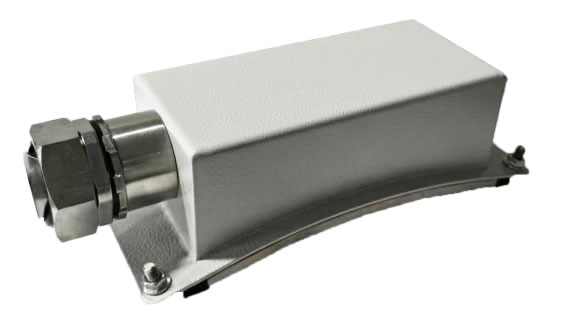
UHF-sensoren worden op strategische punten op het GIS geïnstalleerd, meestal op afstandsverbindingen, kabelafsluitingen, en businterfaces waar PD het meest waarschijnlijk zal ontstaan. Elke sensor vangt de elektromagnetische straling op die wordt geproduceerd door ontladingsgebeurtenissen en verzendt het signaal via een coaxkabel naar de monitoringhost. De acquisitie gastheer, gehuisvest in een 2U rackgemonteerde behuizing, receives signals from multiple sensors simultaneously, performs high-speed digitisation and signal conditioning (demodulatie, noise reduction, versterking), and computes key PD parameters including discharge magnitude, phase angle, and repetition rate. The host then transmits processed data over Ethernet to the backend software platform, die realtime visualisatie biedt, PRPD-patroonanalyse, alarmbeheer, historische trend, en integratie met het SCADA-systeem van het onderstation.
5. UHF Sensor Specifications That Determine Detection Performance
The sensor is the first and most critical link in the detection chain. Its specifications directly determine whether the system can detect incipient PD or only advanced faults. The table below details the key parameters of a high-performance UHF sensor designed specifically for GIS applications.
| Parameter | Specificatie | Waarom het ertoe doet |
|---|---|---|
| Monitoring Frequency Band | 300 – 3 000 MHz | Covers the full UHF range where GIS PD signals propagate most efficiently inside the metallic enclosure |
| Gevoeligheid | 5 PC | Detects very small incipient discharges before they escalate to damaging levels |
| Impedance Matching | 50 Oh | Standard RF impedance ensures maximum power transfer from sensor to coaxial cable with minimal reflection loss |
| VSWR (Voltage Standing Wave Ratio) | ≤ 2 | Low standing wave ratio confirms efficient signal transmission; higher VSWR causes signal degradation and measurement error |
| Directivity | Omnidirectional | Gelijke gevoeligheid in alle richtingen elimineert de noodzaak van nauwkeurige hoekuitlijning tijdens de installatie |
| Output Interface | N-type RF-connector | Industriestandaard connector zorgt voor betrouwbaarheid, herhaalbare verbindingen met lage contactweerstand |
| Coaxiale kabellengte | Standaard 10 M (aanpasbaar) | Geschikt voor typische afstanden tussen GIS en bewakingskast; aangepaste lengtes beschikbaar voor grote installaties |
| Bedrijfstemperatuur | -40 °C tot +85 °C | Ondersteunt inzet in extreme klimaten – van arctische substations tot extreme woestijnomgevingen 50 °C |
| Vochtigheidstolerantie | ≤ 95 % RV | Geschikt voor tropische en kustlocaties met aanhoudend hoge luchtvochtigheid |
The combination of 5 pC-gevoeligheid en een VSWR van ≤ 2 is bijzonder belangrijk. Gevoeligheid bepaalt de kleinste ontlading die het systeem kan detecteren; VSWR bepaalt hoeveel van dat signaal daadwerkelijk de acquisitiehost bereikt zonder langs de kabel te worden teruggekaatst. Een systeem met een hoge aangegeven gevoeligheid maar een slechte VSWR zal een aanzienlijk deel van het gedetecteerde signaal onderweg verliezen, waardoor het gevoeligheidsvoordeel effectief teniet wordt gedaan.
6. Multi-Channel Acquisition Host — Technical Parameters
De acquisitiehost is de verwerkingskern van het systeem, verantwoordelijk voor de digitalisering, conditionering, en het analyseren van signalen van alle aangesloten sensoren. De onderstaande tabel geeft de kernspecificaties van de monitorende hosteenheid weer.
| Parameter | Specificatie |
|---|---|
| Monitoring Frequency | 300 – 3 000 MHz |
| Aantal kanalen | 4 of 6 (selecteerbaar) |
| Communicatie-interfaces | RJ45-ethernet + RS-485 |
| Ondersteunde protocollen | Modbus RTU / TCP, IEC 61850, DNP3 |
| Voeding | AC 90 – 240 V, 50/60 Hz |
| Behuizing | 2U-rekmontage (483 mm× 89 mm× 300 mm) |
| Beschermingsklasse kast | IP54 |
| Signaalverwerking | Demodulation, isolation, noise reduction, versterking, high-speed acquisition, periodieke meting over meerdere cycli |
| Diagnostische uitgangen | Maximale ontladingsgrootte, average discharge magnitude, ontladingsfrequentie, 3D PRPD-patronen, trend statistics |
The choice between 4 En 6 kanalen zijn afhankelijk van de GIS-configuratie. Een single-bay GIS met drie compartimenten kan volledig worden afgedekt door een 4-kanaals host, while extended bus sections or double-bus arrangements benefit from the additional capacity of a 6-channel unit. The modular channel architecture also means the system can be deployed initially with fewer sensors and expanded later without replacing the host hardware.
7. PRPD Pattern Analysis — Identifying Discharge Types in GIS

Detecting that partial discharge is occurring is only the first step. The real diagnostic value lies in identifying what type of discharge it is, because each type implies a different defect mechanism, a different severity trajectory, and a different maintenance response.
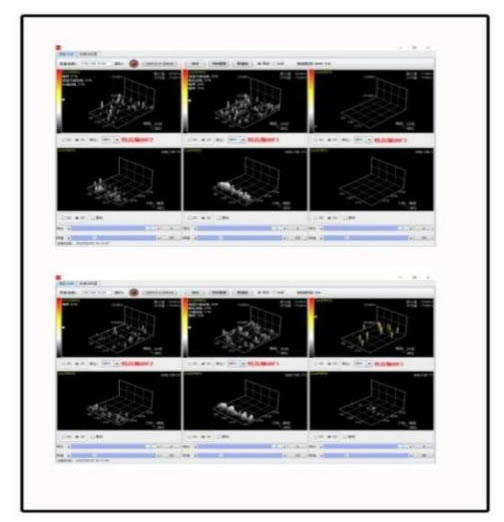
Fase-opgeloste gedeeltelijke ontlading (PRPD) analysis achieves this by mapping each detected PD pulse onto a three-dimensional coordinate system: discharge magnitude on the vertical axis, phase angle of the power-frequency cycle on the horizontal axis, and pulse density represented by colour or height. Over hundreds of power cycles, elk ontladingstype bouwt een karakteristiek patroon op.
Corona van vrije deeltjes concentreert zich doorgaans nabij de spanningspieken van één polariteit, met een relatief lage en uniforme grootte. Oppervlakteontlading op afstandhouders produceert asymmetrische patronen die zich over een breed fasebereik verspreiden, waarbij de omvang toeneemt naarmate de verontreiniging verergert. Internal void discharge binnen het afstandhoudermateriaal genereert het symmetrische patronen op beide halve cycli, met een relatief stabiele magnitude die weinig verandert met de aangelegde spanning. Drijvende potentiaalontlading creëert dichtheid, clusters met een grote omvang die in fasepositie verschuiven naarmate de capacitieve koppeling van de zwevende component verandert met belasting of temperatuur.
De monitoringsoftware vergelijkt gemeten PRPD-patronen met een expertdatabase met bekende GIS-ontladingshandtekeningen. Wanneer er een match is gevonden, the system reports the probable discharge type and recommended action — for example, “free metallic particle detected in compartment B3; recommend inspection at next planned outage” — transforming a complex electromagnetic measurement into a clear maintenance instruction.
8. Backend Software and SCADA Integration
The backend software platform runs on the substation control room computer or on a centralised server for multi-site deployments. It provides four core capabilities: real-time monitoring with 3D PRPD visualisation, historical data query and trend analysis, multi-level alarm management with configurable thresholds, and automated report generation for maintenance planning and regulatory compliance.
For integration into the substation automation layer, the monitoring host supports IEC 61850, Modbus RTU/TCP, En DNP3 natively — no external protocol converters are required. Key data points — real-time PD magnitude, alarmstatusvlaggen, and diagnostic classification codes — are transmitted to the SCADA system, giving dispatchers immediate visibility of GIS insulation health alongside conventional measurements such as bus voltage, belasting stroom, and SF₆ gas pressure. Deze integratie maakt het mogelijk toestandsafhankelijk onderhoud at fleet scale: rather than inspecting every GIS compartment on a fixed calendar schedule, maintenance crews are directed to the specific compartments where the monitoring system has identified active or developing PD.
9. Installation and Deployment Considerations for GIS Environments
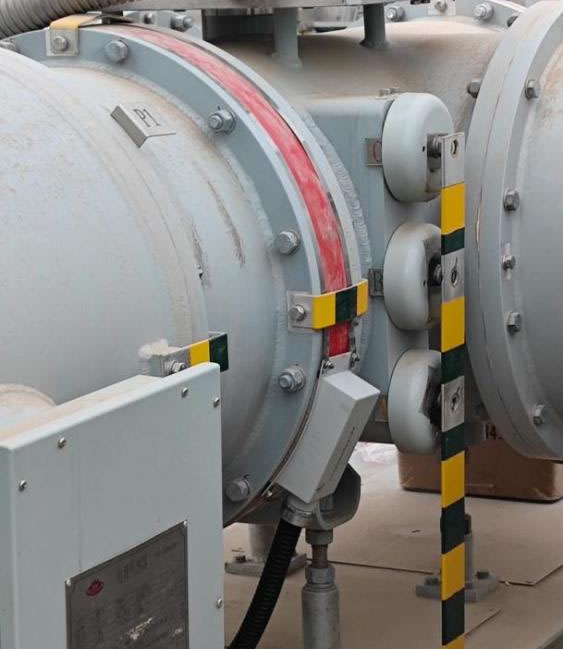
GIS PD monitoring systems are designed for retrofit installation on operational equipment without requiring a GIS outage. UHF sensors are mounted at designated access points on the GIS enclosure — typically at spacer flanges, inspectieluiken, of speciale sensorpoorten geleverd door de GIS-fabrikant. Coaxkabels lopen van de sensoren naar de monitoringkast, Dit kan een op zichzelf staande behuizing met IP54-classificatie zijn, of een paneel in de bestaande relaisruimte.
Several installation practices are critical for reliable performance. Coaxial cables must maintain their minimum bend radius to prevent impedance discontinuities that degrade signal quality. Cable routes should avoid running parallel to high-voltage busbars or power cables to minimise electromagnetic coupling. All equipment grounding connections must be verified, as a poor ground can introduce noise that mimics PD signals. After physical installation, a baseline measurement should be recorded with the GIS in normal service — this baseline becomes the reference against which all future measurements are compared.
A typical installation covering a single GIS bay with 3–4 sensors, one acquisition host, and backend software can be completed in one to two weeks including commissioning, kalibratie, and operator training.
10. How to Choose a GIS PD Monitoring System — Selection Criteria
The market includes products ranging from portable spot-check instruments to full continuous monitoring platforms. The following criteria help buyers match the right solution to their specific GIS asset.
Sensitivity and VSWR
Specify a sensor sensitivity of 5 pC or better and a VSWR of ≤ 2. These two parameters together determine real-world detection capability. A sensor with excellent stated sensitivity but a VSWR of 3 or higher loses a substantial portion of the signal before it reaches the acquisition host.
Frequency Coverage
The full 300–3 000 MHz UHF band should be covered. Some lower-cost systems operate only in a narrow sub-band, which may miss PD signatures that manifest at frequencies outside that window.
Channel Count and Expandability
Choose a system with selectable 4- of 6-kanaalsmogelijkheden en een modulaire architectuur die het toevoegen van sensoren en kanalen mogelijk maakt zonder de hosteenheid te vervangen. Dit beschermt de initiële investering naarmate de GIS-installatie groeit.
Diagnostische intelligentie
Het systeem moet 3D PRPD-patroonweergave bieden met automatische patroonvergelijking met een expertdatabase. Systemen die alleen de ruwe signaalamplitude rapporteren zonder classificatie van het ontladingstype, bieden detectie maar geen diagnose – en diagnose is de drijvende kracht achter effectieve onderhoudsbeslissingen.
Protocol Compatibility
Native ondersteuning voor het communicatieprotocol dat al in het onderstation is geïmplementeerd: IEC 61850, Modbus RTU/TCP, of DNP3 — vermijdt het kosten- en betrouwbaarheidsrisico van het toevoegen van externe converters.
Milieubeoordeling
Sensoren moeten geschikt zijn voor het volledige temperatuur- en vochtigheidsbereik van de locatie. Voor GIS-substations buiten in extreme klimaten, controleer de werking van de sensor vanaf -40 °C tot +85 °C en kastbescherming van minimaal IP54.
Trackrecord van leveranciers
Vraag referentie-installaties aan in vergelijkbare GIS-configuraties en spanningsklassen. Een leverancier met een bewezen geïnstalleerde basis 110 kV, 220 kV, En 500 kV GIS biedt meer vertrouwen in de systeembetrouwbaarheid en technische ondersteuningsmogelijkheden.
11. Veelgestelde vragen (Veelgestelde vragen)
Q1: Wat maakt UHF-detectie beter dan TEV voor GIS-deelafvoermonitoring?
UHF-detectie werkt in de 300–3 000 MHz-bereik en vangt elektromagnetische golven op die zich binnen de afgesloten GIS-behuizing voortplanten, dat fungeert als een natuurlijk schild tegen externe ruis. Dit geeft UHF een superieure signaal-ruisverhouding vergeleken met TEV, die voorbijgaande spanningspulsen op het externe behuizingsoppervlak meet en meer wordt blootgesteld aan elektromagnetische interferentie van de omgeving. UHF biedt ook een hogere gevoeligheid voor interne defecten en een beter vermogen voor classificatie van ontladingstypes via PRPD-patroonanalyse. TEV blijft nuttig als draagbaar screeningsinstrument, maar voor permanente online monitoring van GIS, UHF is de technisch superieure keuze.
Vraag 2: Hoeveel UHF-sensoren zijn er nodig per GIS-ruimte?
De aanbevolen praktijk is één sensor per GIS-compartiment voor uitgebreide dekking. Voor een typische opstelling met één bay betekent dit 3 à 4 sensoren die de buscompartimenten en kabelafsluiting bedekken. Kritieke baaien of baaien met een geschiedenis van isolatieproblemen kunnen extra sensoren vereisen op bekende zwakke punten, zoals afstandsverbindingen en businterfaces. A 4- of een 6-kanaals acquisitiehost ondersteunt deze configuraties zonder problemen.
Q3: Kan het systeem binnen GIS onderscheid maken tussen PD-typen??
Ja. Het systeem maakt gebruik van 3D PRPD-patroonanalyse om ontladingsgebeurtenissen in vier categorieën te classificeren: corona-ontlading van vrije metaaldeeltjes, oppervlakteontlading op vervuilde afstandhouders, interne holteontlading binnen vaste isolatie, en zwevende potentiaalontlading van niet-geaarde metalen onderdelen. Each type produces a characteristic phase-magnitude pattern that the software matches against an expert database for automated identification.
Q4: Does installation require a GIS outage?
Nee. UHF sensors are mounted at external access points on the GIS enclosure — spacer flanges, inspection ports, or dedicated sensor windows — without opening any gas compartments. Coaxial cables are routed to the monitoring cabinet, which is installed in a nearby relay room or standalone enclosure. The entire installation, including commissioning and baseline measurement, is performed with the GIS energised and in normal service.
Vraag 5: How does the system handle false alarms in electrically noisy substations?
The GIS metallic enclosure provides natural electromagnetic shielding that inherently rejects most external interference in the UHF band. Beyond this physical advantage, the acquisition host applies frequency-domain filtering, time-domain gating, and pattern-recognition algorithms to distinguish genuine PD pulses from transient disturbances. Adjustable alarm thresholds can be tuned to the site-specific background noise level during commissioning. These combined measures typically achieve PD detection accuracy above 95 % with false alarm rates below 2 %.
Vraag 6: What SCADA protocols does the system support?
The monitoring host provides RJ45 Ethernet and RS-485 interfaces with native support for Modbus RTU, Modbus-TCP, IEC 61850, En DNP3. This covers virtually every substation automation architecture in use today and ensures that PD data — including real-time discharge magnitude, alarmstatus, and diagnostic codes — can be transmitted directly to the SCADA master station without external protocol converters.
Vraag 7: What is the expected return on investment?
A single prevented GIS compartment failure — which can cost several million dollars in equipment replacement, emergency repair, and lost revenue from extended outage — typically justifies the entire monitoring system investment. Additional ROI sources include reduced maintenance costs through the shift from time-based to condition-based inspection, extended GIS service life through early intervention, and reduced insurance premiums. Most installations achieve full ROI within two to three years.
Vraag 8: Can the system be expanded after the initial installation?
Ja. The modular architecture allows additional sensors to be added to new GIS compartments and connected to spare channels on the existing acquisition host. If all channels are occupied, an additional host unit can be installed and connected to the same backend software platform. Multiple GIS bays, or even multiple substations, can be monitored from a single centralised software interface, providing fleet-wide visibility of GIS insulation health.
Vrijwaring: De informatie in dit artikel is uitsluitend bedoeld voor algemene educatieve en referentiedoeleinden. FJINNO (www.fjinno.net) geeft geen garanties, expliciet of impliciet, wat betreft de volledigheid, nauwkeurigheid, of de toepasbaarheid van de inhoud op een specifiek project of installatie. Technical specifications referenced herein represent typical values and may vary depending on GIS type, plaatsing van de sensor, en siteomgeving. Technische beslissingen moeten altijd gebaseerd zijn op locatiespecifieke beoordelingen, uitgevoerd door gekwalificeerde professionals in overeenstemming met de toepasselijke normen, waaronder IEC 62478, IEC 61850, en lokale netcodes. Productnamen van externe fabrikanten zijn handelsmerken van hun respectievelijke eigenaren en worden uitsluitend ter informatie vermeld. FJINNO is niet aansprakelijk voor verlies of schade die voortvloeit uit het gebruik van of het vertrouwen op deze informatie.

Glasvezel temperatuursensor, Intelligent monitoringsysteem, Gedistribueerde glasvezelfabrikant in China
 |
 |
 |