 Sensori di temperatura a fibra ottica INNO ,sistemi di monitoraggio della temperatura.
- Scarico parziale (PD) is a localised insulation breakdown that, lasciato inosservato, progressively degrades transformer insulation and can ultimately cause catastrophic failure. Monitoraggio online della DP catches these defects at the earliest stage.
- Five complementary detection techniques — electrical, acustico, UHF, TEV, and chemical (DGA) — each capture a different physical manifestation of partial discharge, and no single method alone provides complete diagnostic coverage.
- UN multi-sensor fusion architecture combining ultrasonic sensors (20 kHz–200 kHz), sensori di corrente ad alta frequenza (100 kHz–50 MHz), E Sensori UHF (300 MHz–3 GHz) eliminates false positives, enables source localisation, and delivers the highest detection reliability.
- Avanzato PRPD (Scarica parziale risolta in fase) three-dimensional pattern analysis and PRPS (Phase-Resolved Pulse Sequence) visualisation allow engineers to identify the specific discharge type — corona, scarico superficiale, internal void, or floating potential — and prioritise maintenance accordingly.
- Moderno Sistemi di monitoraggio della PD integrare con SCADA e piattaforme di gestione delle risorse aziendali tramite Modbus, CEI 61850, e DNP3, incorporando i dati sanitari sull’isolamento nel più ampio flusso di lavoro di manutenzione basato sulle condizioni dell’azienda.
Sommario
- Cos'è la scarica parziale nei trasformatori e perché deve essere monitorata?
- Quattro tipi comuni di scariche parziali all'interno dei trasformatori di potenza
- Cinque tecniche di rilevamento delle scariche parziali a confronto: elettriche, Acustico, UHF, TEV, e metodi chimici
- Perché la fusione multisensore supera le prestazioni del rilevamento con metodo singolo
- Quali sono i componenti di un sistema di monitoraggio online delle scariche parziali?
- Installazione del sensore, Larghezza di banda, e funzione: ultrasuoni, HFCT, e UHF spiegato
- Specifiche tecniche chiave dell'unità ospitante di monitoraggio PD
- In che modo i modelli 3D PRPD e le sequenze di impulsi PRPS identificano i tipi di scarica?
- Software di monitoraggio backend: caratteristiche e capacità diagnostiche
- How Does a PD Monitoring System Integrate with SCADA and Asset Management Platforms?
- Which Transformers Benefit Most from Online Partial Discharge Monitoring?
- How to Select the Right Partial Discharge Monitoring Equipment — A Buyer’s Guide
- Applicable International Standards for Partial Discharge Testing and Monitoring
- Domande frequenti (Domande frequenti)
1. Cos'è la scarica parziale nei trasformatori e perché deve essere monitorata?
![]()
Scarico parziale is a localised electrical breakdown that only partially bridges the insulation between conductors inside a transformer. Unlike a full flashover, a partial discharge event does not create a complete conductive path, but it does release energy — in the form of electromagnetic radiation, onde acustiche, Calore, and chemical by-products — that gradually erodes the surrounding insulation material. Col tempo, repeated partial discharge activity enlarges the original defect, accelerates insulation ageing, and can ultimately trigger a complete insulation failure, leading to catastrophic transformer damage, interruzioni non pianificate, and significant financial loss.
The challenge is that partial discharge activity is invisible during normal operation. External symptoms such as dissolved gas accumulation in the oil or elevated winding temperatures often appear only after the defect has already progressed to an advanced stage. Questo è il motivo online partial discharge monitoring has become an essential component of modern monitoraggio delle condizioni del trasformatore programmes. By detecting the electrical, acustico, and electromagnetic signatures of PD events in real time, an online system provides the earliest possible warning of insulation degradation — weeks, mesi, or even years before the fault would be detected by conventional periodic testing.
2. Quattro tipi comuni di scariche parziali all'interno dei trasformatori di potenza

Not all partial discharge is the same. The physical mechanism, posizione, and severity of the discharge depend on the nature of the insulation defect. Understanding the four most common PD types helps engineers interpret monitoring data and plan appropriate maintenance responses.
Scarica della corona
Corona discharge occurs at sharp metallic protrusions or poorly shaped electrodes where the localised electric field intensity exceeds the breakdown strength of the surrounding medium — typically transformer oil or gas. The discharge appears as a faint glow and produces predominantly hydrogen gas. While corona is often considered the least severe form of PD, persistent corona activity degrades oil quality over time and can initiate more damaging discharge types.
Scarica superficiale
Surface discharge develops along the interface between solid insulation (pressboard or crepe paper) and the surrounding oil or gas. It is frequently caused by contamination, ingresso di umidità, or excessive tangential electric field stress at the insulation surface. Surface discharge can quickly escalate in severity because the carbonised tracking path it creates along the insulation surface progressively shortens the effective insulation distance.
Internal Void Discharge
Gas-filled voids or cavities trapped within solid insulation — typically caused by manufacturing defects, sollecitazione meccanica, or thermal ageing — create regions where the dielectric strength is significantly lower than the surrounding material. When the applied voltage exceeds the breakdown threshold of the void, a partial discharge ignites inside the cavity. Internal void discharge is particularly insidious because it is entirely enclosed within the insulation and cannot be detected by visual inspection.
Scarica a potenziale fluttuante
Quando è presente un componente metallico all'interno del trasformatore, ad esempio uno schermo, una staffa strutturale, o un collegamento allentato — non è collegato correttamente a un potenziale elettrico definito, acquisisce una tensione flottante tramite accoppiamento capacitivo. Questo potenziale fluttuante può provocare scariche ripetitive tra il componente e le strutture adiacenti messe a terra o sotto tensione. La scarica a potenziale fluttuante è tipicamente ad alto contenuto di energia e produce forti tracce UHF e acustiche, rendendolo relativamente più facile da rilevare ma anche più dannoso per l'isolamento vicino.
3. Cinque tecniche di rilevamento delle scariche parziali a confronto: elettriche, Acustico, UHF, TEV, e metodi chimici
![]()
Ciascuna tecnica di rilevamento cattura un diverso fenomeno fisico prodotto da eventi di scarica parziale. La tabella seguente fornisce un confronto affiancato dei cinque metodi più utilizzati, riassumendo i loro principi di misurazione, typical sensitivity, principali vantaggi, and primary limitations.
| Metodo di rilevamento | Physical Quantity Measured | Typical Sensor | Sensitivity Metric | Vantaggi principali | Principali limitazioni |
|---|---|---|---|---|---|
| Elettrico (CEI 60270) | Apparent charge (pc / nC) | Coupling capacitor, bushing tap | Down to ~1 pC | Standardised, quantitative, excellent for factory testing | Susceptible to EMI in field; primarily offline |
| Acustico / Ultrasonico | Acoustic emission (dB / mV) | Piezoelectric sensor (20–200 kHz) | Moderare | Immune alle EMI; enables PD source localisation via triangulation | Signal attenuated by tank structure and oil path |
| UHF (Frequenza ultraelevata) | Electromagnetic signal (300 MHz–3 GHz) | UHF antenna (conical, spiral, Vivaldi) | Down to a few pC equivalent | Excellent noise rejection; in tempo reale; suitable for online use | Sensitivity depends on sensor position; requires installation port |
| TEV (Tensione transitoria di terra) | Surface voltage pulse (mV) | Capacitive plate sensor | Moderate to high | Non-intrusive; no outage required; installazione semplice | Limited to metallic-enclosure equipment; external PD only |
| Chimico (DGA) | Dissolved gas concentration (ppm) | Online DGA monitor / lab chromatography | Indirect indicator | Detects cumulative insulation degradation; established standard | Slow response; cannot pinpoint PD location or type |
As the table illustrates, no single technique covers all aspects of partial discharge detection. Electrical methods provide the most accurate charge quantification but struggle with on-site noise. Acoustic and UHF methods excel at online monitoring and source localisation. TEV is ideal for quick non-intrusive screening. DGA reveals cumulative insulation damage but provides no real-time pulse-level information. This complementarity is what drives the industry toward multi-sensor fusion architectures.
4. Perché la fusione multisensore supera le prestazioni del rilevamento con metodo singolo
A single-sensor PD monitor — regardless of how sensitive it is — faces two fundamental challenges: false positives caused by external noise sources and diagnostic ambiguity when only one type of signal is available. Multi-sensor fusion technology addresses both problems by cross-correlating data from sensors operating in entirely different frequency domains and physical measurement principles.
Consider a practical example. An ultrasonic sensor mounted on the transformer tank detects an acoustic emission event. In isolation, the operator cannot be certain whether the signal is genuine PD or a mechanical vibration from a nearby cooling fan. Tuttavia, if a UHF sensor simultaneously detects a corresponding electromagnetic pulse, and a high-frequency current sensor at the grounding cable records a coincident current spike, the probability that the event is a true partial discharge rises to near certainty. The time-of-arrival difference between the acoustic and electromagnetic signals can further be used to estimate the spatial location of the discharge source inside the transformer.
This fusion approach dramatically reduces false alarm rates, improves diagnostic confidence, and enables the operator to not only confirm that PD is occurring but also determine where it is occurring and how severe it is — all from a single integrated monitoring platform. It is the reason why leading sistemi di monitoraggio delle scariche parziali di trasformatori now incorporate three sensor types as standard, rather than relying on any one method alone.
5. What Are the Components of an Online Partial Discharge Monitoring System?
Un completo online PD monitoring system consists of three functional layers that work together to convert raw discharge signals into actionable diagnostic intelligence.
Field Sensors
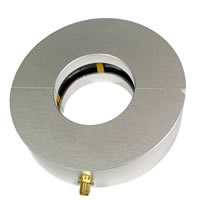
Three types of sensors are deployed on the transformer to capture different physical manifestations of partial discharge. Ultrasonic sensors detect acoustic emissions from PD activity within the windings and oil. High-frequency current (HFCT) sensors clamp onto the core grounding cable to measure pulse currents generated by discharge events. UHF sensors are installed at oil valve ports to capture ultra-high-frequency electromagnetic radiation propagating through the transformer oil. Each sensor is designed for harsh outdoor environments with an IP68 protection rating.
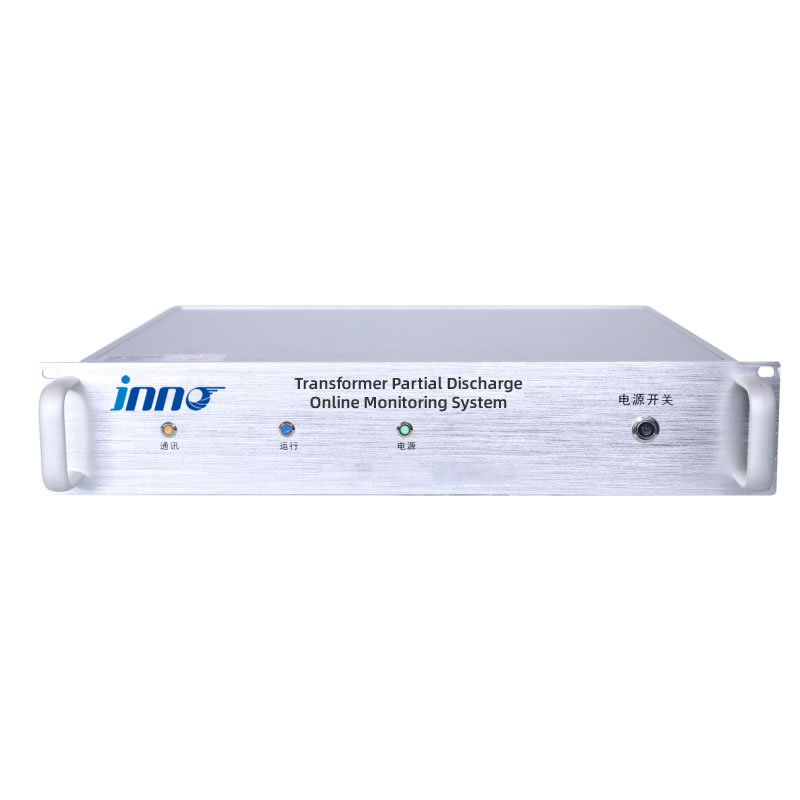
PD Monitoring Host Unit
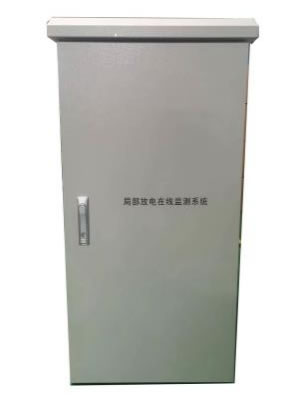
The monitoring host is the central processing hub of the system. Riceve segnali analogici da tutti i sensori collegati, esegue il condizionamento del segnale (amplificazione, filtraggio, e adattamento di impedenza), e digitalizza le forme d'onda ad alta velocità utilizzando un'architettura di acquisizione multicanale. L'host calcola i parametri chiave della PD, inclusa l'ampiezza massima di scarica, quantità media di scarico, e frequenza di scarica e applica algoritmi intelligenti per il riconoscimento dei modelli e la classificazione dei guasti. Solitamente è montato su rack in un contenitore da 2U all'interno di un armadio di convergenza o di un pannello di controllo vicino al trasformatore.
Software di monitoraggio del back-end
Installato su un computer o server della sala di controllo, la piattaforma software fornisce la visualizzazione in tempo reale, andamento storico, gestione degli allarmi, e analisi diagnostica. Le sue capacità analitiche principali includono la visualizzazione di modelli PRPD 3D, Mappatura della sequenza degli impulsi PRPS, statistiche sull'ampiezza di scarica, and comparison against an expert pattern database for automated PD type identification. The software communicates with the monitoring host via Ethernet or RS-485.
6. Installazione del sensore, Larghezza di banda, e funzione: ultrasuoni, HFCT, e UHF spiegato
The effectiveness of a sistema di monitoraggio delle scariche parziali depends heavily on correct sensor selection and placement. The table below details the three sensor types used in a full-spectrum multi-sensor architecture, including their monitoring bandwidth, metodo di installazione, mounting location, and primary diagnostic function.
| Tipo di sensore | Monitoring Bandwidth | Metodo di installazione | Mounting Location | Funzione primaria |
|---|---|---|---|---|
| Ultrasonic Sensor | 20 kHz – 200 kHz | Magnetic mount | Transformer tank surface | Detects acoustic emission signals generated by internal PD activity in windings and insulation structures |
| High-Frequency Current (HFCT) Sensore | 100 kHz – 50 MHz | A pinza | Core grounding point | Captures high-frequency pulse currents flowing through the grounding cable as a result of discharge events |
| UHF Sensor | 300 MHz – 3 000 MHz | Plug-in type | Oil drain valve port | Monitors ultra-high-frequency electromagnetic signals propagating through transformer oil, indicating internal insulation discharge |
Installation Notes
Ultrasonic sensors attach to the tank wall using a magnetic holder, which allows flexible repositioning without drilling or welding. For optimal acoustic coupling, a thin layer of couplant gel is applied between the sensor face and the tank surface. The HFCT sensor is a split-core clamp that can be installed around the grounding cable without disconnecting it — meaning no transformer outage is required. The UHF sensor inserts into an existing oil drain valve or dedicated dielectric window port, placing the antenna element inside the oil space for maximum sensitivity to internal electromagnetic signals. All three sensor types are rated IP68, ensuring reliable operation in rain, polvere, umidità, and temperature extremes from -20 °C a +125 °C.
7. Specifiche tecniche chiave dell'unità ospitante di monitoraggio PD
The monitoring host is the heart of the system, responsible for high-speed signal acquisition, real-time processing, and data communication. The table below presents the core technical parameters of a representative industrial-grade PD monitoring host designed for substation deployment.
| Parametro | Specifica |
|---|---|
| Ricezione del segnale | Ultrasonico, high-frequency current (HFCT), and UHF sensor inputs |
| Dynamic Range | -80 A -20 dBm |
| Frequenza di campionamento | 200 MS/s (200 million samples per second) |
| Channel Configuration | 4 O 6 canali (user-configurable) |
| Channel Consistency | ≤ 0.5 dBm |
| Intervallo di monitoraggio | ≤ 20 000 pc |
| Transmission Impedance | ≥ 12 mV/mA |
| Interfacce di comunicazione | RJ45 Ethernet, RS-485 |
| Supported Protocols | ModBus RTU/TCP, CEI 61850, DNP3 |
| Alimentazione elettrica | AC 90–240 V, 50/60 Hz |
| Enclosure | 2Montaggio su rack a U (483 mm × 89 mm × 300 mm) |
| Metodo di installazione | Convergence cabinet or control panel mount |
| Sensor Protection Rating | IP68 |
| Temperatura operativa | -20 °C a +125 °C (sensore); host per cabinet environment |
| Diagnostic Outputs | Entità della scarica (Q), discharge phase (Ø), 3D PRPD patterns, PRPS pulse sequences, maximum amplitude, average quantity, frequenza di scarica |
Perché 200 MS/s Sampling Rate Matters
Partial discharge pulses are extremely fast transient events, often lasting only nanoseconds. A sampling rate of 200 MS/s — equivalent to a 5-nanosecond sampling interval — ensures that the host captures the full waveform of each discharge pulse without aliasing or distortion. This waveform fidelity is essential for accurate PRPD pattern construction and for distinguishing genuine PD pulses from noise artefacts. Lower sampling rates may miss critical waveform features, leading to misclassification or missed detections.
8. In che modo i modelli 3D PRPD e le sequenze di impulsi PRPS identificano i tipi di scarica?
Raw PD data — pulse counts, amplitudes, and timestamps — becomes truly diagnostic when it is visualised through Scarica parziale risolta in fase (PRPD) patterns and Phase-Resolved Pulse Sequence (PRPS) visualizza.
PRPD — The Fingerprint of Discharge
A PRPD pattern plots discharge magnitude (vertical axis) against the phase angle of the power-frequency cycle (horizontal axis), accumulated over many cycles to build a three-dimensional density map. Different PD types produce distinctly different PRPD shapes. Corona discharge typically appears as clusters concentrated near the voltage peaks on one polarity. Internal void discharge produces symmetrical patterns on both positive and negative half-cycles, with the discharge magnitude remaining relatively constant. Surface discharge shows asymmetric, spreading patterns that increase in magnitude with applied voltage. Floating-potential discharge creates dense, high-amplitude clusters that shift in phase as the floating voltage changes.
By comparing a measured PRPD pattern against an expert database of known discharge signatures, the monitoring software can automatically classify the PD type and assess its severity — transforming a complex electromagnetic phenomenon into an actionable maintenance recommendation.
PRPS — Tracking Discharge Evolution Over Time
While PRPD provides a cumulative snapshot, PRPS displays individual pulses in sequence, preserving the time relationship between consecutive discharge events. This is particularly valuable for detecting intermittent PD activity, observing how discharge patterns evolve under changing load or temperature conditions, and distinguishing between multiple simultaneous PD sources. PRPS data also supports advanced statistical analysis — such as pulse interval distributions and clustering algorithms — that can reveal degradation trends before they are visible in the PRPD pattern alone.
9. Software di monitoraggio backend: caratteristiche e capacità diagnostiche
The backend software platform transforms the monitoring host’s raw output into a decision-support tool for operators and asset managers. Installed on a control room workstation or accessible via a web interface, it provides four core functional modules.
Real-Time Monitoring and Visualisation
The system continuously acquires and displays live PD data, including 3D PRPD spectrum maps, PRPS pulse sequences, discharge amplitude bar charts, and trend lines for key parameters such as maximum discharge magnitude, quantità media di scarico, and discharge repetition rate. Operators can view individual channel data or an aggregated system-level summary.
Historical Query and Trending
All measurement data is stored with timestamps, enabling engineers to query historical records by date range, canale, or alarm event. Statistical trending tools reveal long-term insulation degradation trajectories, seasonal variations, and load-correlated PD behaviour. Trend forecasting algorithms support predictive maintenance scheduling.
Gestione degli allarmi
Multi-level alarm thresholds — typically informational, avvertimento, and critical — can be configured for each monitored parameter. When a threshold is exceeded, the system generates visual alerts on the dashboard and transmits notifications via email, sms, or relay output. Alarm events are logged with full context (timestamp, canale, parameter value, PRPD snapshot) for post-event analysis.
Diagnostica intelligente
The software includes a built-in expert pattern database that maps PRPD and PRPS signatures to known discharge types. When new data matches a stored pattern, the system suggests the most probable PD type and recommended action. This reduces dependence on manual expert interpretation and accelerates the decision-making process, particularly for utilities managing large transformer fleets.
10. How Does a PD Monitoring System Integrate with SCADA and Asset Management Platforms?
Partial discharge data delivers maximum value when it is embedded in the utility’s wider operational data ecosystem rather than confined to a standalone display. A well-designed PD monitoring system supports this integration through standard industrial communication interfaces and protocols.
At the substation level, the PD monitoring host connects to the station RTU (Remote Terminal Unit) or bay controller via RJ45 Ethernet O RS-485. Standard protocols — including ModBus RTU/TCP, CEI 61850, E DNP3 — ensure compatibility with virtually any substation automation architecture. Key data points transmitted to SCADA include real-time PD amplitude values, alarm status flags, and diagnostic summary codes. Dispatchers can configure high-priority alarms for critical PD events — such as sudden acetylene-type UHF signatures or rapidly increasing discharge rates — ensuring immediate visibility on the SCADA overview screen.
Correlation with Other Monitoring Parameters
The greatest diagnostic insight comes from correlating PD data with complementary transformer health parameters. When the PD monitoring system feeds data into an integrated piattaforma di monitoraggio dei trasformatori alongside dissolved gas analysis (DGA), fibre optic winding temperature, bushing capacitance and tan-delta, and on-load tap changer condition data, the platform can perform automated cross-parameter analysis. Per esempio, a simultaneous increase in UHF PD activity and a rise in hydrogen concentration in the oil provides much stronger confirmation of an active internal insulation fault than either indicator alone. This multi-parameter correlation approach significantly reduces diagnostic uncertainty and supports more confident maintenance decision-making.
11. Which Transformers Benefit Most from Online Partial Discharge Monitoring?
While any oil-filled or dry-type transformer can experience partial discharge, the investment in continuous online monitoring is best directed at assets where the consequences of an undetected insulation fault are most severe.
Highest-Priority Applications
Transmission-voltage power transformers (≥110 kV) at utility substations are the primary candidates, as their failure causes widespread outages and replacement lead times can exceed twelve months. Generator step-up (GSU) transformers at thermal, hydro, and nuclear power plants are equally critical because an unplanned trip directly removes generation capacity from the grid. Large industrial transformers serving petrochemical complexes, semiconductor fabrication plants, centri dati, and steel mills also justify online PD monitoring due to the enormous cost of production downtime.
Growing Adoption Scenarios
The expansion of renewable energy has created new demand. Collector and interconnection transformers at wind farms E solar farms experience highly variable loading profiles and are often in remote locations where periodic manual testing is expensive and infrequent. Traction power transformers for railway electrification systems carry safety-critical loads. Ageing transformers operating beyond their original design life are another strong candidate — continuous PD trending supports evidence-based lifetime extension decisions. Alta tensione quadri, GIS (quadri isolati in gas), E power cable systems are also increasingly equipped with online PD monitoring, using the same sensor technologies adapted for their specific enclosure geometries.
12. How to Select the Right Partial Discharge Monitoring Equipment — A Buyer’s Guide
The market offers a range of PD monitoring products, from single-sensor screening devices to full multi-sensor diagnostic platforms. The following criteria will help buyers match the right equipment to their specific application requirements.
Sensor Coverage and Fusion Capability
For comprehensive diagnostics on critical transformers, specify a system that supports all three sensor types — ultrasonic, HFCT, and UHF — with true multi-channel data fusion. Single-sensor systems (per esempio., UHF-only or acoustic-only) are suitable for basic screening but cannot provide the cross-verification and source localisation capabilities that multi-sensor fusion delivers.
Sampling Rate and Dynamic Range
A sampling rate of at least 200 MS/s ensures that fast PD transients are captured without loss of waveform detail. The dynamic range should be wide enough — at least -80 A -20 dBm — to handle both very small incipient discharges and large discharge events without saturation or signal clipping.
Conteggio e scalabilità dei canali
Evaluate whether four channels suffice for the intended transformer or whether six channels are needed to accommodate additional sensor positions. Systems with configurable channel options provide flexibility for both initial deployment and future expansion.
Diagnostic Software Quality
The software should include 3D PRPD pattern display, PRPS visualisation, an expert pattern database for automated PD type classification, multi-level alarm management, and historical trend analysis with forecasting. Web-based or remote-access capability is increasingly expected for fleet-wide management.
Compatibilità del protocollo di comunicazione
Ensure the monitoring host supports the communication protocol already in use at your substation — ModbusRTU, ModBus TCP, CEI 61850, O DNP3. Native protocol support avoids the cost and complexity of adding external protocol converters.
Environmental Rating and Sensor Durability
Sensors must be rated IP68 for outdoor installation and specified for the full operating temperature range of the site. Sensor mounting methods — magnetic, clamp-on, and plug-in — should require no modification to the transformer structure and no outage for installation.
Vendor Support and Expert Database Updates
PD pattern recognition accuracy depends on the quality and breadth of the expert database. Choose a vendor that provides regular database updates incorporating new discharge patterns and diagnostic refinements as field experience accumulates across their installed base.
13. Applicable International Standards for Partial Discharge Testing and Monitoring
Several international standards govern partial discharge measurement, interpretazione, e le prestazioni delle apparecchiature. Understanding these references helps buyers write better procurement specifications and ensures that the selected monitoring system meets globally accepted benchmarks.
CEI 60270 (High-Voltage Test Techniques — Partial Discharge Measurements) is the foundational standard for electrical PD measurement. It defines the apparent charge method, procedure di calibrazione, and test circuit configurations. While primarily intended for offline factory testing, i suoi principi di misurazione sono alla base di molti progetti di sistemi online.
CEI 62478 (Tecniche di prova ad alta tensione: misurazione delle scariche parziali mediante metodi elettromagnetici e acustici) estende il quadro standard per coprire le tecniche di rilevamento UHF e acustico, fornendo indicazioni sulle specifiche del sensore, elaborazione del segnale, e presentazione dei dati per metodi di misurazione della PD non convenzionali utilizzati nel monitoraggio online.
IEEE C57.127 (Guida per il rilevamento, Posizione, e Interpretazione delle sorgenti di emissioni acustiche da scariche elettriche in trasformatori e reattori di potenza) si concentra in particolare sul rilevamento acustico delle scariche elettrodi nei trasformatori, copertura del posizionamento del sensore, interpretazione del segnale, e tecniche di localizzazione della fonte.
Ulteriori riferimenti includono Brochure tecnica CIGRE 676 (Scariche Parziali nei Trasformatori) che fornisce una guida completa sui fenomeni PD, tecniche di misurazione, and interpretation strategies, E CEI 61850 which defines the communication standard for substation automation and governs how PD monitoring data is exchanged with SCADA and asset management systems.
14. Domande frequenti (Domande frequenti)
Q1: What is the difference between partial discharge and full breakdown?
Partial discharge is a localised insulation breakdown that bridges only part of the insulation gap between conductors. It does not create a complete conductive path and does not cause immediate equipment failure. Full breakdown, per contrasto, represents a complete insulation failure — a short circuit that typically results in catastrophic damage, an explosion, or fire. Partial discharge is the precursor; if left unmonitored and unaddressed, it progressively degrades insulation until full breakdown occurs.
Q2: Can partial discharge be detected while the transformer is energised?
SÌ. In linea sistemi di monitoraggio delle scariche parziali are specifically designed to operate while the transformer is energised and carrying load. The ultrasonic, HFCT, and UHF sensors are all installed without requiring a transformer outage, and the system continuously acquires data under normal operating conditions. Infatti, monitoring PD under real service voltage and load is more representative of the transformer’s actual insulation condition than offline tests performed at reduced voltage.
Q3: How does multi-sensor fusion reduce false alarms?
Each sensor type is sensitive to a different physical phenomenon. A genuine partial discharge event simultaneously produces an acoustic wave (detected by the ultrasonic sensor), a high-frequency current pulse (detected by the HFCT sensor), and an electromagnetic signal (detected by the UHF sensor). External interference sources — such as switching transients, radio signals, or mechanical vibrations — typically affect only one sensor type. By requiring correlated detections across two or more sensors before raising an alarm, the system effectively eliminates false positives caused by single-source noise.
Q4: What is a PRPD pattern and how is it used for diagnosis?
UN PRPD (Scarica parziale risolta in fase) pattern is a three-dimensional visualisation that plots discharge magnitude against the phase angle of the AC power cycle, accumulated over many cycles. Different types of partial discharge — corona, scarico superficiale, vuoti interni, floating potentials — each produce characteristic PRPD shapes. By matching the measured pattern against a database of known discharge signatures, the monitoring system can identify the type of insulation defect and assess its severity, enabling targeted maintenance rather than generic inspections.
Q5: How long does it take to install a PD monitoring system on an existing transformer?
A typical installation takes one to two days per transformer. Ultrasonic sensors attach magnetically to the tank surface, HFCT sensors clamp onto the core grounding cable, and UHF sensors plug into existing oil drain valve ports — none of these steps require a transformer outage. The monitoring host is rack-mounted inside a nearby control cabinet, connected to the sensors via signal cables, and linked to the control room via Ethernet or RS-485. Messa in servizio, calibration verification, and operator training are typically completed on-site within the same visit.
Q6: What maintenance does the PD monitoring system itself require?
The system requires minimal maintenance. Recommended activities include quarterly visual inspection of sensor mounting integrity and cable connections, annual calibration verification using a reference signal source, and periodic software updates to incorporate the latest diagnostic algorithms and expert pattern database revisions. The sensors themselves are maintenance-free with IP68 environmental protection. Data storage capacity should be monitored to prevent disk space issues on the backend server.
D7: Can the system monitor multiple transformers simultaneously?
SÌ. The backend monitoring software supports a multi-asset architecture where multiple PD monitoring hosts — each connected to its own set of sensors on a different transformer — report to a single centralised software platform. This N-to-1 configuration is standard for substations and industrial facilities with several transformers, providing fleet-wide visibility from a single operator interface and reducing total system cost.
Q8: How does online PD monitoring complement dissolved gas analysis (DGA)?
DGA detects the chemical by-products of insulation degradation — dissolved gases such as hydrogen and acetylene — that accumulate in transformer oil over time. It is excellent for confirming that insulation damage has occurred, but it responds slowly and cannot pinpoint the location or real-time activity of the discharge source. Monitoraggio online della DP, per contrasto, detects individual discharge events as they happen, identifies the PD type through PRPD analysis, and can localise the source via acoustic triangulation. Insieme, DGA and PD monitoring provide complementary layers of insulation surveillance — DGA for cumulative damage assessment and PD for real-time fault activity tracking.
D9: What is the expected return on investment for a PD monitoring system?
ROI is typically realised within two to three years through prevention of catastrophic insulation failures — each of which can cost millions of dollars in equipment replacement, produzione persa, and collateral damage. A single prevented failure often justifies the entire monitoring system investment. Additional benefits include optimised maintenance scheduling (avoiding unnecessary outages and inspections), extended transformer service life, reduced insurance premiums, and improved regulatory compliance for critical infrastructure assets.
Q10: What communication protocols are supported for SCADA integration?
The PD monitoring host provides RJ45 Ethernet E RS-485 interfacce di comunicazione, supporting standard industrial protocols including ModbusRTU, ModBus TCP, CEI 61850, E DNP3. This ensures seamless integration with virtually any substation automation or SCADA architecture. Real-time PD data, stato di allarme, and diagnostic results can be transmitted to centralised monitoring centres and enterprise asset management (EAM) piattaforme.
Disclaimer: Le informazioni fornite in questo articolo sono solo a scopo didattico generale e di riferimento. FJINNO (www.fjinno.net) non fornisce garanzie, espresso o implicito, per quanto riguarda la completezza, precisione, or applicability of the content to any specific project or installation. Technical specifications referenced herein represent typical values and may vary depending on transformer type, posizionamento del sensore, and site environment. Engineering decisions should always be based on site-specific assessments conducted by qualified professionals in accordance with applicable standards including IEC 60270, CEI 62478, IEEE C57.127, e codici di rete locali. Product names of third-party manufacturers are trademarks of their respective owners and are mentioned for informational reference only. FJINNO non sarà responsabile per eventuali perdite o danni derivanti dall'uso o dall'affidamento su queste informazioni.

Sensore di temperatura a fibra ottica, Sistema di monitoraggio intelligente, Produttore di fibra ottica distribuito in Cina
 |
 |
 |