 INNO faseroptische Temperatursensoren ,Temperaturüberwachungssysteme.
- Real-time transformer health monitoring provides continuous visibility of electrical, Thermal-, and mechanical conditions.
- Integrated sensors—such as DGA, UHF partial discharge, Und Glasfasertemperatur—enable early fault detection and predictive maintenance.
- Smart IoT gateways connect transformers to SCADA and cloud systems for analytics and automated protection.
- In tropical regions like Vietnam and Indonesia, climate-adaptive thresholds improve reliability under high humidity and temperature.
- Factory-built systems with certified sensors ensure long-term stability, Genauigkeit, and cybersecurity compliance.
Inhaltsverzeichnis
- 1. What Is a Real-Time Transformer Health Monitoring System
- 2. Why Transformer Health Monitoring Is Important
- 3. Transformer Components and Structure Overview
- 4. Transformer Fault Types and Failure Causes
- 5. How Does Transformer Monitoring Work
- 6. Core Components of the Monitoring System
- 7. Key Sensors and Measured Parameters
- 8. Fiber Optic Temperature Monitoring for Transformer Windings
- 9. Analyse gelöster Gase (DGA) and Oil Quality Monitoring
- 10. Teilentladung (UHF) Detection and Insulation Faults
- 11. Mechanical and Environmental Condition Monitoring
- 12. Transformer Alert and Protection Functions
- 13. Communication and SCADA Integration
- 14. Predictive Maintenance and AI Data Analytics
- 15. Smart Transformer Monitoring in IoT Systems
- 16. Types of Monitoring Systems (Online, Tragbar, Integriert)
- 17. Transformer Case Studies in Vietnam and Indonesia
- 18. Installation and Setup Guidelines
- 19. Häufig gestellte Fragen (Extended Technical FAQ)
- 20. About Our Factory and Technical Solutions
1. What Is a Real-Time Transformer Health Monitoring System
A real-time transformer health monitoring system is an integrated hardware–software platform that continuously observes a transformer’s condition while it remains in service. It acquires raw data from embedded and external sensors, processes the signals at the edge, synchronisiert Zeitstempel kanalübergreifend, und streamt bereinigte Daten an Kontrollräume oder Cloud-Analysen. Das System berechnet Gesundheitsindizes, prognostiziert Risiken, und gibt Warnungen aus, wenn Betriebsgrenzen überschritten werden oder ungewöhnliche Trends auftreten.
Im Gegensatz zu regelmäßigen Inspektionen, Die Echtzeitüberwachung wartet nicht darauf, dass Symptome sichtbar werden. Es erkennt die Vorläufer – subtile Anstiege der Temperatur des gewundenen Hotspots, frühe Gasbildung, sporadische Teilentladungsstöße, oder kleine Verschiebungen der Schwingungssignaturen, die Ausfällen vorausgehen. In Küsten- oder Äquatorklima typisch Ho-Chi-Minh-Stadt, Da Nang, Jakarta, Und Surabaya, Eine kontinuierliche Überwachung ist unerlässlich, da Feuchtigkeit und Hitze die Alterung der Isolierung und den Ölabbau beschleunigen.
Zu den wichtigsten Ergebnissen gehört ein besseres Situationsbewusstsein für Netzbetreiber, weniger Notabschaltungen für Industrieanwender, and a strong value proposition for transformer OEMs and agents who supply “smart-ready” equipment into Southeast Asian projects.
![]()
2. Why Transformer Health Monitoring Is Important
Transformers are high-value, mission-critical assets with slow failure progression but severe consequence when breakdown occurs. Health monitoring addresses three realities of field operation:
- Thermal stress is cumulative: Each hour at elevated temperature shortens insulation life. Real-time hot-spot tracking enables proactive cooling control and load management.
- Chemical aging is silent: Oxidation, Eindringen von Feuchtigkeit, and cellulose depolymerization progress without obvious signs. Online oil and moisture monitoring reveals the chemistry in motion.
- Electrical defects start small: Minor partial discharge, lose Verbindungen, and surface tracking can persist for months before a flashover. UHF detection and event trending expose these early-stage defects.
Für Vietnam Und Indonesien, monitoring mitigates specific regional risks: frequent lightning impulses, saline air in coastal areas, and thermal loading due to high ambient temperatures. It supports manufacturing hubs—textiles, Elektronik, Zement, and petrochemicals—where unplanned power loss leads to disproportionate production and contractual penalties.
3. Transformer Components and Structure Overview
To monitor effectively, the system must “understand” the transformer’s physical layout and which parts are most sensitive. The table maps key components to their function and typical monitoring focus.
| Komponente | Funktion | Monitoring Focus | Typische Sensoren |
|---|---|---|---|
| Kern | Provides magnetic path; minimizes core loss | Heizung, Vibration, core bolt insulation | Temperaturfühler, Beschleunigungsmesser |
| LV/HV Windings | Carry current; induce voltage | Hot-spot temperature, inter-turn faults | Fluoreszierende Glasfaser, FTE, current transducers |
| Tippen Sie auf Wechsler (OLTC) | Voltage regulation under load | Kontaktverschleiß, Lichtbogenbildung, Ölzustand | Temperatur, current signature, DGA (C2H2, C2H4) |
| Buchsen | High-voltage terminals/insulators | Dielectric loss, Oberflächenverfolgung, PD | UHF PD, Leckstrom, capacitance/tan δ |
| Oil–Paper Insulation | Elektrische Isolierung & cooling medium | Feuchtigkeit, Säure, gelöste Gase | Online-DGA, moisture-in-oil sensors |
| Kühlsystem | Removes losses (ONAN/ONAF/OFAF/ODAF) | Fan/pump status, radiator efficiency | Temperatur, fließen, power relays |
| Conservator & Breather | Oil volume compensation; drying | Oil level, silica gel saturation | Level switches, Luftfeuchtigkeit |
| Tank & Accessories | Mechanical enclosure; Beschläge | Druck, Lecks, PRD activation | Druck, tilt, leakage detectors |
This structural view guides sensor placement and alert strategy. Zum Beispiel, fiber optic probes are routed to winding hot-spots; UHF antennas are positioned near bushings and cable terminations; moisture probes sit in oil lines with representative circulation.
4. Transformer Fault Types and Failure Causes
Failures rarely arise from a single cause; they are typically multi-factor effects. The matrix below summarizes common fault types, root causes, early indicators, and recommended monitoring signals.
| Fehlertyp | Root Causes | Early Indicators | Best Monitoring Signals |
|---|---|---|---|
| Thermal Overload | Hohe Belastung, blocked radiators, fan failure | Rising hot-spot; top-oil surge | Fiber optic hot-spot, Top-Öl, Laststrom |
| Insulation Aging | Hohe Temperatur, Feuchtigkeit, Oxidation | Moisture-in-oil increase; PD-Beginn | Feuchtigkeitssensoren, DGA (CO, CO2), UHF PD |
| Inter-Turn Fault | Mechanical shock, dielectric weakness | Localized heating; differential current drift | Hot-spot gradient, aktuelles Ungleichgewicht |
| OLTC Arcing | Kontaktverschleiß, Fehlausrichtung, low oil quality | Acetylene spikes; temperature spikes at operations | DGA (C2H2), temperature near OLTC, operation counter |
| Bushing Breakdown | Kontamination, Altern, Eindringen von Feuchtigkeit | Surface tracking; PD near terminals | UHF PD near bushings, leakage current/tan δ |
| Core Hot-Spot | Shorted laminations, flux imbalance | Vibration shift; localized temperature rise | Accelerometers, core temperature probes |
| Oil Degradation | Oxidation, Kontamination, aeration | Acidity rise; Feuchtigkeit; PD-Aktivität | Oil QA (acid number), Feuchtigkeit, DGA |
| External Flashover | Verschmutzung, Salzsprühnebel, Blitz | Corona noise; Oberflächenentladung | UHF PD, weather/ambient sensors |
Field experience in Vietnam Und Indonesien shows that moisture-related and OLTC-related issues are disproportionately represented due to climate and frequent tap operations for voltage stability. Ein robustes Überwachungsprogramm priorisiert diese Kanäle, ohne den Rest zu ignorieren.
5. How Does Transformer Monitoring Work
Der Workflow kombiniert synchronisierte Datenerfassung mit kontextbezogenen Analysen. Eine prägnante, Bedienerfreundlicher Ablauf ist:
- Erwerben: Sensoren strömen Messungen (Temperatur, Gase, PD, Vibration, aktuell, Luftfeuchtigkeit) mit definierten Abtastraten. Die GPS/PTP-Zeitsynchronisierung gewährleistet eine kanalübergreifende Ausrichtung.
- Qualifizieren: Die Edge-Firmware filtert Rauschen, prüft die Plausibilität (Reichweite, Änderungsrate), und markiert Qualitätsflaggen (OK, verdächtig, ungültig).
- Aggregat: Die Datenerfassungseinheit führt Kanäle in zeitlich ausgerichtete Frames zusammen und berechnet Merkmale erster Ordnung (gleitende Durchschnittswerte, Gipfel, harmonischer Inhalt, PD zählt).
- Analysieren: Gesundheitsindizes und Risikobewertungen werden aus Modellen abgeleitet, die die thermische Alterung berücksichtigen, Gasverhältnisse, PD-Schweregrad, und Ladeverlauf.
- Alarm & Akt: Schwellenwerte und Expertenregeln führen zu Warnungen, Alarm, und automatisierte Kontrollen (Lüfter-/Pumpenstart, OLTC-Lichtbogenschutz). Ereignisse werden an HMI weitergegeben, SCADA, und Cloud-Dashboards.
Dieser geschlossene Regelkreis wandelt Rohsignale in operative Entscheidungen um. Für einen Produktionscampus in Bình Dương oder Ost-Java, Dieselbe Plattform lässt sich über Dutzende von Transformatoren skalieren, Standardisierung von Gesundheits-KPIs und Alarmsemantik.
6. Core Components of the Monitoring System
Die Konfigurationen variieren zwar, Die erfolgreichsten Implementierungen in Südostasien verfügen über eine gemeinsame Architektur, die ein ausgewogenes Verhältnis von Robustheit bietet, Interoperabilität, und Wartungsfreundlichkeit.
6.1 Edge-Hardware
- Datenerfassungseinheit (DAU): Mehrkanalige analoge/digitale Eingänge, Hochgeschwindigkeits-Sampling für UHF PD, Isolierte Eingänge für 4–20 mA/0–10 V, und digitale Zähler für OLTC-Operationen.
- Industrieller Controller: Echtzeit-Betriebssystem, deterministische E/A, Lokale Regel-Engine für Alarmeskalation und Kontrollmaßnahmen.
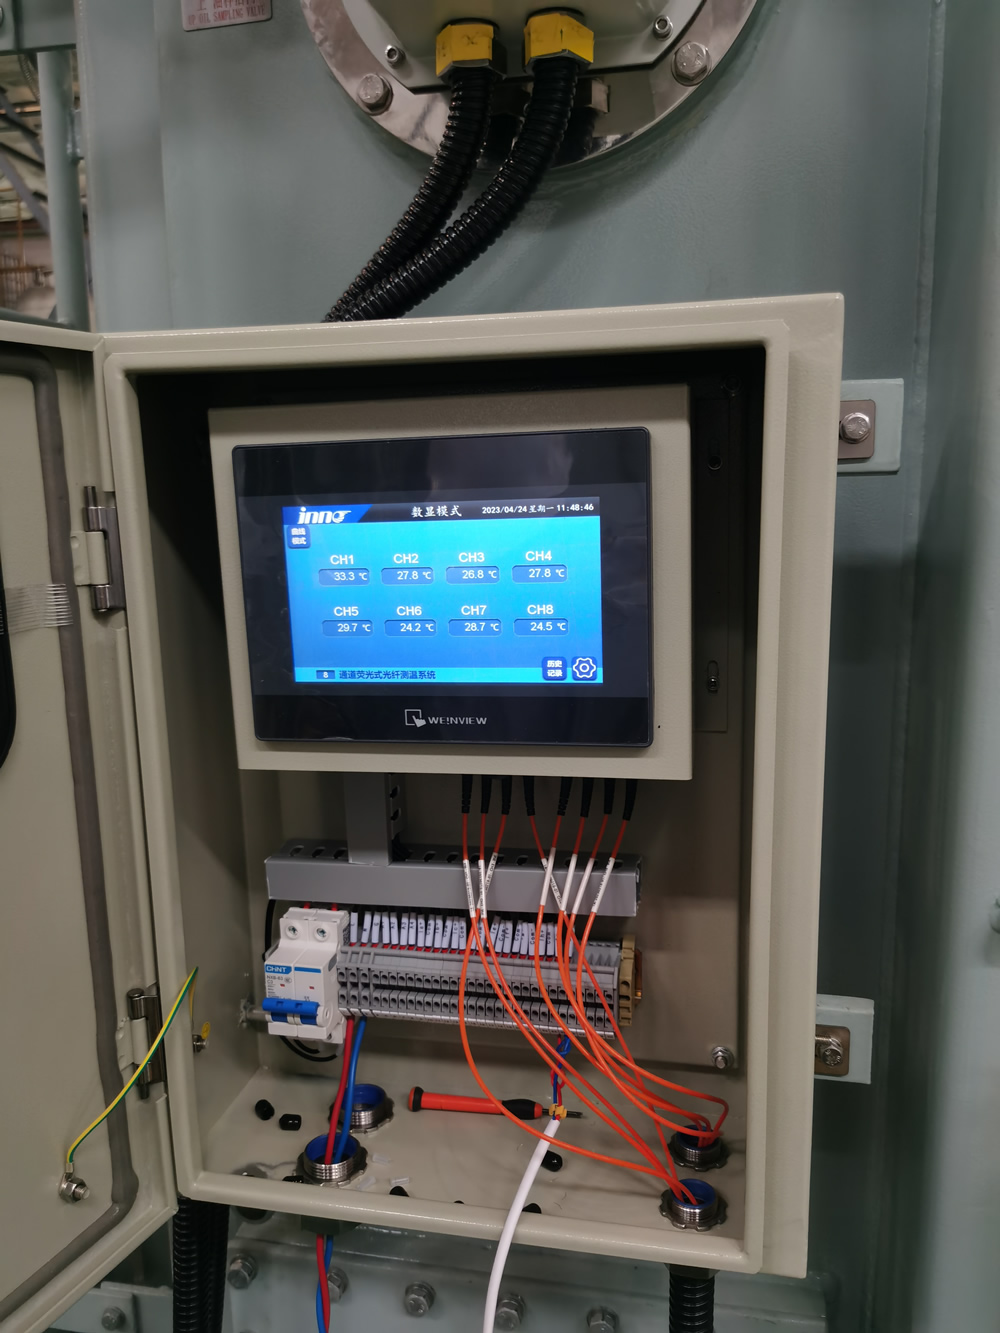
- Lokales HMI: 7–15-Zoll-Touchscreen für den Status vor Ort, Trends, und manuelle Übersteuerungen; mehrsprachige Benutzeroberfläche (Englisch, Vietnamesisch, Indonesisch).
6.2 Kommunikation
- Feldbus: RS-485 Modbus RTU for rugged legacy integration; CAN for local peripheral networks.
- Ethernet: Modbus TCP/IP and OPC UA to DCS/SCADA; VLAN segmentation for security.
- Substation Protocols: IEC 61850 MMS/GOOSE for event speed and interoperability.
- Backhaul: Faser, 4G/5G, or microwave links to control centers and cloud.
6.3 Software Stack
- Edge Analytics: Merkmalsextraktion, Regelbasierte Alarme, buffering for intermittent connectivity.
- SCADA-Integration: Tag mapping, historian logging, enterprise user management, audit trails.
- Cloud Analytics: Fleet-wide dashboards, predictive models, and API endpoints for ERP/EAM systems.
6.4 Power and Protection
- Power Supplies: Wechselstrom 220 V in; Gleichstrom 24 V/12 V protected outputs for sensors; surge protection tuned for lightning-prone regions.
- Enclosures: IP65/66 for outdoor yards; stainless options for coastal salt exposure.
7. Key Sensors and Measured Parameters
The system’s value depends on the fidelity and complementarity of its sensors. Selecting the right mix is essential for tropical deployment and for the asset’s voltage class and duty cycle.

7.1 Sensor–Parameter Matrix
| Parameter | Primary Sensor | Funktionsprinzip | Warum es wichtig ist |
|---|---|---|---|
| Winding Hot-Spot | Fluoreszierende Glasfaser | Fluorescence decay time vs. Temperatur | Direkt, EMI-immune hot-spot captures thermal aging drivers |
| Top-Oil / Bottom-Oil | FTE / Thermistor | Resistive temperature variation | Cooling efficiency; thermal gradient evaluation |
| Gelöste Gase | Online DGA Sensor | Optical/electrochemical dissolved gas quantification | Identifies arcing, Überhitzung, insulation decomposition |
| Moisture-in-Oil | Capacitive/Optical Moisture Probe | Dielectric/absorption shift with water content | Spannungsfestigkeit, paper aging, PD propensity |
| Teilentladung | UHF Antenna Sensor | Electromagnetic emission 300 MHz–3 GHz | Early insulation defect detection; localization with TDOA |
| Vibration | Accelerometer | Piezoelectric response to motion | Core looseness, OLTC anomalies, fan imbalance |
| Load Current/Voltage | CT/VT, Rogowski, Hall Sensors | Electromagnetic induction/Hall effect | Korrelation der thermischen Spannung; harmonische Analyse |
| Umgebungsfeuchtigkeit/-temperatur | Digitale Hygrothermie | Kapazitive Luftfeuchtigkeit, Bandlückentemperatur | Klimakontext für Leistungsreduzierung und Alarmoptimierung |
| Ölstand/-druck | Float/kapazitiv; Druckwandler | Verschiebung/Membranverformung | Leckerkennung; PRD-Bedingungen |
| Rauch-/Bogenlicht | Optischer/UV-Sensor | Streulicht/UV-Emission | Sofortige Gefahrenerkennung und Auslöselogik |
7.2 Datenqualität und -platzierung
- Platzierung ist wichtig: Wicklungen erfordern eingebettete Faserrouten; UHF-Antennen in der Nähe von Durchführungen und Kabelköpfen; Feuchtigkeitssonden in Umlaufölleitungen; Beschleunigungsmesser an Kernklemmen.
- Kalibrierung und Drift: Werkskalibrierung plus jährliche Überprüfung; DGA mit Laborproben abgeglichen; Faseroptische Sensoren verfügen über inhärent stabile Referenzen.
- Synchronisation: Der GPS/PTP-Zeitabgleich ist für die PD-Triangulation und Ursache-Wirkungs-Studien von wesentlicher Bedeutung (z.B., Lastimpulse vs. Temperaturspitzen).
7.3 Multisensor-Fusion
A single parameter rarely tells the whole story. The strongest diagnosis comes from correlating channels:
- Hot-spot ↑ + DGA (C2H2) ↑ → probable arcing at OLTC or winding leads.
- Moisture ↑ + PD bursts → surface tracking risk on paper–oil interfaces.
- Vibration shift + fan current ↑ → cooling fan bearing wear or imbalance.
- Harmonics ↑ + temperature ↑ → non-linear loads driving extra copper losses.
For OEMs and agents in Vietnam and Indonesia: we provide sensor layout templates for 10–220 kV classes, tailored for marine/coastal exposure and high-humidity substations, plus localized documentation for commissioning teams.
8. Fiber Optic Temperature Monitoring for Transformer Windings
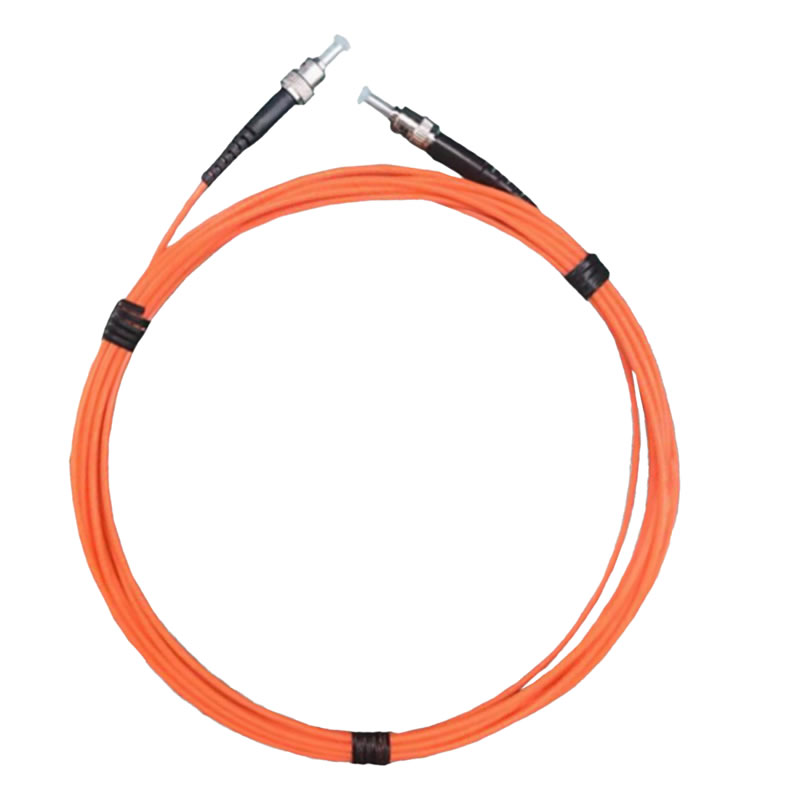
Temperaturüberwachung über Glasfaser delivers direct, high-precision hot-spot readings inside transformer windings and core packs. Fluorescence decay thermometry is immune to electromagnetic interference, making it ideal for high-current, high-field areas where electrical sensors struggle. Real-time hot-spot visibility enables accurate thermal aging models, dynamic loading strategies, and automated fan/pump control, which are crucial for networks in hot, humid regions across Vietnam and Indonesia.
8.1 Why Fiber Optics for Hot-Spot Sensing
- Direct contact with hot-spot: Probes are embedded during manufacturing or installed along cooling ducts to track the most thermally stressed conductors.
- EMI-Immunität: Optical interrogation avoids induction noise and RF pickup near busbars and OLTC chambers.
- Schnelle Reaktion: Millisecond-level acquisition captures rapid temperature excursions during step load changes or faults.
- Stability in oil: Fluorescent probes are designed for long-term stability in mineral and ester oils.
8.2 Typical Deployment and Multipoint Layout
Large power transformers commonly use 3–12 probes across phases and winding sections. Placement prioritizes hot ducts, upper radial spacers, and areas near lead exits. For integrated systems, the fiber interrogator connects to the same DAU used for DGA, UHF PD, und Vibration, unifying timestamps and alarm logic.
| Standort | Objective | Notizen |
|---|---|---|
| HV Winding Inner/Outer | Track highest copper losses and eddy hotspots | Use multiple probes for axial gradient profiling |
| LV Winding Hot Duct | Capture thermal bottlenecks during high load | Ideal for dynamic fan control schemes |
| Core Clamp Region | Identify localized core heating | Correlate with vibration changes |
8.3 Control Actions from Hot-Spot Data
- Adaptive cooling: Start/stop fans per hot-spot thresholds rather than top-oil alone.
- Lastmanagement: Derate or redistribute feeders when hot-spot exceeds allowable limits.
- Aging estimation: Real-time calculation of insulation loss-of-life for asset planning.
Implementation note for OEMs in Bac Ninh and Surabaya: provide factory-installed fiber routing guides and acceptance test templates. Our platform supports per-probe alarm bands and IEC-based thermal models for life consumption.
9. Analyse gelöster Gase (DGA) and Oil Quality Monitoring

Analyse gelöster Gase detects chemical fingerprints of faults by measuring gases such as H2, CO, CO2, CH4, C2H2, C2H4, und C2H6. Online DGA sensors provide continuous tracking, while periodic lab tests validate calibration and assess broader oil health metrics (Säure, Grenzflächenspannung, furans). In tropical grids, moisture rise and oxidation can accelerate gas formation, so real-time observation is particularly valuable.
9.1 Interpreting Gas Signatures
- Wasserstoff (H2): General fault indicator; early PD or overheating.
- Acetylen (C2H2): Strong sign of arcing, often linked to OLTC or lead issues.
- Ethylene/Ethane (C2H4/C2H6): Thermische Fehler; correlates with hot-spot and load cycling.
- CO/CO2: Zelluloseabbau; Papieralterung und Feuchtigkeitsstress.
9.2 Ölqualität und Feuchtigkeit
Öl fungiert sowohl als Dielektrikum als auch als Kühlmittel. Qualitätsmetriken – Säuregehalt (BRÄUNEN), dielektrische Durchschlagsspannung, Grenzflächenspannung – weisen auf Oxidation und Kontamination hin. Feuchtigkeit im Öl verringert direkt die Durchschlagsfestigkeit und fördert die PD. Online-Feuchtigkeitssonden und regelmäßige Karl-Fischer-Laborergebnisse sorgen zusammen für eine zuverlässige Übersicht.

| Ölmetrik | Zweck | Überwachungsmethode |
|---|---|---|
| Gelöste Gase | Identifizierung des Fehlertyps | Online-DGA + vierteljährliche Laborbestätigung |
| Feuchtigkeit (ppm) | Dielektrischer Spielraum, paper aging | Online-Feuchtesonde + Labor KF |
| Säure (BRÄUNEN) | Oxidationsverlauf | Labortests halbjährlich |
| Durchbruchspannung | Prüfung der Isolationsfestigkeit | Labor-BDV-Test |
9.3 DGA + Andere Kanäle = Stärkere Diagnose
- DGA (C2H2) ↑ + UHF PD ↑: Kombinierter Beweis für Lichtbogenbildung; Überprüfen Sie den OLTC und die Leitungen.
- CO/CO2 ↑ + Hotspot ↑: Unter thermischer Belastung beschleunigt sich die Alterung des Papiers; Bewertung Kühlung.
- Moisture ↑ + PD bursts: Gefahr der Oberflächenverfolgung; Erwägen Sie Verbesserungen bei der Trocknung und Versiegelung.
Regionaler Hinweis: coastal installations in Da Nang and Makassar often show faster moisture ingress; our algorithms include climate-aware thresholding to reduce nuisance alarms.
10. Teilentladung (UHF) Detection and Insulation Faults

UHF PD monitoring captures electromagnetic emissions (300 MHz–3 GHz) from micro-discharges that precede insulation breakdown. It works under load without intrusive connections and resists low-frequency noise from switching and harmonics. In conjunction with time-of-arrival methods, multi-antenna arrays can localize PD sources to specific bushings, führt, or winding segments.
10.1 PD Phenomena and Patterns
- Internal PD: Voids in paper/epoxy; sporadic but energy accumulates.
- Surface PD: Tracking on insulation interfaces; sensitive to humidity.
- Krone: High-field tip effects; often lower energy but persistent.
10.2 PD Severity and Trending
Because PD varies with load, Temperatur, und Feuchtigkeit, trends matter more than snapshots. Our platform tracks pulse rate, Größe, clustering, and phase relation, then correlates with hot-spot and moisture to assign severity levels.
| Indikator | Insight | Aktion |
|---|---|---|
| PD Count Rate ↑ | Growing discharge activity | Planen Sie die Inspektion; verify humidity control |
| High-Magnitude Bursts | Possible arcing episodes | Immediate condition check; DGA validation |
| Phase-Correlated Pulses | Load-angle sensitive defect | Examine winding stress points/leads |
10.3 Practical Deployment in SEA
In Vietnam’s urban substations and Indonesia’s coastal plants, antennas are positioned near bushings, Kabelköpfe, and OLTC compartments. Shielded coax with short runs and robust grounding minimizes RF loss. Automatic noise classification excludes radio interference and corona from outdoor fittings when non-critical.

11. Mechanical and Environmental Condition Monitoring
Electrical health is inseparable from mechanical and environmental context. Vibration, akustisch, Luftfeuchtigkeit, und Umgebungstemperatur channels provide the backdrop for interpreting electrical and chemical data.
11.1 Vibration und Akustik
- Core clamp accelerometers: Detect loose laminations, magnetostriction shifts, und Resonanz.
- OLTC acoustic signature: Learn normal operation “fingerprints”; detect contact bounce or misalignment.
- Fan/pump condition: Characterize bearing wear via spectral analysis; cross-check against current draw.
11.2 Environmental Context
- Ambient RH/temperature: Humidity spikes raise PD susceptibility; high ambient reduces cooling margin.
- Enclosure conditions: Cabinet heaters and dehumidifiers keep electronics within rated limits.
- Salt spray/corrosion: Coastal stations require stainless enclosures and coated radiators.
11.3 Example Correlations
- Vibration ↑ + OLTC operation count ↑: Inspect tap changer contacts and diverter switch.
- Ambient temp ↑ + hot-spot ↑ without load change: Tune thermal alarm bands seasonally.
- Humidity ↑ + PD count ↑: Improve sealing; consider breather maintenance and drying cycle.
12. Transformer Alert and Protection Functions
The alert layer translates analytics into actions. Multi-level notifications and control outputs protect equipment and staff while minimizing nuisance trips.
12.1 Alarm Levels
- Advisory: Trend deviation; log event, notify via dashboard.
- Warnung: Threshold exceeded; SMS/email to duty engineers; schedule inspection.
- Kritisch: Rapid escalation or multi-symptom fault; local siren/beacon; remote alarms to SCADA; initiate safe state.
12.2 Automated Actions
- Cooling control: Fan/pump start on hot-spot thresholds or rate-of-rise logic.
- Environmental control: Dehumidifier/heater activation for cabinets and RMUs.
- Interlocking: Trip commands routed through protection relays for arc/smoke events.
| Auslösen | Logic | Aktion |
|---|---|---|
| Hot-spot ≥ setpoint | Hysteresis + min-on time | Start fans; notify operator |
| DGA acetylene spike | Delta vs. Grundlinie + PD corroboration | Critical alarm; OLTC inspection ticket |
| Smoke/arc detected | Sofort, non-latching | Trip interlock; site evacuation alarm |
Service note for agents in Hanoi and Bandung: our controller exposes both dry contact and high-current relay outputs (Wechselstrom 220 V/10 A) for direct control wiring, plus event acknowledgments to SCADA.
13. Communication and SCADA Integration
Interoperability determines operational value. The platform supports station standards and cloud pathways to ensure data reaches decision-makers securely and promptly.
13.1 Protocols and Data Models
- IEC 61850: MMS for supervisory data; GOOSE for events; SCL for data model portability.
- Modbus TCP/RTU: Schnell, simple mapping for PLC/DCS environments.
- OPC UA: Vendor-neutral integration across enterprise layers.
- MQTT: Lightweight publish/subscribe for IoT backhaul over 4G/5G.
13.2 Time Synchronization and Historian
Accurate correlation hinges on time. GPS or IEEE 1588 PTP aligns edge devices; historian archives include tags for quality flags, versioning, and calibration references. Event replay tools let engineers reconstruct pre-fault conditions.
13.3 Cybersicherheit
- Segmentation: Separate OT/IT VLANs and firewalled conduits; least-privilege access.
- Encryption & auth: TLS for remote access; role-based accounts and audit logs.
- Update policy: Digitally signed firmware; scheduled patch windows; rollback images onsite.
13.4 Control Room Views
- Single-line overlay: Health badges on each transformer and feeder.
- Alarm wall: Severity-based tiles with color coding and acknowledge/escalate workflow.
- Trend workbench: Multi-signal overlays (Hotspot, DGA, PD, laden) with correlation cursors.
14. Predictive Maintenance and AI Data Analytics
Prädiktive Analysen converts streams into foresight. Statistical models, physics-informed digital twins, and machine learning work together to forecast risk and remaining useful life (RUL).
14.1 Model Types
- Thermal aging models: Arrhenius-based life consumption from hot-spot histories.
- Gas ratio diagnostics: Rule-based and data-driven hybrids to refine fault classification.
- PD-Trendklassifikatoren: Clusterbildung und Anomalieerkennung bei Pulsmerkmalen und Phasenmustern.
- Mechanische Analytik: Spektrale Fingerabdrücke für Lüfter/Pumpen und OLTC-Akustik.
14.2 Datenfusion
KI-Ebenen kombinieren unabhängige Kanäle zu einem konsolidierten Transformer-Gesundheitsindex (THI). Die Vertrauensbewertung berücksichtigt die Sensorqualität, Betriebsart (laden, Umgebung), und aktuelle Wartung. Die THI unterstützt das Flottenranking, Priorisierung von Arbeitsaufträgen, und Ausfallrisikosimulationen.
14.3 Von der Einsicht zum Handeln
- Erkennen: Klassifikator markiert Abweichung (z.B., PD-Cluster-Wachstum).
- Diagnostizieren: Überprüfen Sie dies mit DGA und Hotspot, um die wahrscheinliche Ursache zu ermitteln.
- Entscheiden: Inspektion empfehlen, Ölverarbeitung, oder Lastkürzung.
- Versenden: Erstellen Sie automatisch Arbeitsaufträge mit Teileliste und Sicherheitsschritten.
14.4 Südostasien – spezifische Überlegungen
- Anpassung der Monsunzeit: Dynamische Schwellenwerte für Feuchtigkeits-/Umgebungstemperaturschwankungen.
- Blitzdichtekarten: Überlagern Sie Impulsereignisse, um PD-Spitzen zu kontextualisieren.
- Coastal corrosion indices: Weight enclosure and radiator condition in THI.
Engagement note: request our demo workspace to visualize THI, PD trend overlays, and climate-adaptive thresholds tailored for Vietnamese and Indonesian sites.
15. Smart Transformer Monitoring in IoT Systems
IoT-native architectures extend real-time transformer monitoring beyond the substation fence, enabling secure data sharing, Ferndiagnose, and fleetwide optimization. A layered design separates field acquisition, Edge-Analyse, and cloud applications to balance latency, bandwidth, and cybersecurity.
15.1 IoT Reference Architecture
- Feldschicht: Sensoren, DAUs, and controllers at the transformer; deterministic sampling, local alarms, and buffering.
- Edge Layer: Gateway with protocol translation (IEC 61850, Modbus, OPC UA), data quality checks, TLS tunnels, and store-and-forward.
- Cloud Layer: Time-series database, analytics engine, model registry, dashboards, and role-based access for multi-site users.
15.2 Connectivity Options
| Backhaul | Stärken | Überlegungen |
|---|---|---|
| Faser | High bandwidth, geringe Latenz | CAPEX for trenching; ideal for campuses and utilities |
| 4G/5G | Schnelle Bereitstellung; rural reach | Carrier SLAs; VPN/APN for OT isolation |
| Mikrowelle | Point-to-point for remote yards | Line-of-sight planning; weather effects |
15.3 Cloud Applications
- Fleet Health Index: Compare THI across assets and prioritize interventions.
- Anomaly Feeds: Stream PD bursts, DGA spikes, and hot-spot excursions to an incident wall.
- Model Lifecycle: Track versioned ML models, drift metrics, and re-training schedules.
15.4 Operational Use Cases
- Remote Expert Assist: Engineers in Hanoi or Jakarta guide site teams via live dashboards and embedded procedures.
- OEM Warranty Analytics: Evidence-based decisions using operating histories and alarm root causes.
- Contracted Monitoring: Service providers deliver 24/7 oversight for industrial parks and IPPs.
16. Types of Monitoring Systems (Online, Tragbar, Integriert)
Selection depends on risk profile, asset criticality, und Budget. Systems often coexist within the same fleet.
16.1 Online Continuous Monitoring
- Umfang: Hot-spot fiber optics, DGA, Feuchtigkeit, UHF PD, Vibration, laden, Umgebung.
- Best for: GSU units, 110–220 kV substations, critical industrial feeders.
- Strength: Real-time risk mitigation and automated response.
16.2 Portable and Semi-Online
- Umfang: Periodic PD scans, handheld DGA sampling, Wärmebildtechnik.
- Best for: Smaller distribution units and budget-limited sites.
- Strength: Niedrigere Kosten; complements continuous systems.
16.3 Integrated Smart Transformers (Factory-Fitted)
- Umfang: OEM-installed probes, Vernehmer, Gateways, and enclosure kits.
- Best for: New builds and expansions seeking plug-and-play digitalization.
- Strength: Simplified commissioning, optimized sensor placement, and warranty alignment.
16.4 Hybrid Strategy
Many utilities adopt a hybrid approach: online systems for top-critical assets, portable diagnostics for the remainder, and progressive retrofits aligned with maintenance windows.
17. Transformer Case Studies in Vietnam and Indonesia
These cases illustrate climate-aware monitoring, rapid alerting, and predictive decisions that prevented outages and optimized maintenance.
17.1 Vietnam — Industrial Park 110 kV Substation
- Herausforderung: Frequent humidity spikes and high load growth causing hot-spot excursions.
- Lösung: Online fiber hot-spot, DGA, Feuchtigkeit im Öl, UHF PD; edge analytics with climate-adaptive thresholds.
- Ergebnis: 45% reduction in thermal alarms after adaptive fan control; early OLTC arcing detected via C2H2 surge + PD confirmation; planned diverter maintenance avoided unplanned shutdowns.
17.2 Vietnam — Coastal City Distribution
- Herausforderung: Salt spray corrosion and moisture ingress degrading oil dielectric margins.
- Lösung: Moisture probes, breather maintenance alerts, periodic oil processing triggers from analytics.
- Ergebnis: Breakdown voltage restored within two weeks, PD counts stabilized despite monsoon season.
17.3 Indonesia — Java Island Power Plant GSU
- Herausforderung: OLTC contact wear under daily regulation cycles; episodic acetylene spikes.
- Lösung: Continuous DGA with OLTC operation counters; UHF antennas localized events near the diverter.
- Ergebnis: Maintenance executed during planned outage; no forced derating; spare parts usage forecast improved.
17.4 Indonesia — Manufacturing Hub (East Java)
- Herausforderung: Bearing noise and vibration in aged cooling fans leading to hot-spot hikes at night shifts.
- Lösung: Vibration spectral monitoring and fan current analytics; auto-swap to standby fans.
- Ergebnis: Hot-spot excursions reduced by 60%; energy efficiency gains from predictive fan maintenance.
17.5 Shared Lessons
- Feuchtigkeit + PD is a recurrent pattern in tropical yards; sealing and drying programs must be data-driven.
- OLTC analytics are critical for grids with frequent voltage regulation—combine DGA and operation signatures.
- Climate-aware thresholds reduce nuisance alarms and focus attention on actionable events.
18. Installation and Setup Guidelines
Successful deployment depends on disciplined installation, Inbetriebnahme, and change control. The following checklist streamlines field work for EPCs and OEM partners.
18.1 Planung vor der Installation
- Asset Survey: Nameplate data, wiring drawings, OLTC type, Öltyp, cooling class, enclosure ingress protection.
- Sensor Plan: Fiber probe routes, UHF antenna locations, moisture and DGA ports, accelerometer points.
- Network Design: Protocol selection, addressing, VLAN segmentation, time-sync source (GPS/PTP).
18.2 Mechanical and Electrical Works
- Montage: Stainless hardware for coastal sites; anti-vibration mounts for DAUs and gateways.
- Cabling: Shielded coax for UHF; oil-compatible fiber sheaths; gland sealing to prevent moisture ingress.
- Leistung: Dedicated DC rails for sensors; surge suppressors for lightning-prone regions.
18.3 Inbetriebnahme und Validierung
- Kalibrierung: Verify fiber channels, simulate PD pulses, check DGA baselines against lab samples.
- Datenintegrität: Confirm timestamps, tag mapping, historian retention policies, and quality flags.
- Alarm Tests: Execute hot-spot, DGA, PD, and smoke/arc alarm drills; validate fan/pump interlocks.
18.4 Documentation and Handover
- As-Built Records: Sensor map, wiring schedules, firmware versions, and configuration backups.
- Ausbildung: Operator and maintenance workshops; step-by-step SOPs for common interventions.
- Service Schedule: Annual calibration plan, software update cadence, and cyber patch windows.
18.5 Typical Pitfalls and Remedies
| Pitfall | Symptom | Remedy |
|---|---|---|
| Poor UHF grounding | High noise floor; false PD events | Shorter coax runs; star-ground; ferrites at gateway |
| Fiber probe misplacement | Hot-spot underestimation | Re-route along hot ducts; validate during load test |
| Moisture probe dead zones | Flat readings despite issues | Install in circulating oil paths; correlate with KF lab tests |
| Loose fan current wiring | Intermittent fan alarms | Crimp quality check; add cable strain relief |
19. Häufig gestellte Fragen (Extended Technical FAQ)
Q1. How is a health index (THI) computed from diverse sensors?
The THI is a weighted composite of thermal, chemisch, elektrisch, mechanisch, and environmental indicators. Gewichte passen sich dem Betriebskontext an – z., während der Monsunzeit, Feuchtigkeitskanäle gewinnen an Gewicht. Vertrauensfaktoren spiegeln Sensorqualitätsmarkierungen und aktuelle Kalibrierungen wider.
Q2. Was ist der minimal brauchbare Sensorsatz für kleine Verteilungstransformatoren??
Für 10–1600 kVA-Geräte: Oberöltemperatur, Laststrom, relative Luftfeuchtigkeit/Temperatur der Umgebung, und mindestens Feuchtigkeit im Öl oder regelmäßige Ölprüfungen im Labor. Fügen Sie UHF PD für Kabelabschlüsse in verschmutzten Gebieten oder Küstengebieten hinzu.
Q3. Wie unterscheidet man eine harmlose Korona von einer kritischen Parkinson-Krankheit??
UHF-Signaturen von Korona sind typischerweise energieärmer und weisen einen deutlichen Frequenzinhalt auf. Die Analysen korrelieren mit der Umgebungsfeuchtigkeit und dem Standort; Das Fehlen einer DGA-Reaktion und das Fehlen einer phasenorientierten Clusterbildung unterstützen die Koronaklassifizierung.
Q4. Unterstützen Sie Nachrüstungen ohne Tanköffnung??
Ja. Klemmbare UHF-Antennen, externe Feuchtigkeitshähne, and fiber routing that avoids active windings are used. Some features (embedded hot-spot fiber) require OEM installation during manufacture.
F5. How often should online DGA be validated?
Quarterly lab samples are common; more frequent in the first months after commissioning or after oil processing. The platform tracks drift and prompts validation when confidence drops.
F6. Can alerts trigger automated protective actions?
Ja. Alarms can start fans/pumps, enable cabinet dehumidifiers, or send trip interlocks to protection relays for smoke/arc events. All actions are logged and require operator acknowledge in SCADA.
F7. What cybersecurity measures protect remote access?
TLS tunnels, VPN/APN segregation, role-based accounts, MFA for administrative users, and signed firmware. Audit logs and configuration snapshots support incident response.
F8. What special considerations apply to coastal Vietnam and Indonesia?
Use stainless enclosures, coated radiators, IP66/67 glands, and regularly maintain breathers. Thresholds should account for high ambient and humidity, and UHF grounding must be meticulous to avoid salt-induced corrosion artifacts.
F9. How does the system help with warranty and root-cause analysis?
Historian timelines, synchronized events, and sensor quality flags provide a forensic trail. OEMs and operators can establish whether overload, Umfeld, or component wear drove the event.
F10. Which standards are most relevant?
IEC 61850 (Kommunikation), IEC/IEEE C57 series (Transformatoren), IEC 60270/62478 (PD), ISO 9001 (Herstellung), und lokale Netzvorschriften. The system data model maps to these standards for integration and compliance.
F11. Is thermal imaging still useful if I have fiber hot-spot?
Ja. Thermal cameras rapidly screen radiators, Buchsen, and cable heads for external anomalies. Fiber hot-spot confirms internal conductor temperatures; both perspectives are complementary.
F12. How do you localize PD sources?
Install multiple UHF antennas and apply time-difference-of-arrival (TDOA) and amplitude triangulation. Cross-validate with DGA acetylene and inspection findings for bushing vs. winding differentiation.
20. About Our Factory and Technical Solutions
We are a certified manufacturer of real-time transformer health monitoring and alert systems for utilities, IPPs, and industrial networks across Southeast Asia. Our portfolio covers sensors, DAUs, Controller, and analytics—engineered for tropical climates and coastal conditions.
What We Provide
- Fluorescence-based fiber optic hot-spot systems
- Online DGA and moisture-in-oil monitors
- UHF partial discharge antennas and high-speed acquisition
- Vibration, fan/pump current, ambient RH/temperature modules
- Edge gateways with IEC 61850, Modbus TCP/RTU, OPC UA, MQTT
- SCADA-Dashboards und Cloud-Analysen mit flottenweitem THI
Warum sich Partner in Vietnam und Indonesien für uns entscheiden
- Tropentechnik: IP66/67-Gehäuse, Beschichtete Hardware, Überspannungsschutz in Blitzschutzqualität.
- Interoperabilität: Nahtlose SCADA-Integration und mehrsprachige HMIs.
- Service: Inbetriebnahme-Kits, Bedienerschulung, und Modellabstimmung für lokale Klimazonen.
Holen Sie sich technische Dateien und Angebote
Datenblätter anfordern, Schaltpläne, und auf Ihre Spannungsklasse zugeschnittene Inbetriebnahme-Checklisten. Unser Engineering-Team unterstützt die OEM-Integration, EPC-Projekte, und Nachrüstungsprogramme für Fabriken und Versorgungsunternehmen in Vietnam und Indonesien.
Wir sind ein Fabrikhersteller– kein Wiederverkäufer. Jede Einheit wird nach internationalen Standards zusammengebaut und getestet, mit Kalibrierprotokollen und nachvollziehbarer Qualitätssicherung. Kontaktieren Sie uns, um eine zuverlässige aufzubauen, datengesteuerte Überwachungsarchitektur für Ihre Transformatorenflotte.

Faseroptischer Temperatursensor, Intelligentes Überwachungssystem, Verteilter Glasfaserhersteller in China
 |
 |
 |