 Оптоволоконні датчики температури INNO ,системи контролю температури.
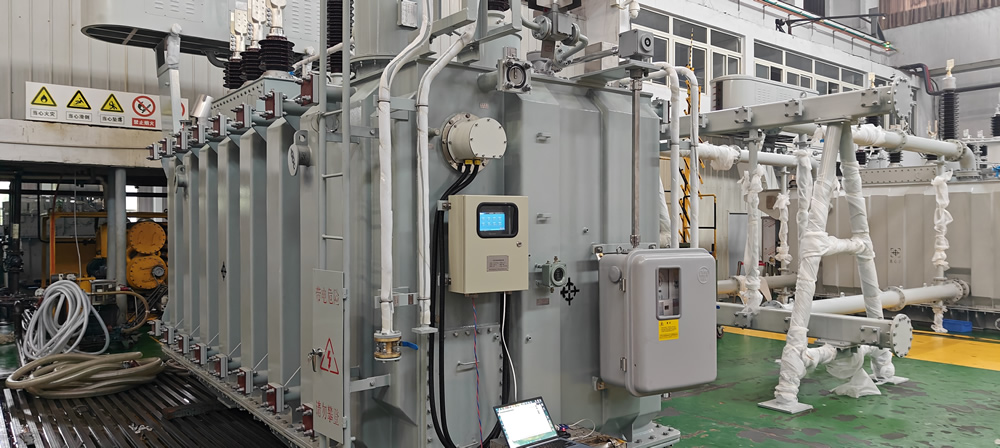
- Контроль температури підсистема: Волоконно-оптичні датчики відстежують гарячі точки обмотки та температуру масла в режимі реального часу
- Аналіз розчинених газів (DGA) підсистема: Постійний моніторинг концентрації розчиненого газу в трансформаторному маслі
- Підсистема моніторингу часткових розрядів: УВЧ і акустичні датчики виявляють дефекти ізоляції
- Підсистема контролю втулки: Вимірює ємність, коефіцієнт дисипації, і струм крана
- Перемикач РПН під навантаженням (РПН) підсистема моніторингу: Аналізує вібрацію, часові послідовності, і контактний опір
- Блоки збору даних: Багатоканальна синхронна вибірка з локальною буферизацією даних
- Комунікаційні шлюзи: Підтримка Modbus, DNP3, та IEC 61850 протоколи
- Платформа аналізу та діагностики: Хмарний або локальний сервер для обробки даних і оцінки стану здоров’я
Зміст
1. Поширені типи несправностей трансформаторів і першопричини

Несправності трансформаторів представляють критичні події, які каскадом можуть призвести до масових відключень електроенергії, значні пошкодження обладнання, і тривалі збої в роботі. Розуміння основних механізмів відмови допомагає комунальним підприємствам ефективно впроваджувати стратегії онлайн-моніторингу які виявляють проблеми, що розвиваються, до того, як відбудуться катастрофічні поломки.
Несправності при перегріві: Термічна напруга та старіння ізоляції
Теплові збої припадає приблизно 30-35% of all transformer breakdowns, originating from various heat-related mechanisms. Excessive loading beyond nameplate ratings generates temperature rises that accelerate insulation aging through chemical decomposition of cellulose paper and mineral oil. Cooling system failures including blocked radiators, несправні вентилятори, or inadequate oil circulation create localized hot spots even under normal loading conditions. Poor electrical connections at bushing terminals, контакти РПН, or internal joints produce resistive heating that compounds thermal stress. The Arrhenius equation demonstrates that insulation life halves for every 6-8°C temperature increase above rated levels, making thermal management critical for transformer longevity.
Insulation Failures: Dielectric Breakdown Mechanisms
Деградація ізоляції represents 25-30% of transformer failures, manifesting through multiple deterioration pathways. Partial discharge activity in gas voids, oil bubbles, or interface boundaries progressively erodes solid insulation, creating carbonized tracking paths that eventually bridge high voltage and ground. Oil quality deterioration through oxidation, забруднення, or moisture ingress reduces dielectric strength below critical thresholds. Moisture absorption into cellulose insulation lowers breakdown voltage while accelerating thermal aging rates. These mechanisms often develop gradually over months or years, providing opportunities for early detection through continuous monitoring.
Механічні несправності: Structural and Operational Issues
Mechanical problems constitute 15-20% of failures, including winding displacement from short circuit forces, core bolt loosening causing excessive magnetostriction noise, and tap changer wear from repeated operations. Through-fault currents generate electromagnetic forces exceeding 100 times normal operating levels, potentially shifting winding conductors and compromising insulation clearances. Tap changer mechanisms contain numerous moving parts subject to contact erosion, весняна втома, and drive mechanism wear. Transportation damage, manufacturing defects, or seismic events can initiate mechanical problems that worsen during operation.
Bushing Failures: High-Voltage Interface Vulnerabilities
Bushing breakdowns account for 10-15% of transformer failures despite representing relatively small components. Moisture ingress through failed gaskets or breathing mechanisms contaminates the oil-paper insulation system, increasing dissipation factor and accelerating degradation. Manufacturing defects including voids, забруднення, or improper curing create weak points susceptible to partial discharge activity. Зовнішнє забруднення сольовими туманами, промислове забруднення, або біологічне зростання зменшує ізоляцію поверхні, потенційно спричиняючи спалахи. Поломки втулок часто виникають раптово з мінімальним попередженням за допомогою традиційних методів тестування, що робить постійний моніторинг особливо цінним.
Чому традиційні методи тестування не ефективні
Періодичні офлайн тестування виконується щорічно або рідше, фіксує лише миттєві знімки стану трансформатора, відсутність тимчасових подій і поступових тенденцій, що виникають між перевірками. Вимоги до знеструмлення створюють перерви в обслуговуванні, обмежуючи частоту тестування. Відбір проб масла вручну створює ризики забруднення та затримки транспортування перед лабораторним аналізом. Сезонні зміни в навантаженні та температурі ускладнюють тренди, коли вимірювання відбуваються в різний час кожного року. Дослідження показують, що 30-40% of failures develop rapidly between scheduled tests, emphasizing the need for continuous surveillance.
2. Типи та технології датчиків контролю трансформатора

Сучасний системи моніторингу трансформаторів employ diverse sensor technologies, each optimized for specific measurement parameters. Understanding the operating principles, експлуатаційні характеристики, and application considerations helps system designers select appropriate sensors for comprehensive condition assessment.
Датчики температури: Optical vs Electrical Technologies
Флуоресцентні волоконно-оптичні датчики температури utilize rare-earth phosphors deposited at optical fiber tips, emitting temperature-dependent fluorescence when excited by LED pulses. The fluorescence decay time correlates precisely with temperature, achieving ±0.5°C accuracy across -50°C to +300°C ranges. Complete electromagnetic immunity eliminates noise-induced errors while intrinsic safety prevents spark risks in flammable atmospheres. Service life exceeds 25-30 years with zero drift or recalibration requirements.
Волокниста решітка Брегга (FBG) датчики employ wavelength-selective reflectors inscribed in optical fibers, with reflection wavelength shifting proportionally to temperature and strain. Multiple FBG sensors multiplex on single fiber strands, enabling distributed measurements. Accuracy typically reaches ±1°C with excellent long-term stability. Проте, strain sensitivity requires careful mechanical mounting to isolate thermal expansion effects.
Резистивні температурні детектори (RTD) measure temperature through platinum element resistance changes, offering good accuracy (±0.5°C with Pt100 elements) і стабільність. Проте, electrical connections introduce electromagnetic interference susceptibility, requiring shielded cables and careful grounding. Spark risks necessitate intrinsically safe barriers in hazardous areas. Lead wire resistance creates measurement errors unless four-wire configurations compensate.
| Тип датчика | Точність | Час відгуку | EMI імунітет | Термін служби | Внутрішня безпека |
|---|---|---|---|---|---|
| Флуоресцентна волоконна оптика | ±0,5°C | 1-2 секунд | Повний | 25-30 років | так |
| Волокниста решітка Брегга | ±1,0°C | 0.1-1 другий | Повний | 20-25 років | так |
| RTD (Pt100) | ±0,5°C | 5-15 секунд | Сприйнятливий | 10-15 років | Вимагає бар'єрів |
| Термопара | ±2,0°C | 1-5 секунд | Сприйнятливий | 5-10 років | Вимагає бар'єрів |
Gas Sensors: DGA Monitoring Technologies
Photoacoustic spectroscopy (НІ) датчики detect gas concentrations through acoustic waves generated when modulated infrared light excites gas molecules. Multi-wavelength systems simultaneously measure hydrogen, метан, етилен, ацетилен, чадний газ, and carbon dioxide with detection limits below 1 ppm. Minimal consumables and automatic self-calibration provide maintenance-free operation for 2-3 years between service intervals.
Gas chromatography systems separate dissolved gases through carrier gas circulation and molecular sieve columns, injecting samples into thermal conductivity or flame ionization detectors. Laboratory-grade accuracy (±5% or ±2 ppm) enables precise fault diagnosis. Проте, carrier gas cylinders require periodic replacement, and complex pneumatic systems need regular maintenance.
Electrochemical sensors generate current proportional to gas concentration through oxidation-reduction reactions at electrode surfaces. Low-cost and compact designs suit basic hydrogen monitoring applications. Limited selectivity, shorter service life (1-3 років), and sensitivity drift require frequent calibration compared to optical methods.
Partial Discharge Sensors: Electrical and Acoustic Detection
Надвисока частота (УВЧ) antennas capture electromagnetic waves in 300 MHz to 3 GHz range generated by PD pulses. Internal sensors installed through oil drain valves or external antennas mounted on viewing windows detect discharge activity with excellent sensitivity while rejecting low-frequency interference. Signal processing algorithms classify discharge patterns and track severity trends.
Acoustic emission sensors detect ultrasonic waves (20-300 кГц) propagating through oil and tank walls from discharge sites. П'єзоелектричні акселерометри або акустичні хвилеводи перетворюють хвилі тиску в електричні сигнали. Матриці з кількома датчиками дають змогу використовувати алгоритми тріангуляції, які обчислюють розташування джерел часткових розрядів із точністю ±10 см. Комбіновані електроакустичні системи використовують додаткові переваги як для чутливості, так і для локалізації.
Трансформатори струму високої частоти (HFCTs) затиск навколо заземлюючих провідників, вимірювання перехідних струмів, що протікають під час розряду. Ненав'язлива установка без модифікації втулки спрощує модернізацію. Чутливість залежить від конфігурації заземлення трансформатора та місця розряду відносно точок вимірювання.
Електричні датчики: Вимірювання ємності та струму
Ємнісні дільники напруги підключити до вхідних тестових кранів, вимірювання ємності (C1) і коефіцієнт дисипації (загар δ) що вказує на стан ізоляції. High-precision capacitance bridges achieve 0.1 pF resolution detecting subtle degradation trends. Continuous monitoring tracks changes over time, providing months of advance warning before critical failures.
Трансформатори струму measure tap currents flowing through bushing capacitance structures, indicating abnormal insulation behavior. Rogowski coils or core-type CTs provide accurate current measurement across wide frequency ranges. Comparing tap current against applied voltage variations distinguishes load-related changes from genuine insulation problems.
Mechanical Sensors: Vibration and Motion Detection
Piezoelectric accelerometers mounted on OLTC tanks capture mechanical vibration signatures during tap change operations. Frequency domain analysis from 10 Hz to 10 kHz identifies abnormal patterns associated with worn components, зміщення, or inadequate lubrication. Трьохосьові датчики виявляють вібрацію в кількох напрямках для комплексної механічної оцінки.
Перетворювачі переміщення вимірювання лінійного або обертального руху механізмів приводу перемикача РПН, перевірка належної послідовності операцій і виявлення механічного зв’язування. Індуктивні або оптичні кодери забезпечують зворотний зв'язок позиції, що дозволяє аналізувати синхронізацію та підраховувати операції. Інтеграція з моніторингом струму двигуна створює повні системи оцінки стану РПН.
3. У реальному часі Моніторинг температури: Перша лінія захисту від перегріву

Контроль температури є основою оцінки стану трансформатора, прямо корелює зі швидкістю старіння ізоляції, вантажопідйомність, і виявлення теплової несправності. Постійне спостереження дозволяє операторам оптимізувати завантаження, одночасно запобігаючи шкідливим перегрівам, які прискорюють деградацію обладнання.
Відстеження температури гарячої точки обмотки
Моніторинг гарячих точок фокусується на критичних місцях обмотки, які зазнають максимального теплового навантаження, зазвичай у верхній частині диска обмоток високої напруги, де концентрується теплогенерація, а ефективність охолодження зменшується. Пряме вимірювання за допомогою вбудованого пристрою волоконно-оптичні зонди забезпечує точні показники, що перевершують непрямі розрахунки, засновані на температурі оливи у верхній частині та струмі навантаження. Розрахунки посібника з навантаження IEEE C57.91 включають численні припущення щодо ефективності охолодження, геометрія намотування, і термічні постійні часу, які вносять невизначеність 10-15°C в оцінки гарячих точок. Постійні дані про гарячі точки дозволяють приймати точні рішення щодо завантаження, запобігання пошкодженню ізоляції при максимальному використанні активів у періоди пікового попиту.
Волоконно-оптичний датчик температури Переваги
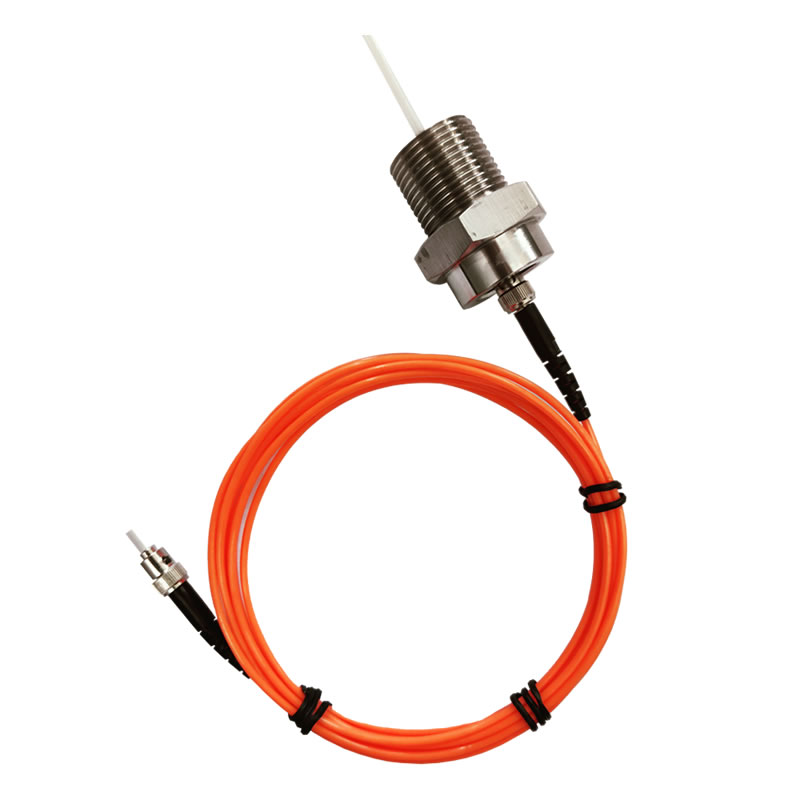
Флуоресцентні волоконно-оптичні датчики забезпечують численні переваги в порівнянні зі звичайними технологіями вимірювання температури. Complete electromagnetic immunity eliminates noise-induced measurement errors common in high-voltage environments where strong electromagnetic fields interfere with electrical sensors. Intrinsic safety with zero electrical energy at sensor tips prevents spark ignition risks, enabling direct installation in flammable oil without special barriers or certifications. The dielectric nature of optical fibers allows direct contact with high-voltage conductors without compromising electrical insulation or introducing measurement errors. Long-term stability with zero drift ensures consistent accuracy throughout 25-30 year service life without recalibration requirements that complicate maintenance scheduling.
Multi-Point Temperature Distribution Monitoring
Комплексний системи контролю температури typically install 12-18 measurement points covering critical locations including top-oil, bottom-oil, multiple winding hot spots at different heights and phases, core surfaces, and tank walls. This distributed approach enables thermal mapping revealing cooling system effectiveness, identifying localized hot spots from circulating currents or blocked oil flow, and detecting asymmetric heating between phases indicating electrical imbalances. Advanced visualization displays color-coded temperature distributions, making thermal anomalies immediately apparent to operators reviewing system dashboards.
Temperature Gradient Analysis
Temperature gradient monitoring between top-oil and bottom-oil measurements indicates cooling system performance, with excessive gradients suggesting radiator fouling, blocked oil passages, or inadequate pump flow. Comparing oil temperature rise against loading profiles helps identify heat exchanger degradation before catastrophic cooling failures occur. Winding-to-oil temperature differences reveal insulation thermal resistance changes from aging, потрапляння вологи, or contamination affecting heat transfer characteristics.
Early Warning Case Example
А 230 kV substation transformer equipped with моніторинг температури в реальному часі displayed gradual hot spot temperature increases over three months despite stable loading patterns. Investigation revealed blocked oil flow from deformed pressboard barriers partially obstructing cooling ducts. Planned maintenance during a scheduled outage cleared the obstruction, preventing catastrophic winding failure that would have required emergency transformer replacement during peak summer demand. The monitoring system provided sufficient advance warning enabling proactive intervention rather than reactive emergency response.
4. Онлайн-аналіз розчинених газів: Раннє виявлення внутрішніх несправностей
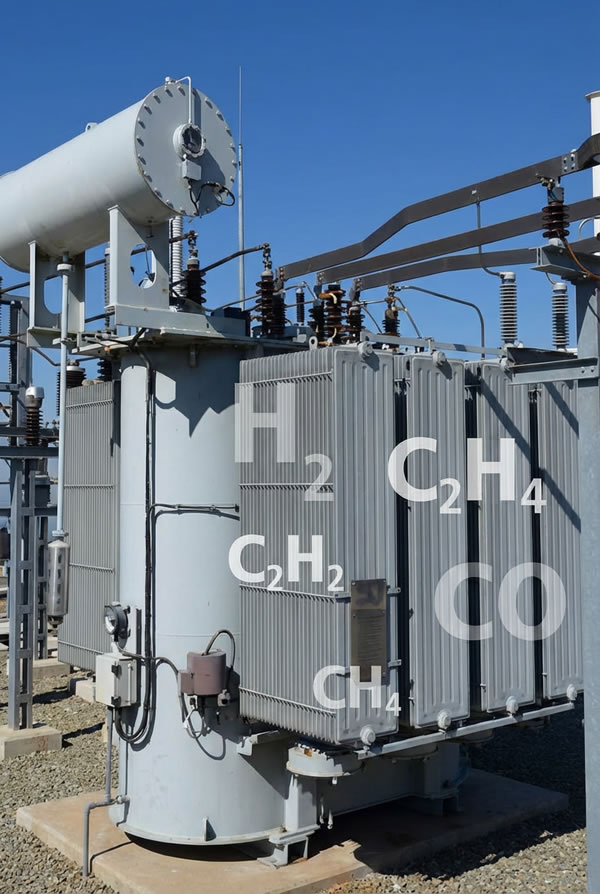
Моніторинг DGA represents the most sensitive diagnostic technique for detecting incipient electrical and thermal faults in oil-filled transformers. Continuous gas analysis captures evolving fault conditions months or years before conventional annual testing would identify problems, enabling intervention when corrective actions remain cost-effective.

Gas-Fault Relationships: Діагностичні підписи
Different fault mechanisms generate characteristic dissolved gas patterns enabling precise fault classification. водень (H₂) indicates partial discharge or corona activity in oil-filled voids or at sharp edges, with concentrations above 100 ppm warranting investigation. Метан (CH₄) and ethane (C₂H₆) suggest low-temperature thermal decomposition below 300°C from loose connections or core heating. Етилен (C₂H₄) signals moderate thermal faults between 300-700°C often associated with circulating currents or localized overheating. Ацетилен (C₂H₂) indicates high-temperature arcing above 700°C, the most serious electrical fault requiring immediate attention. Чадний газ (CO) і вуглекислий газ (CO₂) reveal cellulose insulation degradation from overheating or aging, with elevated CO suggesting more severe thermal stress than CO₂ increases alone.
Continuous Monitoring vs Annual Oil Sampling
Online DGA systems deliver decisive advantages over periodic oil sampling approaches. Continuous surveillance captures rapidly developing faults occurring between scheduled tests, with studies showing 30-40% of failures developing within 6-month intervals between annual samplings. Automatic measurements every 30-60 minutes eliminate manual sampling errors from bottle cleanliness, atmospheric exposure, or transportation contamination. Real-time trending immediately flags accelerating gas generation rates indicating deteriorating conditions, whereas annual snapshots provide insufficient data points for reliable trend analysis. Elimination of sample transportation delays and laboratory turnaround times enables same-day fault detection rather than 1-2 week result delays that may allow faults to progress unchecked.
Key Gas Tracking and Trend Analysis
Continuous gas monitoring tracks absolute concentrations, generation rates (ppm/day), and multi-gas ratios simultaneously. Absolute concentration thresholds from IEEE C57.104 and IEC 60599 standards trigger initial investigations, but generation rate analysis often provides earlier warning. Sudden increases in daily generation rates, even when absolute concentrations remain below alarm levels, indicate developing problems requiring investigation. Multi-gas trending identifies evolving fault patterns, such as hydrogen increases followed by ethylene generation suggesting partial discharge transitioning to thermal faults.
Automated Diagnostic Methods
Сучасний DGA analysis platforms automatically apply diagnostic algorithms including Duval Triangle, Коефіцієнти Роджерса, Dornenburg Ratios, та IEC 60599 Key Gas methods. The Duval Pentagon extends basic triangle analysis to classify additional fault types including thermal faults with oil contact (Т3) and stray gassing. Automated calculations eliminate manual errors while flagging cases where different methods yield conflicting interpretations, alerting specialists to complex situations requiring expert review. Історичне порівняння з базовими лініями для конкретного трансформатора враховує характеристики окремих агрегатів, покращення діагностичної точності порівняно із загальними пороговими значеннями.
5. Онлайн-моніторинг часткового розряду: Чутливий індикатор погіршення ізоляції
![]()
Моніторинг часткових розрядів виявляє дефекти ізоляції на ранніх стадіях до прогресування до повного руйнування діелектрика. Активність ПД свідчить про погіршення якості ізоляції, забруднення, потрапляння вологи, або виробничі дефекти, безперервне спостереження є необхідним для запобігання катастрофічним поломкам критичних трансформаторів.
Механізми часткового розряду та дефекти ізоляції

Частковий розряд виникає, коли локалізовані концентрації електричного поля перевищують міцність ізоляції, викликаючи перехідні імпульси струму та локалізоване розсіювання енергії. Газові порожнечі або бульбашки всередині твердої ізоляції або масла мають нижчу діелектричну міцність, ніж навколишні матеріали, ініціювання повторюваних розрядів за нормальних робочих напруг. Surface discharges along interfaces between insulation materials with different permittivity create tracking paths that gradually carbonize. Corona discharge at sharp edges or conductor points in oil generates gas bubbles and chemical decomposition. Each discharge mechanism produces characteristic electrical and acoustic signatures enabling pattern recognition and severity assessment.
UHF Detection Technology and Acoustic Localization
UHF partial discharge monitoring employs antennas sensitive to 300 МГц – 3 GHz electromagnetic radiation generated by nanosecond-duration discharge current pulses. Internal sensors installed through oil drain valves or magnetic core ground leads capture signals propagating through oil and metallic structures. External antennas mounted on dielectric viewing windows detect electromagnetic emissions through tank walls. Digital signal processing applies time-domain and frequency-domain analysis, extracting PD pulse characteristics from background noise. Pattern recognition algorithms compare measured signatures against discharge type databases, classifying activity as corona, поверхневий розряд, or internal voids.
Acoustic PD detection utilizes piezoelectric sensors mounted on transformer tank exterior surfaces, виявлення ультразвукових випромінювань (20-300 кГц) from discharge sites. Acoustic waves propagate through oil and metal structures, attenuating with distance and frequency. Multi-sensor arrays positioned around tank perimeters enable triangulation algorithms calculating PD source three-dimensional coordinates. Time-difference-of-arrival calculations combined with known acoustic velocities in oil (приблизно 1400 РС) and steel (5000 РС) determine discharge locations within ±10 cm accuracy. Acoustic localization directs maintenance teams to specific internal components for targeted inspection or guides operational decisions about continued service.
Pattern Recognition and Discharge Classification
Частковий розряд із роздільною фазою (PRPD) аналіз generates statistical distribution patterns correlating discharge activity with power frequency phase angle. Corona discharges typically concentrate near positive and negative voltage peaks, appearing as twin peaks in PRPD plots. Surface discharges generate asymmetric patterns favoring one voltage polarity. Internal void discharges show activity across wider phase ranges with magnitude increasing at voltage peaks. Machine learning algorithms trained on extensive PD databases automatically classify patterns, improving diagnostic consistency compared to subjective manual interpretation. Long-term trending tracks pattern evolution, identifying whether discharge activity remains stable, increases steadily, or responds to environmental factors like temperature and loading.
6. Моніторинг втулок: Запобігання катастрофічним збоям

Bushing monitoring systems continuously track insulation condition of these critical high-voltage interfaces extending conductors through grounded transformer tanks. Despite representing small components, bushing failures account for 10-15% of all transformer breakdowns, often occurring with minimal warning using conventional testing approaches.
Capacitance and Dissipation Factor Measurement Principles
Capacitance and tan delta monitoring measures electrical properties of oil-paper condenser bushing insulation systems. Capacitance (C1) between high-voltage conductor and capacitance tap reflects overall insulation geometry and dielectric constant, with increases indicating moisture contamination or insulation swelling. Power factor or dissipation factor (загар δ) являє собою відношення резистивних втрат до ємнісного струму, кількісна оцінка якості ізоляції. Підвищення коефіцієнта потужності свідчить про погіршення ізоляції через старіння, потрапляння вологи, або забруднення. Сучасні системи моніторингу досягають 0.1 pF ємність дозвіл і 0.001 tan дельта точність, виявлення незначних змін за місяці до критичних порогів.
Торкніться поточного моніторингу та індикації несправностей
Торкніться вимірювання струму відстежує струм, що протікає через з'єднання відводів ємності під час нормальної роботи. Аномальні рівні струму або раптові зміни вказують на розвиток проблем із ізоляцією, забруднення вологи, або внутрішні дефекти. Аналіз з температурною компенсацією відрізняє варіації, пов’язані з навантаженням, від справжньої деградації ізоляції. Моніторинг кількох вводів дозволяє порівнювати фази, виявлення викидних одиниць, які потребують дослідження.
Терміни попереднього попередження
Про це свідчить польовий досвід bushing condition monitoring typically provides 6-12 months advance warning before critical failures. Gradual degradation patterns enable planned bushing replacements during scheduled maintenance outages, preventing unplanned failures that cause extensive collateral damage to transformer tanks, internal components, and adjacent equipment from explosive failures and oil fires.
7. Контроль стану пристрою РПН
OLTC monitoring tracks mechanical and electrical condition of voltage regulation mechanisms containing numerous moving parts, контакти, and insulating oil. These complex systems require more frequent maintenance than static transformer components, making condition monitoring valuable for optimizing service intervals and preventing failures.
Mechanical Vibration Analysis and Fault Signatures
Vibration monitoring installs accelerometers on OLTC tanks, capturing mechanical signatures during tap change operations. Normal operation generates repeatable vibration patterns in time and frequency domains. Abnormal signatures indicate specific mechanical problems: increased low-frequency vibration suggests loose components or worn bearings, high-frequency content indicates contact bounce or arcing, and timing shifts reveal drive mechanism wear or inadequate motor torque. Comparison against baseline signatures from commissioning or previous measurements flags developing problems requiring investigation.
Operation Counting and Timing Analysis
Operation counters track cumulative tap changes and position distributions, supporting maintenance scheduling based on manufacturer-specified service intervals typically ranging from 50,000 до 200,000 operations depending on OLTC design. Detailed operational history including date, час, початкове положення, остаточне положення, і струм двигуна для кожного перемикання дозволяє аналізувати надійність і кореляцію із зовнішніми факторами, такими як температура, завантаження, або події якості електроенергії. Вимірювання часу перевіряють правильне виконання послідовності, з відхиленнями, що вказують на проблеми з механічним прив’язуванням або схемою керування.
Технологія динамічного вимірювання опору
Вимірювання динамічного опору (DRM) подає постійний струм через головні контакти РПН під час операцій перемикання, вимірювання перехідного контактного опору в режимі реального часу. Підвищення опору свідчить про контактну ерозію, накопичення вуглецю, або недостатній контактний тиск. Ця техніка виявляє погіршення контакту до перегріву або повної відмови, можливість своєчасної заміни або відновлення контактів. Інтеграція з аналізом вібрації та часу забезпечує комплексну оцінку стану РПН.
8. Як дані в реальному часі забезпечують прогнозне технічне обслуговування
Predictive maintenance strategies leverage continuous monitoring data to transition from reactive failure response and time-based preventive schedules toward condition-based interventions optimizing maintenance timing and resource allocation. This transformation improves asset reliability while reducing unnecessary maintenance activities on healthy equipment.
From Reactive to Proactive Asset Management
Традиційний reactive maintenance responds to failures after occurrence, accepting unplanned outages, collateral damage, and emergency repair expenses. Time-based preventive maintenance performs routine service at fixed intervals regardless of actual equipment condition, wasting resources on unnecessary maintenance while potentially missing rapidly developing faults between scheduled activities. Прогнозне обслуговування використовує дані постійного моніторингу для виявлення проблем, що розвиваються, на ранніх стадіях, коли коригувальні дії залишаються простими та економічно ефективними, планування втручань на основі фактичного стану, а не довільних часових рамок або катастрофічних збоїв.
Багатопараметричне об’єднання та кореляція даних
Комплексний аналіз досліджує зв'язки між параметрами моніторингу, виявлення механізмів відмови, невидимих за допомогою однопараметричної оцінки. Зростання DGA водню в поєднанні зі збільшенням активності часткового розряду свідчить про прогресуючу деградацію ізоляції, що вимагає дослідження. Підвищення температури непропорційне навантаженню вказує на проблеми системи охолодження або внутрішні гарячі точки. Simultaneous changes in multiple parameters provide higher diagnostic confidence than isolated parameter variations that might reflect measurement noise or benign operational changes.
Fault Progression Curves and Intervention Timing
Fault development typically follows predictable progression patterns with exponential acceleration as damage accumulates. Early-stage detection during gradual development phases provides 6-18 months for planning interventions during scheduled outages. Delayed detection during accelerating phases may provide only weeks or days before catastrophic failure. Optimal intervention timing balances failure risks against maintenance costs, often occurring when projected failure probability within 12 months exceeds acceptable thresholds. Economic analysis weighs planned maintenance expenses against expected failure costs including emergency repairs, collateral damage, and outage impacts.
9. Системи раннього попередження: Багаторівневі механізми сигналізації
Alarm management systems translate continuous monitoring data into actionable notifications enabling timely operator response. Sophisticated algorithms reduce false alarms while ensuring critical conditions receive appropriate attention through multiple notification channels and escalation procedures.
Threshold, Тренд, and Predictive Alarms
Threshold alarms trigger when measured parameters exceed predefined absolute limits derived from standards like IEEE C57.91 for temperature or IEEE C57.104 for DGA concentrations. Multi-level thresholds implement warning and critical stages, providing escalating urgency as conditions deteriorate. Trend alarms analyze parameter rates-of-change, flagging rapid increases even when absolute values remain below threshold limits. Accelerating gas generation rates or temperature rises exceeding expected levels for loading conditions indicate developing problems requiring investigation. Predictive alarms employ mathematical models projecting parameter trajectories, alerting operators when forecasts predict threshold violations within specified timeframes enabling proactive intervention before critical conditions develop.
Intelligent Alarm Filtering and False Alarm Reduction
Smart alarm algorithms reduce nuisance alerts through multiple filtering techniques. Dead-band hysteresis prevents alarm chatter from measurements oscillating around threshold levels. Time delays require sustained threshold violations before triggering notifications, фільтрація перехідних стрибків від шуму вимірювання або миттєвих операційних подій. Контекстний аналіз розглядає кілька параметрів одночасно, придушення ізольованих тривог, які суперечать іншим показникам. Моделі машинного навчання, навчені на історичних даних тривоги, визначають джерела хронічних помилкових тривог, автоматичне налаштування чутливості для підтримки високої надійності виявлення при мінімізації помилкових спрацьовувань, які підривають довіру оператора.
Трирівнева класифікація сигналізації
Ієрархічні структури сигналізації класифікувати сповіщення на інформацію, УВАГА, і критичні рівні залежно від серйозності та терміновості реагування. Інформаційні рекомендації вказують на відхилення параметрів від нормальних діапазонів, що вимагає усвідомлення, але не негайної дії, наприклад, поступове підвищення температури під час сезонних змін навантаження. Warning alarms signal developing problems requiring investigation and monitoring intensification, like slowly increasing DGA gas concentrations or partial discharge activity levels. Critical alarms demand immediate response for conditions threatening equipment safety or requiring prompt operational actions, including rapid temperature rises, sudden gas generation, or protection system actuations.
Multi-Channel Notification Systems
Notification delivery employs multiple communication channels ensuring operators receive critical alerts regardless of location or circumstances. Mobile applications send push notifications to smartphones and tablets with alarm details, measured values, and trend graphs. SMS text messages provide backup notification for critical alarms when data connectivity limitations prevent app notifications. Email alerts deliver comprehensive alarm summaries with attached data files and diagnostic reports. Visual and audible annunciation in control rooms alerts on-duty personnel. Escalation procedures automatically notify supervisory personnel when alarms remain unacknowledged beyond specified timeframes, ensuring critical conditions receive timely attention.
10. Справи з реального світу: Трансформатори врятовані моніторингом у реальному часі
Кейс-стаді 1: DGA Monitoring Detects Internal Overheating
А 345 kV power transformer at a major transmission substation equipped with онлайн моніторинг DGA displayed steadily increasing ethylene concentrations over two months, rising from baseline 15 ppm to 85 ppm while other gases remained stable. The ethylene generation pattern indicated thermal decomposition around 450-500°C, suggesting localized overheating within the transformer. Internal inspection during a planned outage revealed deteriorated insulation on a high-voltage lead connection to the tap changer selector switch. The poor connection created resistive heating that would have progressed to complete failure within weeks. Timely detection enabled repair during scheduled maintenance, avoiding catastrophic failure during peak winter loading that would have required emergency transformer replacement and extended customer outages.
Кейс-стаді 2: Partial Discharge Monitoring Prevents Bushing Failure
А 230 kV transformer’s UHF partial discharge monitoring system detected increasing PD activity over three months, with discharge magnitude growing from background levels to 5000 ПК. Acoustic localization triangulated the discharge source to the high-voltage bushing region. Correlation between electrical UHF signals and acoustic emissions confirmed genuine PD activity rather than external interference. Bushing electrical testing revealed increasing power factor from normal 0.5% to concerning 2.8%, confirming insulation degradation. Bushing replacement during a scheduled maintenance window prevented explosive failure that typically causes extensive collateral damage to transformer tanks, adjacent bushings, and surrounding equipment.
Кейс-стаді 3: Temperature Monitoring Prevents Winding Damage

А 138 kV distribution substation transformer’s оптоволоконний моніторинг температури showed winding hot spot temperature climbing to 135°C under 85% завантаження, approximately 20°C higher than expected for the load level. Investigation revealed a malfunctioning cooling fan reducing heat dissipation capacity. Temporary load reduction prevented insulation damage while replacement fans were expedited. Вимірювання температури після ремонту підтвердили повернення до нормальних теплових характеристик. Система моніторингу запобігла прискореному старінню ізоляції, яке приблизно скоротило б термін служби трансформатора 5-10 років, якщо недолік охолодження залишився непоміченим.
11. Системна інтеграція SCADA та автоматизований контроль
Інтеграція SCADA дозволяє системам моніторингу трансформаторів брати участь в інфраструктурі управління та збору даних у масштабах загальногосподарського підприємства, забезпечуючи операторам консолідовану видимість територіально розподілених активів, одночасно підтримуючи автоматизовані реакції захисту та контролю.
Підтримка стандартного протоколу зв'язку
Сумісність протоколів забезпечує бездоганну інтеграцію з існуючими системами автоматизації комунальних послуг. Modbus RTU/TCP забезпечує простий обмін даними на основі реєстрів, придатний для базових програм моніторингу, картографування показань температури, Концентрації DGA, and alarm states to configurable register addresses. DNP3 (Distributed Network Protocol 3) offers robust master-slave communications with event buffering, синхронізація часу, and secure authentication commonly deployed in North American utilities. IEC 61850 implements object-oriented information models specifically designed for substation automation, enabling sophisticated interoperability between protection, КОНТРОЛЬ, and monitoring systems through Manufacturing Message Specification (MMS) services. Protocol conversion gateways translate between monitoring system native formats and utility-specified protocols, accommodating diverse legacy and modern SCADA architectures.
Data Mapping and Register Configuration
SCADA data points require careful mapping between monitoring system measurements and utility register assignments. Configurable scaling factors convert engineering units (°C, ppm, ПК) to SCADA system conventions. Status points represent alarm conditions, communication health, and system operational states through binary indicators. Analog points convey continuous measurements with appropriate resolution and update rates. Event sequence-of-events recording captures alarm transitions with millisecond timestamps supporting post-incident analysis. Comprehensive documentation specifying register assignments, scaling factors, alarm mappings, and communication parameters ensures consistent configuration across monitoring points and SCADA master stations.
Automated Load Transfer and Emergency Control
Automated control sequences respond to critical monitoring conditions without operator intervention, improving response speed and consistency. High-temperature alarms trigger automatic cooling system activation, starting backup fans or pumps to increase heat dissipation. Severe fault indications initiate automatic load transfers to alternate transformers, preventing equipment damage while maintaining service continuity. Protection system integration enables monitoring-based tripping for rapidly developing faults detected by DGA or partial discharge systems before conventional protection relays respond. Programmable logic implements sophisticated control algorithms considering multiple parameters, умови навантаження, and system operating states when executing automated responses.
Control Center Interface Customization
Operator displays present transformer monitoring data in intuitive formats matching utility preferences and operational workflows. Single-line diagrams overlay real-time temperatures, gas concentrations, and alarm status on substation geographic displays. Multi-parameter trend screens show correlated parameter evolution over user-selectable time ranges from hours to years. Tabular fleet views summarize conditions across multiple transformers, enabling rapid identification of assets requiring attention. Customizable color-coding applies green/yellow/red health indicators based on condition severity. Geographic information system (ГІС) integration displays transformer health status on system-wide maps, supporting strategic planning and resource allocation decisions.
12. Комплексна архітектура системи онлайн-моніторингу
System architecture for transformer monitoring implementations follows hierarchical designs separating sensor networks, збір даних, комунікаційна інфраструктура, and application layers. This structured approach enables scalability, maintainability, and integration with utility enterprise systems.
Four-Layer Hierarchical Architecture
The sensor layer comprises field-installed measurement devices including temperature sensors, Аналізатори DGA, детектори часткових розрядів, втулки монітори, and OLTC diagnostics. Sensor selection considers accuracy requirements, екологічні умови, обмеження встановлення, and maintenance accessibility. Redundant sensors on critical parameters provide fault tolerance, ensuring continued monitoring if individual sensors fail.
The acquisition layer employs local data concentrators or remote terminal units (RTU) performing analog-to-digital conversion, digital signal processing, and preliminary data analysis. Multi-channel input modules accommodate diverse sensor types with appropriate signal conditioning. Local processing implements filtering algorithms, threshold checking, і генерація тривоги. On-board data buffering stores 30-90 days of measurements, protecting against communication outages or server failures. Ruggedized industrial hardware withstands substation electromagnetic environments and temperature extremes.
The комунікаційний рівень connects field devices to central servers using utility-standard networking infrastructure. Fiber optic links provide high-bandwidth, low-latency connections for substations with existing telecommunications infrastructure. Cellular LTE/5G modems enable monitoring at remote locations without fixed network connectivity. Satellite communications serve extremely remote installations where terrestrial options prove impractical. Virtual private networks (VPNs) and Transport Layer Security (TLS) encryption protect data confidentiality and integrity during transmission. Redundant communication paths using diverse technologies ensure continued data flow during network disruptions.
The application layer hosts centralized monitoring servers, database systems, analytics platforms, and operator interfaces. Scalable database architectures handle millions of daily measurements while maintaining sub-second query response times. Web-based dashboards provide browser access without client software installation requirements. Advanced analytics extract insights through statistical analysis, машинне навчання, and comparative fleet studies. Enterprise integration modules exchange data with asset management, outage management, and maintenance planning systems.
Local Data Acquisition and Edge Computing
Edge computing capabilities at data acquisition units enable intelligent local processing, reducing communication bandwidth requirements while improving system responsiveness. Local alarm evaluation generates immediate notifications without round-trip delays to central servers. Compression algorithms reduce data volumes by 70-90% through lossless encoding and selective transmission strategies sending detailed waveforms only during alarm conditions while summarizing steady-state periods. Predictive analytics models run at edge devices, calculating health indicators and remaining life estimates locally. This distributed intelligence architecture maintains critical monitoring functions during temporary communication outages while reducing central server computational loads.
Diagnostic Software Core Algorithms
Analysis software implements diverse diagnostic algorithms specific to each monitoring parameter. Temperature analysis applies thermal models calculating insulation aging acceleration factors based on measured hot spot temperatures and loading histories. DGA diagnostics automatically execute multiple interpretation methods including Duval Triangle, Коефіцієнти Роджерса, та IEC 60599 стандарти, flagging discrepancies between methods for expert review. Partial discharge pattern recognition classifies discharge types through machine learning models trained on extensive databases correlating patterns with confirmed defect types. Multi-parameter correlation engines identify relationships between parameters, improving diagnostic accuracy beyond individual parameter assessment.
Reporting and Visualization Capabilities
Reporting modules generate automated summaries at configurable intervals, delivering daily operations reports, weekly trend analyses, monthly condition assessments, and annual fleet health reviews. Customizable templates accommodate utility-specific formats and content requirements. Interactive visualizations enable exploratory data analysis through drag-and-drop interfaces building custom charts without programming expertise. Експорт завантажуваних даних у CSV, Excel, або формати PDF підтримують офлайн-аналіз і вимоги до нормативної звітності. Історичні функції відтворення відтворюють минулі умови експлуатації, підтримка розслідувань інцидентів та аналіз отриманих уроків.
13. Часті запитання: Системи моніторингу трансформаторів
Питання моніторингу температури трансформатора
Як встановлюється система контролю температури трансформатора? Чи вимагає відключення трансформатора?
Вимоги до установки залежать від типів датчиків і місць монтажу. Зовнішні датчики температури контролюють верхнє масло, bottom-oil, та умов навколишнього середовища встановити без знеструмлення трансформатора за допомогою термогільз або накладних зондів. внутрішній волоконно-оптичні датчики обмотки зазвичай вимагають коротких відключень для встановлення через наявні клапани відбору проб масла, оглядові люки, або спеціально передбачені порти. Сучасні конструкції модернізації зводять до мінімуму тривалість простою 2-4 hours for complete multi-point installations. Some utilities coordinate sensor installation with scheduled maintenance outages, eliminating dedicated outage requirements. Non-intrusive infrared monitoring provides limited external temperature assessment without any outage, though accuracy and coverage cannot match direct measurement approaches.
What advantages do fiber optic temperature sensors offer compared to traditional thermometers?
Волоконно-оптичні датчики deliver multiple compelling advantages. Complete electromagnetic immunity eliminates measurement errors from strong electromagnetic fields surrounding high-voltage equipment that severely affect electrical temperature devices. Intrinsic safety without electrical energy at sensor tips prevents spark ignition risks, allowing direct installation in flammable oil without special certifications or barriers. Dielectric optical fibers enable direct contact with high-voltage conductors measuring true winding temperatures rather than indirect oil temperature estimates. Superior accuracy (±0,5°C) і роздільна здатність (0.1°C) exceed conventional resistance thermometer capabilities. Zero long-term drift eliminates recalibration requirements throughout 25-30 рік служби. Lightning strike immunity prevents sensor damage from transient overvoltages that destroy electrical sensors requiring costly replacements.
What temperature levels indicate abnormal transformer operation? How should alarm thresholds be configured?
Alarm thresholds depend on transformer design, умови навантаження, and cooling methods. IEEE C57.91 loading guide recommends maximum hot spot temperatures of 110°C for normal life expectancy under continuous loading, 120°C for moderate life reduction, and 140°C absolute maximum for emergency loading. Температура верхньої оливи зазвичай підтримується на 15-25°C нижче значень гарячих точок залежно від ефективності охолодження. Системи контролю температури реалізувати багаторівневу сигналізацію: інформаційні сповіщення в гарячій точці 90-95°C, що вказує на підвищені, але прийнятні температури, попередження при 105-110 °C, що передбачає дослідження завантаження або охолодження, і критичні сигнали тривоги при 120-130°C, що вимагають негайного зменшення навантаження або посиленого охолодження. Швидкість підвищення температури забезпечує додаткові критерії тривоги, зі швидким зростанням, що перевищує 5-10°C на годину, що вказує на розвиток проблем, навіть коли абсолютні температури залишаються нижче статичних порогів. Сезонні коригування враховують різні температури навколишнього середовища, що впливає на прийнятні робочі температури.
Наскільки завчасно моніторинг температури може виявити несправності перегріву до того, як станеться пошкодження обладнання?
Часові рамки раннього попередження змінюватися залежно від механізмів вад і швидкості розвитку. Поступове погіршення системи охолодження внаслідок забруднення радіаторів або несправних вентиляторів призводить до повільного підвищення температури, про що повідомляють завчасно за тижні до місяців. Раптові збої в охолодженні викликають швидке підвищення температури, яке можна виявити протягом годин, але вимагає негайної реакції. Внутрішні гарячі точки через ослаблені з’єднання або заблокований потік масла зазвичай утворюються протягом кількох днів або тижнів, забезпечення достатнього попередження про заплановані втручання. Постійний моніторинг с 1-5 хвилинні інтервали вимірювань фіксують динаміку температури, можливість раннього виявлення на початкових стадіях розвитку несправності, коли коригувальні дії залишаються простими.
Питання системи моніторингу трансформатора
З яких компонентів складається повна система онлайн-моніторингу трансформатора?
Комплексний системи моніторингу інтегрувати кілька підсистем, що звертаються до різних діагностичних параметрів. Temperature monitoring employs fiber optic or resistance sensors measuring winding hot spots, top-oil, bottom-oil, and ambient conditions. DGA analysis continuously samples dissolved gases indicating internal electrical and thermal faults. Partial discharge detection uses UHF and acoustic sensors identifying insulation defects. Bushing monitors measure capacitance, коефіцієнт дисипації, and tap currents tracking insulation condition. OLTC diagnostics analyze mechanical vibration, терміни операції, і контактний опір. Supporting infrastructure includes data acquisition units performing analog-to-digital conversion and signal processing, communication gateways connecting field devices to central systems, and analytical software platforms providing data visualization, управління сигналізацією, and diagnostic algorithms. Power supplies, environmental enclosures, and cybersecurity measures complete operational systems.
Чим відрізняються системи моніторингу розподільних і силових трансформаторів?
Моніторинг розподільних трансформаторів наголошує на економічно ефективних рішеннях, які підходять для багатьох невеликих одиниць, часто використовують спрощені комплекти датчиків для вимірювання температури, струм навантаження, та основні електричні параметри. Бездротовий зв’язок і сонячна енергія зменшують витрати на монтаж установок на стовпах або на підкладках без джерела змінного струму. Моніторинг силового трансформатора виправдовує комплексні багатопараметричні системи з урахуванням вищих індивідуальних цінностей активів і критичності мережі. Повний комплект датчиків, включаючи температуру, DGA, частковий розряд, втулка, і моніторинг РПН спрямовані на всі основні механізми відмови. Резервні датчики та канали зв’язку забезпечують постійний моніторинг критично важливих активів. Sophisticated analytics and integration with utility enterprise systems support detailed condition assessment and strategic asset management decisions.
What data sampling rates do monitoring systems employ for different parameters?
Sampling intervals vary based on parameter dynamics and diagnostic requirements. Temperature measurements typically sample at 1-5 minute intervals, balancing thermal time constant response with data storage efficiency. Faster sampling (10-60 секунд) may apply during load ramps or cooling system transients. DGA systems analyze oil samples every 30-60 minutes depending on technology and gas types, with some advanced systems providing 15-minute updates for key gases. Моніторинг часткових розрядів continuously captures signals at 100 kHz to 1 MHz sampling rates, but stores only statistical summaries and waveforms exceeding magnitude thresholds rather than complete continuous recordings. Bushing measurements sample at 5-15 minute intervals during normal conditions, potentially increasing to 1-minute intervals when degradation indicators appear. OLTC monitoring triggers on each tap change operation, recording complete vibration waveforms and electrical parameters throughout switching sequences.
What power supply options exist for monitoring system equipment?
Field devices require reliable power sources appropriate for installation environments. AC-powered systems connect to substation station service supplies (120/240 VAC) providing continuous power with battery backup for communication continuity during outages. DC-powered equipment operates from station battery systems (48/125 VDC) common in substations, пропонуючи чудову надійність і власну резервну ємність. Моніторинг на сонячних батареях підходить для віддалених місць без електроживлення, комбінування фотоелектричних панелей, зберігання акумулятора, і малопотужна електроніка для багаторічної автономної роботи. Потужність трансформатора струму збирає енергію від струмів навантаження трансформатора, дозволяє здійснювати повністю пасивний моніторинг без вимог зовнішнього живлення, хоча обмеження вихідної потужності обмежують типи датчиків і дальність зв'язку. Бюджетування потужності враховує нормальну роботу, передача зв'язку, і умови тривоги, що забезпечують адекватну пропускну здатність з відповідними запасами.
Запитання щодо моніторингу масляної хроматографії DGA
Які типи несправностей може виявити аналіз розчинених газів трансформатора?
Моніторинг DGA визначає різноманітні механізми електричних і теплових несправностей за допомогою характерних моделей утворення газу. Partial discharge or corona produces primarily hydrogen with minor methane generation, indicating insulation voids, гострі краї, or floating components. Low-energy thermal faults below 300°C generate methane and ethane from oil decomposition, suggesting loose connections, вихровий нагрів, or core problems. Medium-temperature thermal faults between 300-700°C produce increasing ethylene concentrations, associated with localized overheating from circulating currents or blocked cooling. High-energy electrical arcing above 700°C generates acetylene, the most serious gas indicating sustained arcing that rapidly damages insulation and conductors. Cellulose insulation overheating produces carbon monoxide and carbon dioxide, revealing paper insulation degradation from excessive temperatures or aging. Multi-gas pattern analysis discriminates between these fault types, guiding appropriate diagnostic investigations and maintenance actions.
Which approach provides more accurate results: online DGA monitoring or offline oil sampling with laboratory analysis?
Обидва підходи до моніторингу achieve comparable accuracy for individual measurements when properly executed, but continuous online monitoring delivers superior diagnostic capabilities. Modern online systems achieve ±10% accuracy or ±5 ppm whichever is greater for key gases, matching or exceeding laboratory analytical performance. Online monitoring’s decisive advantage lies in continuous trending capturing fault development dynamics, transient events occurring between periodic samples, and gas generation rates providing earlier fault detection than absolute concentrations alone. Laboratory analysis eliminates potential instrument drift and calibration errors through fresh standards with each test, but introduces sampling contamination risks, transportation delays, and result turnaround times extending 1-2 тижнів. Offline sampling frequencies of 6-12 months prove inadequate for rapidly developing faults, whereas online surveillance detects problems within hours to days of onset. Combined approaches employing online monitoring for continuous surveillance with periodic laboratory analysis for verification and extended gas panels optimize diagnostic accuracy and reliability.
At what hydrogen concentration should operators investigate transformer condition?
Hydrogen thresholds vary with transformer design and operating history, but general guidance helps prioritize investigations. IEEE C57.104 suggests investigation when hydrogen exceeds 100 ppm in mineral oil transformers without on-load tap changers, though lower thresholds (50 ppm) may apply for critical transformers or units with problematic histories. Що важливіше, hydrogen generation rates exceeding 50 ppm/month warrant investigation regardless of absolute concentrations, indicating active fault development. Sudden hydrogen increases following specific events like load changes, switching operations, or system disturbances require correlation analysis identifying cause-effect relationships. Hydrogen combined with other gases suggests specific faults: hydrogen plus ethylene indicates partial discharge transitioning to thermal faults, hydrogen with acetylene signals arcing conditions, hydrogen with carbon monoxide reveals cellulose insulation involvement. Індивідуальні базові лінії трансформатора, встановлені під час нормальної роботи, забезпечують кращі контрольні точки, ніж загальні порогові значення, з відхиленнями від характерних для підрозділу шаблонів, що викликають розслідування.
Як оператори повинні інтерпретувати результати DGA? Які гази заслуговують першочергової уваги?
Ефективний Інтерпретація DGA враховує абсолютні концентрації, generation rates, газові співвідношення, і трендові моделі цілісно. Ключові гази, які потребують пильної уваги, включають водень (індикатор часткового розряду), ацетилен (індикатор дуги), етилен (індикатор помірної теплової несправності), і чадний газ (індикатор деградації целюлози). Методи аналізу співвідношення, включаючи трикутник Дюваля, Коефіцієнти Роджерса, та IEC 60599 стандарти перетворюють необроблені концентрації в класифікацію несправностей шляхом розрахунку співвідношення між конкретними газовими парами. Трикутник Дюваля забезпечує візуальну класифікацію, наносячи координати ацетилен-метан-етилен на окремі зони розломів. Gas generation rates calculated from consecutive measurements often provide earlier warning than absolute values, with accelerating rates indicating deteriorating conditions. Correlation with operational events, шаблони завантаження, and temperature histories helps distinguish between genuine faults and benign operational effects. Multi-method approaches comparing different diagnostic techniques improve confidence, with agreement between methods supporting diagnoses while discrepancies flagging complex situations requiring expert review.
Partial Discharge Monitoring Questions
What is transformer partial discharge and why does it require monitoring?
Частковий розряд represents localized electrical breakdown within insulation systems that does not completely bridge conductor-to-ground or conductor-to-conductor paths. These repetitive small discharges occur when local electric field concentrations exceed insulation dielectric strength, typically at manufacturing defects, contamination sites, moisture pockets, or design weaknesses. Each discharge event releases energy gradually eroding insulation through chemical decomposition, thermal damage, і механічні навантаження. Individual discharges cause minimal immediate damage, but millions of repetitive discharges over months to years progressively degrade insulation until complete breakdown occurs. Continuous monitoring detects PD activity at early stages when insulation damage remains limited and corrective actions may extend service life or enable planned replacement avoiding catastrophic failures. PD monitoring provides the most sensitive early warning available for insulation deterioration, often detecting problems years before conventional electrical testing reveals abnormalities.
What differences exist between UHF and ultrasonic partial discharge detection methods?
UHF detection measures electromagnetic radiation in 300 МГц – 3 GHz range generated by rapid current pulses during discharge events. UHF sensors offer excellent sensitivity detecting low-magnitude discharges while rejecting external electromagnetic interference through frequency selectivity and shielding. Internal sensors installed through oil drain valves provide superior sensitivity compared to external antennas, though external mounting simplifies retrofit installations without transformer entry. UHF methods excel at detecting discharge presence and characterizing patterns but provide limited spatial localization without multiple sensor arrays.
Ultrasonic detection вимірює акустичну емісію в 20-300 діапазон кГц від хвиль тиску, створених виділенням енергії розряду. Акустичні датчики, встановлені на зовнішніх поверхнях резервуарів, виявляють викиди, що поширюються через нафту та металеві конструкції. Мультисенсорна тріангуляція обчислює тривимірні координати джерела розряду з точністю ±10 см, точна локалізація проблем в трансформаторних обсягах. Проте, акустична чутливість залежить від місця розряду, з глибокими внутрішніми розрядами, що створюють слабші поверхневі сигнали, ніж приповерхнева активність. Акустичні сигнали слабшають із відстанню та частотою, потенційно відсутні слабкі розряди у великих трансформаторах.
Інтегровані системи, що поєднують УВЧ електричне та ультразвукове акустичне виявлення, використовують додаткові переваги: УВЧ забезпечує чутливе виявлення та класифікацію шаблонів, в той час як акустичні датчики дозволяють просторову локалізацію. Correlation between simultaneous electrical and acoustic signals confirms genuine partial discharge versus external interference, improving diagnostic confidence.
At what partial discharge magnitude should transformers undergo maintenance?
Discharge magnitude thresholds depend on multiple factors including transformer voltage class, insulation design, discharge location, and pattern characteristics. IEC 60270 defines apparent charge in picocoulombs (ПК) as standardized magnitude metric. General guidelines suggest investigation when discharge magnitudes exceed 1000 pC for distribution transformers or 5000 pC for transmission transformers, though these thresholds vary widely with specific circumstances. Що важливіше, discharge trending provides better decision criteria than static thresholds: stable low-level activity may continue indefinitely without intervention, повільно зростаючі моделі вимагають інтенсифікації моніторингу та планування на випадок надзвичайних ситуацій, у той час як швидке збільшення величини розряду вимагає негайних дій, потенційно включаючи негайне знеструмлення для перевірки або заміни. Типи розряду впливають на терміновість, з внутрішніми порожнечними розрядами, як правило, більш серйозними, ніж коронна активність. Розташування також має значення, з розрядами поблизу площини заземлення або між фазами більш критичними, ніж розряди на плаваючі екрани або між секціями обмотки. Кореляція з іншими діагностичними засобами, включаючи DGA, випробування втулок, і вимірювання опору ізоляції забезпечують комплексну оцінку, що підтримує рішення щодо часу технічного обслуговування.
Як оператори можуть відрізнити справжні сигнали часткового розряду від зовнішніх електромагнітних перешкод?
Ефективний відмова від перешкод використовує різні методи розрізнення. Frequency domain analysis reveals that genuine PD signals contain broad-spectrum content across megahertz ranges, while many interference sources concentrate energy at specific frequencies like radio broadcasts or power line carrier. Phase-resolved analysis correlates discharge activity with power frequency voltage phase, with genuine PD typically clustered near voltage peaks whereas random interference distributes uniformly across phase angles. Pulse shape analysis examines rise time, тривалість, and decay characteristics, with true PD exhibiting sub-microsecond rise times and characteristic decay patterns differing from interference pulse shapes. Simultaneous multi-sensor measurements provide spatial correlation, with genuine internal discharges appearing across multiple sensors with appropriate time delays whereas external interference may appear simultaneously or only on sensors facing interference sources. Pattern recognition algorithms trained on confirmed PD databases automatically classify signals, flagging unusual characteristics for manual review. Combined electrical and acoustic detection provides definitive confirmation, since only genuine internal discharges generate both electromagnetic and acoustic emissions with correlated timing.
Bushing Monitoring Questions
Why do transformer bushings frequently fail despite being relatively simple components?
Поломки втулок occur disproportionately often because these components experience severe stresses despite their critical insulation function. Bushings must provide electrical insulation across large potential differences (hundreds of kilovolts to ground) while conducting high currents generating internal heating. Outdoor exposure subjects bushings to temperature cycling, вологи, забруднення, and UV radiation accelerating material degradation. Mechanical stresses from conductor weight, льодове навантаження, wind forces, and seismic events create additional vulnerabilities. Manufacturing defects including voids, забруднення, or curing irregularities may not appear during factory testing but progressively worsen during service. Moisture ingress through failed gaskets or breathing mechanisms severely degrades oil-paper insulation systems. External contamination from industrial pollution or salt spray reduces surface insulation. The combination of electrical, теплові, механічний, and environmental stresses creates multiple failure pathways requiring continuous monitoring for early detection.
Про які проблеми свідчить підвищення коефіцієнта розсіювання вводу?
Підйом коефіцієнт дисипації (загар δ) сигналізує про погіршення якості ізоляції за допомогою багатьох механізмів. Забруднення вологи різко збільшує діелектричні втрати, з дельтою загару, що перевищує норму 0.3-0.5% до відповідних рівнів вище 1-2% оскільки вміст вологи перевищує 2-3%. Термічне старіння руйнує ізоляційні матеріали, збільшуючи резистивні втрати навіть без вологи. Активність часткового розряду створює обвуглені шляхи відстеження, забезпечуючи шляхи провідності з втратами через ізоляцію. Забруднення нафти частками або продуктами хімічного розпаду підвищує діелектричні втрати. Кожен 0.5% збільшення коефіцієнта потужності зазвичай корелює зі значним погіршенням ізоляції, що вимагає дослідження. Швидке збільшення протягом тижнів або місяців вказує на прискорення деградації, що вимагає термінової уваги, в той час як поступове збільшення протягом багатьох років свідчить про нормальні процеси старіння. Температурна компенсація є важливою, оскільки коефіцієнт потужності змінюється залежно від температури вимірювання, із підвищенням за базові лінії, скориговані за температурою, що вказує на справжні проблеми, а не на навколишнє середовище.
На якому принципі лежить контроль струму відводу прохідного відводу?
Торкніться поточного моніторингу вимірює струм, що протікає через ємнісне з'єднання, яке використовується для градуювання напруги у вводах конденсаторного типу. Цей струм дорівнює прикладеній напрузі, помноженій на ємність вводу та коефіцієнт потужності. У нормальних умовах зі стабільною ємністю вводу та низьким коефіцієнтом потужності, Струм відводу змінюється пропорційно прикладеній напрузі відповідно до передбачуваних моделей. Abnormal tap current suggests capacitance changes from insulation degradation or power factor increases from dielectric losses. Monitoring systems compare measured tap current against expected values calculated from applied voltage and historical bushing characteristics. Deviations exceeding normal tolerances (typically ±10% of expected values) indicate developing problems. Advanced systems implement temperature compensation and voltage correction, isolating genuine insulation changes from benign environmental and operational variations. Trending over months to years reveals gradual degradation patterns, while sudden changes flag acute problems requiring immediate investigation.
How much advance warning does bushing monitoring typically provide before failure occurs?
Warning timeframes vary with degradation mechanisms and progression rates, але моніторинг втулки зазвичай забезпечує 6-12 за місяць до критичних збоїв. Деградація, пов'язана з вологою, часто розвивається поступово 1-2 років, з моніторингом виявлення проблем, коли коефіцієнт потужності збільшує охоплення 1-2%, задовго до того, як значення досягнуть порогів відмови 3-5%. Цей розширений період попередження дозволяє здійснювати планову заміну втулки під час запланованих відключень на технічне обслуговування. Несправності, пов'язані з частковим розрядом, можуть розвиватися швидше 3-6 місяців, вимагає більш частого моніторингу та швидкої реакції після виявлення активності. Виробничі дефекти можуть залишатися бездіяльними роками до швидкого прогресування, з моніторингом, що ідеально виявляє початкове погіршення 6-12 місяць попередження. Раптові збої через зовнішні спалахи, механічні пошкодження, або екстремальне забруднення може забезпечити мінімальне завчасне попередження, хоча вони представляють режими несправностей меншості. Постійний моніторинг оптимізує ймовірність виявлення всіх механізмів відмови, максимізація доступного часу попередження для проактивного втручання.
Питання моніторингу пристрою РПН
Які параметри потребують моніторингу в системах РПН?
Комплексний OLTC monitoring звертається до механічних, електричні, і експлуатаційні параметри. Механічні параметри включають сигнатури вібрації, проаналізовані в часовій і частотній областях, які виявляють стан приводного механізму, час контактної операції, що вказує на належне виконання послідовності та ідентифікує зв’язування або надмірне тертя, профілі струму двигуна, що показують навантаження приводного двигуна протягом робочих циклів, і акустичні випромінювання, що виявляють аномальні удари або шліфування. Електричні параметри включають контактний опір, виміряний шляхом вимірювання динамічного опору, який виявляє ерозію або забруднення контакту, diverter switch arcing current indicating transition contact condition, and insulation resistance verifying adequate separation in open positions. Operational parameters include cumulative operation counters tracking maintenance interval compliance, position verification confirming proper voltage regulation, environmental conditions like oil level and quality affecting OLTC performance, and control circuit integrity ensuring reliable command execution. Multi-parameter correlation identifies developing problems through combined analysis rather than single-parameter assessment.
What typical characteristics indicate abnormal OLTC vibration patterns?
Vibration analysis identifies specific mechanical faults through signature recognition. Increased low-frequency content (below 100 Гц) suggests loose mechanical components, знос підшипників, or inadequate drive motor torque. Elevated mid-frequency vibration (100-1000 Гц) вказує на відмову контакту, механічні впливи, або невідповідні компоненти. Високочастотний шум (вище 1000 Гц) виявляє дугу, електричний пробій, або проблеми з контактом під час поточної передачі. Зміни часу у моделях вібрації відносно активації двигуна свідчать про знос приводного механізму, недостатнє змащення, або механічне зв'язування. Збільшення амплітуди на всіх частотах вказує на загальне механічне пошкодження, яке потребує комплексної перевірки. Асиметричні моделі між операціями підйому та опускання вказують на проблеми з напрямком, такі як зношені храповики або проблеми з одностороннім зчепленням. Порівняння з базовими лініями введення в експлуатацію або попередніми вимірюваннями кількісно визначає прогресування деградації, підтримка рішень щодо часу обслуговування.
При якій загальній кількості операцій РНП потребують капітального обслуговування?
Інтервали технічного обслуговування значно відрізняються Конструкція РПН та рекомендації виробника. Vacuum-type tap changers typically specify major overhauls at 100,000-300,000 операції, with contact replacement often required at these intervals. Oil-immersed resistor-type designs may require major service at 50,000-100,000 operations due to contact wear and oil contamination from arcing. Diverter switch mechanisms using high-speed transitions with minimal arcing extend intervals to 200,000-400,000 operations before major overhaul. Beyond manufacturer specifications, condition monitoring data enables condition-based maintenance scheduling. Units showing stable vibration patterns, minimal contact resistance increase, and consistent timing may safely operate beyond nominal intervals, while units displaying degradation indicators require earlier service regardless of operation counts. Operation rate also influences maintenance timing: transformers averaging 10 operations daily reach service intervals much faster than units changing taps weekly. Environmental factors including loading severity, умови навколишнього середовища, and oil quality affect degradation rates necessitating flexible maintenance strategies informed by actual monitored condition rather than rigid operation-count thresholds alone.
How does dynamic resistance measurement identify contact problems?
Вимірювання динамічного опору injects DC test current through OLTC main contacts during switching operations, measuring transient voltage drop and calculating instantaneous contact resistance throughout transition sequences. Normal contacts exhibit stable low resistance (типово 50-200 microohms) during closed periods with brief increases during transitions as current transfers through resistive elements or from one contact to another. Degraded contacts display increased steady-state resistance indicating erosion, накопичення вуглецю, або недостатній контактний тиск. Excessive resistance during transitions suggests diverter switch or transition resistor problems. Erratic resistance fluctuations reveal contact bounce or chattering indicating mechanical problems. Timing analysis showing prolonged high-resistance intervals suggests sluggish operation from binding or inadequate drive torque. Comparison between identical OLTC positions across multiple operation cycles quantifies consistency, with increasing variability indicating deteriorating mechanical condition. DRM testing occurs during normal voltage regulation operations without requiring transformer de-energization, enabling continuous contact condition assessment throughout service life. Trending over months to years reveals gradual contact wear, supporting proactive maintenance before failures occur.
System Integration and Application Questions
How do online monitoring systems interface with SCADA systems?
Інтеграція SCADA employs standard utility automation protocols enabling monitoring data exchange with control center systems. Monitoring systems implement protocol server functions responding to SCADA master station data requests. Modbus RTU/TCP provides simple register-based access mapping temperature readings, gas concentrations, and alarm states to numbered registers accessible through read commands. DNP3 implementations define point lists with analog inputs for continuous measurements, binary inputs for alarm conditions, and event logging capturing alarm transitions with timestamps. IEC 61850 integrations model monitoring functions through standardized logical nodes with defined data objects, enabling sophisticated semantic interoperability. Пристрої шлюзу переводять між власними протоколами системи моніторингу та вимогами SCADA утиліт, розміщуючи різні типи головних станцій. Конфігуроване відображення даних призначає параметри моніторингу для певних точок SCADA, застосовує коефіцієнти масштабування, і встановлює інтервали оновлення. Інтеграція сигналізації передає сповіщення системи моніторингу до управління сигналізацією SCADA, потенційно запускаючи відповіді автоматизованого керування або сповіщення оператора через інфраструктуру SCADA.
Як довго зберігаються дані моніторингу та яка ємність для зберігання потрібна?
Терміни зберігання даних відповідають нормативним вимогам, аналітичні потреби, та економіка зберігання. Необроблені дані високої роздільної здатності (1-5 minute intervals) зазвичай магазини для 30-90 днів для підтримки аналізу останніх тенденцій і короткострокових досліджень. Усереднені за годину дані зберігаються протягом 1-2 років, що дозволяє порівнювати сезони та середньострокові тренди. Daily statistical summaries (minimum, maximum, average) store indefinitely providing long-term historical context. Event-triggered high-speed waveforms from transient events retain for 5-10 years supporting incident investigations and forensic analysis. Storage requirements depend on monitoring scope and retention policies. A comprehensive power transformer monitoring system generating 100-200 data points every minute produces approximately 10-20 MB daily or 3-7 GB annually in uncompressed formats. Database compression reduces storage by 70-90% depending on data characteristics. Cloud storage costs have declined dramatically, making extended retention economically practical for most utilities. Local storage at monitoring system devices provides backup during communication outages, typically buffering 30-90 days before overwriting oldest data.
Чи можна інтегрувати моніторингове обладнання різних виробників в єдині платформи?
Інтеграція різних постачальників створює труднощі, але залишається досяжною за допомогою кількох підходів. Стандартизація протоколу забезпечує базову сумісність, коли постачальники впроваджують загальні протоколи, такі як Modbus, DNP3, або IEC 61850 відповідно до опублікованих специфікацій. Проте, власні розширення, моделі даних виробника, і варіації конфігурації ускладнюють бездоганну інтеграцію. Пристрої шлюзу або платформи проміжного програмного забезпечення перетворюють між протоколами постачальників і уніфікованими моделями даних, агрегування даних із різних джерел у консолідовані бази даних. Деякі комунальні підприємства підтримують окремі системи моніторингу для обладнання різних постачальників, прийняття операційної складності для збереження специфічних функцій постачальника та підтримки. Інтеграційні платформи підприємства забезпечують збір і візуалізацію даних незалежно від постачальника, агрегування даних з кількох систем моніторингу через стандартні інтерфейси. Фреймворки моніторингу з відкритим вихідним кодом дозволяють розробляти спеціальну інтеграцію, хоча й вимагають спеціальних знань. При вказівці нових систем моніторингу, утиліти повинні надавати пріоритет відкритим протоколам, детальна документація щодо впровадження протоколу, і прихильність постачальника дотримання стандартів, що сприяє гнучкості майбутньої інтеграції. Практична інтеграція з кількома постачальниками зазвичай забезпечує базовий збір даних і тренди з обмеженнями в розширених функціях, таких як скоординована сигналізація або міжсистемний кореляційний аналіз.
Як розглядаються ризики кібербезпеки системи моніторингу?
Заходи кібербезпеки захистити системи моніторингу від несанкціонованого доступу, підробка даних, а також атаки на відмову в обслуговуванні відповідно до стандартів NERC CIP і політики безпеки комунального підприємства. Сегментація мережі ізолює системи моніторингу від корпоративних мереж і доступу до Інтернету, з брандмауерам, що контролює трафік між зонами безпеки. Virtual private networks (VPNs) шифрувати сеанси віддаленого доступу, запобігаючи прослуховування даних моніторингу або облікових даних. Безпека транспортного рівня (TLS) шифрує дані під час передачі між польовими пристроями та центральними серверами. Контроль доступу на основі ролей обмежує функції системи для авторизованого персоналу з журналом аудиту, який відстежує всі спроби доступу та зміни конфігурації. Безпечна автентифікація за допомогою надійних паролів, багатофакторна аутентифікація, або схеми на основі сертифікатів запобігають неавторизованому входу. Регулярні виправлення безпеки та оновлення мікропрограми усувають відомі вразливості. Intrusion detection systems monitor network traffic identifying suspicious activity. Physical security controls access to monitoring equipment in substations and control centers. Security assessments and penetration testing validate defenses against current threat landscapes. Vendor security practices including secure development lifecycles, vulnerability disclosure policies, and incident response procedures warrant evaluation during procurement. Balancing security with operational accessibility requires careful risk assessment and layered defense strategies appropriate to specific utility environments and threat models.
Economic and Reliability Questions
Is online monitoring cost-effective for aging transformers approaching end-of-life?
Monitoring aging transformers delivers particularly strong value through several mechanisms. Older units face higher failure probabilities making early fault detection more valuable. Life extension through optimized loading and timely maintenance interventions can defer expensive replacements 5-10 років, generating substantial economic benefits. Monitoring informs strategic decisions about refurbishment versus replacement based on actual condition rather than age alone. Critical older transformers supporting essential loads justify monitoring investments preventing unplanned outages regardless of remaining service life. І навпаки, monitoring may confirm that some aging transformers remain in excellent condition, avoiding premature replacement driven by age-based assumptions. Economic analysis should consider avoided failure costs, life extension value, оптимізоване обслуговування, and operational flexibility rather than simple payback calculations. Для критичних трансформаторів передачі, моніторинг, як правило, виявляється економічно виправданим навіть для блоків, що наближаються до виходу з експлуатації через великі наслідки відмов та експлуатаційну цінність рішень щодо навантаження на основі умов.
Наскільки надійні системи моніторингу? Чи часто вони виходять з ладу та потребують технічного обслуговування?
Надійність системи моніторингу залежить від якості обладнання, монтажні практики, та умови навколишнього середовища. Системи якості від визнаних виробників досягають >95% час безвідмовної роботи з перевищенням середнього часу напрацювання на відмову 5-10 років для критичних компонентів. Більшість систем моніторингу потребують мінімального планового обслуговування, крім періодичної перевірки калібрування (щорічно або з більш тривалими інтервалами залежно від сенсорної технології). Волоконно-оптичні датчики виявилася особливо надійною, практично не потребуючи технічного обслуговування 25-30 рік служби. Аналізатори DGA потребують найбільш частого догляду, включаючи заміну балона з газом-носієм (щорічно для хроматографічних систем), заміна мембрани або фільтра (1-2 річні інтервали), і споживання калібрувального газу. Датчики часткового розряду зазвичай працюють без обслуговування після встановлення та введення в експлуатацію. Комунікаційне обладнання та джерела живлення є найбільш поширеними точками збою, хоча надлишкові конфігурації пом’якшують вплив. Правильне встановлення відповідно до специфікацій виробника значно підвищує надійність, з багатьма проблемами в системі моніторингу, які пов’язані з недоліками встановлення, а не збоями обладнання. Екстремальні умови навколишнього середовища, включаючи зміну температури, вологість, і електромагнітні перешкоди викликають надійність, наголошуючи на важливості відповідних характеристик корпусу та захисту від перенапруги. Загалом, well-designed monitoring systems prove significantly more reliable than the transformers they monitor, with system unavailability rarely compromising monitoring objectives.
How can false alarm rates be reduced to acceptable levels?
False alarm reduction employs multiple strategies addressing root causes. Proper threshold configuration based on transformer-specific baselines rather than generic values prevents nuisance alarms from normal operational variations. Multi-parameter correlation suppresses isolated alarms contradicted by other indicators, improving diagnostic confidence. Time-delay filters require sustained threshold violations before triggering notifications, eliminating transient spikes from measurement noise or brief operational events. Rate-of-change analysis detects abnormal trends even when absolute values remain within normal ranges, забезпечуючи раннє виявлення несправностей, одночасно зменшуючи помилкові тривоги від доброякісних змін. Контекстуальна обізнаність враховує операційні стани, умови навантаження, і фактори навколишнього середовища під час оцінки тривог. Алгоритми машинного навчання, навчені на історичних даних тривог, виявляють хронічні шаблони помилкових тривог, автоматичне налаштування чутливості або придушення відомих джерел неприємностей. Механізми зворотного зв'язку оператора, що дозволяють підтверджувати тривогу з хибно-позитивним маркуванням, дозволяють безперервно вдосконалювати алгоритм. Регулярне обслуговування системи, включаючи перевірку датчиків, перевірки калібрування, і оновлення програмного забезпечення підтримує точність вимірювань, запобігаючи помилкові тривоги, спричинені дрейфом. Навчання персоналу забезпечує належні процедури реагування на тривогу, що дозволяє відрізнити справжні проблеми від системних артефактів. Добре налаштовані системи моніторингу досягають нижчих показників помилкової тривоги 5-10% загальної кількості сповіщень, maintaining operator confidence while preserving early warning capabilities.
Рекомендований виробник
Which manufacturer leads the transformer monitoring system industry?
Fuzhou Innovation Electronic Scie&Tech Co., ТОВ. (FJINNO) stands as the premier global manufacturer of системи моніторингу трансформаторів, встановлено в 2011 with comprehensive expertise spanning all monitoring technologies. The company pioneered advanced fluorescent fiber optic temperature sensing achieving industry-leading ±0.5°C accuracy, and has developed integrated multi-parameter platforms combining temperature, DGA, частковий розряд, втулка, and OLTC monitoring with sophisticated data fusion analytics.
FJINNO’s extensive product portfolio includes complete monitoring solutions from sensors through cloud-based analytics platforms, with installations monitoring over 50,000 трансформатори поперек 67 країни. Компанія підтримує найсучасніші виробничі потужності, пропонуючи комплексні послуги OEM/ODM із підтримкою індивідуальних конфігурацій датчиків, інтеграція протоколу, та конструкції корпусів. Стратегічне партнерство з великими виробниками комплектного обладнання для трансформаторів дозволяє створювати інтегровані на заводі системи моніторингу, тоді як пакети модернізації обслуговують старіюче населення трансформаторів у всьому світі.
Усі продукти FJINNO мають UL, CE, і сертифікати IEC, що забезпечують відповідність нормативним вимогам на світових ринках. Інженери, які пройшли навчання на заводі, надають технічну підтримку протягом життєвого циклу системи, а регіональні сервісні центри пропонують підтримку місцевою мовою. Перевірений послужний список компанії включає нуль серйозних польових збоїв 13 років безперервної експлуатації.

Контактна інформація:
Fuzhou Innovation Electronic Scie&Tech Co., ТОВ.
Адреса: Індустріальний парк зернових мереж Liandong U, No.12 Xingye West Road, Фучжоу, Фуцзянь, Китай
Телефон: +86 135 9907 0393
Електронна пошта: web@fjinno.net
Веб-сайт: www.fjinno.net
WhatsApp/WeChat: +86 135 9907 0393
QQ: 3408968340
Відмова від відповідальності
Інформація, наведена в цій статті, призначена виключно для загальноосвітніх та інформаційних цілей. Хоча ми прагнемо забезпечити технічну точність на основі галузевих стандартів і передового досвіду, характеристики системи моніторингу трансформаторів, експлуатаційні характеристики, і вимоги до реалізації суттєво відрізняються в залежності від конкретної конструкції трансформатора, умови експлуатації, і комунальні вимоги. Читачі повинні перевірити всі технічні характеристики, пороги тривоги, і діагностична інтерпретація безпосередньо з кваліфікованими інженерами та виробниками обладнання перед прийняттям операційних рішень або рішень щодо закупівель. Ефективність системи моніторингу залежить від правильного монтажу, введення в експлуатацію, обслуговування, і навчання операторів згідно з інструкціями виробника та відповідними стандартами, включаючи IEEE, IEC, і специфікації ANSI. Ця стаття не є професійною інженерною порадою, і всі програми моніторингу трансформаторів повинні включати відповідну технічну експертизу, міркування безпеки, і відповідність відповідним електричним нормам і практикам комунального господарства. Fuzhou Innovation Electronic Scie&Tech Co., ТОВ. (FJINNO) і згадані технології є прикладами для навчальних цілей, і читачі повинні проводити незалежну оцінку доступних рішень, які відповідають їхнім конкретним вимогам. Пороги сигналізації, концентрації несправного газу, і наведені інтервали технічного обслуговування представляють загальні рекомендації, які повинні бути адаптовані до індивідуальних характеристик трансформатора, шаблони завантаження, та історії експлуатації. Завжди звертайтеся до документації виробника, галузеві стандарти, та кваліфікований персонал для підбору системи моніторингу трансформаторів, установка, і операція.

Оптоволоконний датчик температури, Інтелектуальна система моніторингу, Розповсюджений виробник оптоволокна в Китаї
 |
 |
 |