 Оптоволоконные датчики температуры INNO ,системы контроля температуры.
Busbar Connection Temperature Monitoring Essentials

- Critical Challenge: Busbar joint overheating causes 40% of substation failures; traditional infrared thermography cannot penetrate GIS metal enclosures or detect internal hotspots in enclosed busbars
- Technology Solution: Fluorescent fiber optic point-type sensing delivers ±1°C accuracy across -40°C to 260°C range with <1 second response time for direct contact measurement
- Неотъемлемая безопасность: All-dielectric construction with zero metallic components, withstand voltage >100кВ, complete electromagnetic immunity for high-voltage environments
- System Capacity: Single demodulator monitors 4-64 channels simultaneously; fiber length 0-80m per channel; typical 220kV substation requires 16-32 точки измерения
- Intelligent Alarming: Multi-level thresholds including absolute temperature, темп роста (°С/мин), phase imbalance detection, and comparative analysis across similar equipment
- Substation Integration: RS485 Modbus RTU, МЭК 60870-5-101/104, МЭК 61850 MMS protocols for seamless connectivity to SCADA and automation platforms
- Applications Portfolio: 220kV/110kV GIS installations, enclosed busbar duct systems, outdoor rigid bus bridges, copper-aluminum transition joints, traction power substations, data center power distribution
- Operational Longevity: Sensor lifespan exceeds 25 годы, работа без обслуживания, калибровка не требуется, IP67 protection rating, seismic resistance to 8-degree intensity
- Economic Justification: Single busbar failure causes equipment damage and outage losses; system deployment prevents catastrophic failures and extends asset service life
- Гарантия качества: ИСО 9001 certified manufacturing, CE/RoHS compliance, type test certifications, 500+ power utility installations, export to 30+ страны
1. Why Do Busbar Connections Tend to Overheat? Critical Failure Mechanisms Explained
1.1 What Causes Increased Contact Resistance in Busbar Joints?
Busbar connection degradation stems from multiple simultaneous mechanisms affecting current-carrying capacity. Bolted connections experience torque relaxation over operational cycles due to thermal expansion, vibration from electromagnetic forces, and mechanical settling of contact surfaces. As fastening pressure decreases, microscopic air gaps develop at the interface, concentrating current flow through reduced effective contact area.
Surface oxidation represents another critical failure mode. Atmospheric oxygen reacts with copper or aluminum conductors, forming oxide films with significantly higher electrical resistance than base metals. These insulating layers increase junction resistance, generating localized Joule heating proportional to I²R losses. The heating accelerates oxidation in a destructive positive feedback cycle.
1.1.1 Copper-Aluminum Transition Joint Galvanic Corrosion
Copper-aluminum transition joints present special challenges due to dissimilar metal electrochemical reactions. When moisture penetrates connections, galvanic cells form between the metals, causing preferential aluminum corrosion. Corrosion products accumulate at interfaces, dramatically increasing contact resistance. Industry data indicates transition joints experience failure rates 3-5 times higher than homogeneous metal connections without proper protection.
1.1.2 Thermal Cycling Effects on Connection Integrity
Differential thermal expansion coefficients between busbar conductors, fasteners, and washers create mechanical stress during load cycling. Daily and seasonal temperature variations cause microscopic movement at interfaces, wearing protective platings and promoting fretting corrosion. Over years of service, these cumulative effects degrade electrical and mechanical performance.
1.2 What Consequences Result from Busbar Joint Overheating?
1.2.1 Insulation System Degradation Pathways
Elevated temperatures accelerate chemical decomposition of polymeric insulation materials surrounding шинные соединения. Epoxy resins, silicone rubbers, and heat-shrink tubing lose dielectric strength when exposed to sustained temperatures exceeding design ratings. Thermal aging reduces breakdown voltage, increases dielectric loss tangent, и способствует образованию следов на загрязненных поверхностях.
В ГИС-оборудование, перегрев вызывает разложение газа SF6, производство коррозийных и токсичных побочных продуктов, включая фториды серы и фториды металлов.. Эти соединения разъедают алюминиевые компоненты и разрушают поверхности изоляторов., нарушая как электрическую изоляцию, так и механическую целостность. Газовый анализ, выявляющий повышенную концентрацию продуктов разложения, служит ранним индикатором термического стресса..
1.2.2 Катастрофическое развитие отказов
Не отмечено busbar overheating следует предсказуемым путям эскалации. Начальное повышение температуры увеличивает контактное сопротивление., что приводит к дополнительному нагреву, ускоряющему разрушение. Когда температура перехода превышает точку плавления проводника (1085°C для меди, 660°C for aluminum), происходит плавление или испарение металла. Капли расплавленного металла могут преодолеть фазовое расстояние, инициирование междуфазных замыканий или замыканий на землю.
Documented case study: A 220kV substation experienced busbar bolted connection failure resulting in single-phase-to-ground fault, SF6 gas release, and equipment damage. Post-incident analysis revealed the failed connection operated at 150°C above ambient for approximately six months before catastrophic failure. Total losses including equipment replacement, system downtime, and emergency response exceeded substantial amounts, demonstrating the critical importance of continuous тепловой мониторинг.
1.3 Why Cannot Traditional Inspection Methods Detect Busbar Joint Problems?
1.3.1 Infrared Thermography Fundamental Limitations
Инфракрасное тепловидение provides non-contact temperature assessment by detecting radiated energy in the infrared spectrum. Однако, the technique faces insurmountable obstacles in modern ГИС-установки where critical connections reside inside grounded metal enclosures. Infrared radiation cannot penetrate metallic barriers, limiting measurements to external cabinet surfaces that exhibit minimal temperature correlation with internal hotspots.
Even for accessible outdoor busbar установки, infrared accuracy depends on surface emissivity knowledge, proper measurement angle, reflected background radiation compensation, and atmospheric absorption correction. Painted, oxidized, or contaminated surfaces exhibit variable emissivity, introducing significant measurement uncertainty. Wind cooling effects further distort external temperature readings, potentially masking dangerous internal conditions.
1.3.2 Manual Inspection Cycle Inadequacy
Conventional maintenance schedules specify monthly or quarterly infrared surveys, creating extended periods without surveillance. Rapid failure progression between inspections prevents timely intervention. Thermographic data represents instantaneous snapshots without continuous trending capability to identify gradual degradation patterns. Inspectors cannot access energized equipment interiors, leaving critical GIL busbar связи и enclosed busbar duct internals completely unmonitored.
1.3.3 Safety Hazards of Manual Assessment
Inspectors working near energized высоковольтное оборудование face electrical hazards including arc flash, electrocution, and blast injury risks. Climbing structures to measure elevated buswork introduces fall hazards. Автоматизированный online temperature monitoring eliminates personnel exposure while providing superior data quality and temporal resolution.
2. Как Fluorescent Fiber Optic Sensing Solve Busbar Monitoring Challenges?
2.1 What Operating Principles Govern Флуоресцентное измерение температуры?
2.1.1 Rare-Earth Fluorescence Temperature Dependence
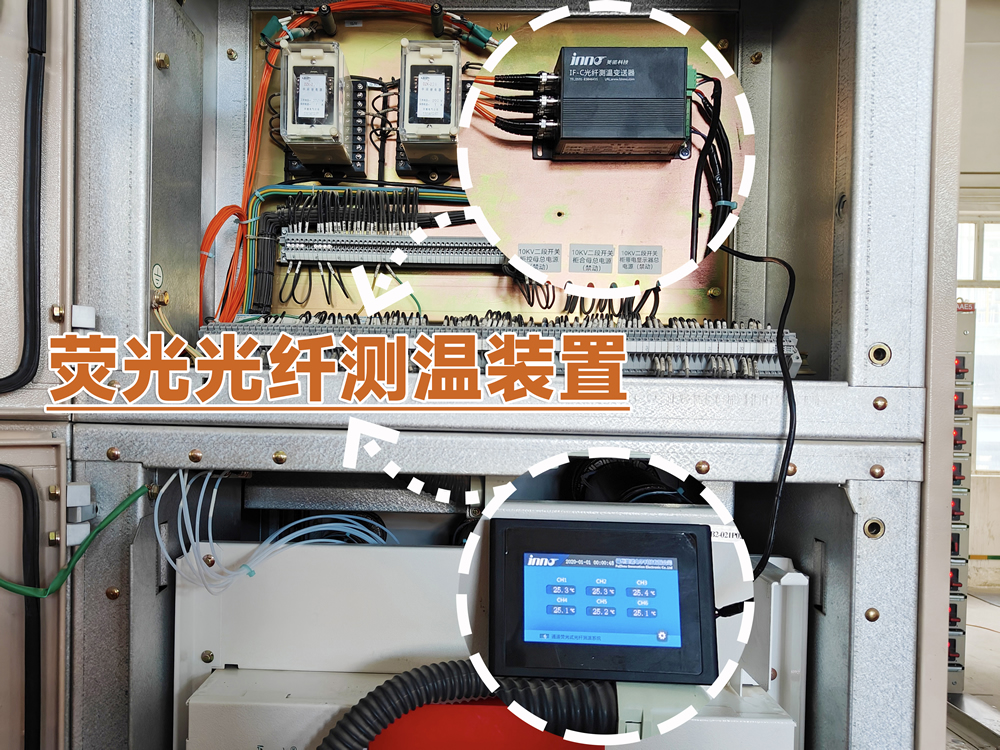
The флуоресцентный оптоволоконный датчик exploits temperature-sensitive fluorescence decay characteristics of rare-earth phosphor materials. When excited by specific wavelength light pulses (typically blue or UV), doped crystals emit longer wavelength fluorescence. The temporal decay of this fluorescence emission exhibits precise exponential relationship with absolute temperature according to quantum mechanical principles.
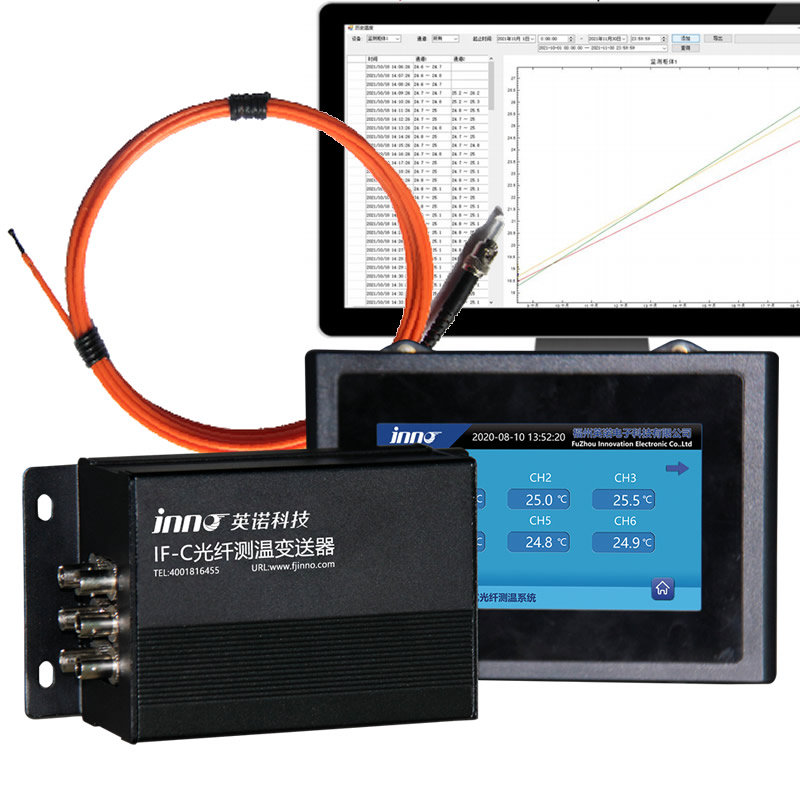
На сенсорный зонд кончик, excitation light delivered through optical fiber stimulates the fluorescent material. Emitted fluorescence returns through the same fiber to a temperature demodulator containing photodetectors and signal processing electronics. By measuring fluorescence lifetime—the time constant of exponential decay—the system calculates temperature with accuracy independent of light intensity, потери на изгибе волокна, или деградация разъема. This intensity-independent characteristic provides exceptional long-term stability compared to conventional fiber optic sensors.
2.1.2 Point-Type Versus Distributed Temperature Sensing
Point-type fluorescent sensing delivers superior spatial resolution and measurement precision compared to distributed fiber optic systems based on Raman or Brillouin scattering. Each measurement location employs dedicated fiber and discrete sensor, enabling independent temperature assessment without cross-channel interference. Distributed systems average temperature over meter-scale spatial resolution, potentially masking localized hotspots at specific bolted connections или splice joints.
The point architecture supports flexible network topologies. A single multi-channel оптоволоконный датчик температуры connects to multiple independent sensing points through star configuration or daisy-chain routing. This modularity facilitates system expansion and troubleshooting compared to continuous distributed fiber requiring complete replacement when damaged.
2.2 Why Does Fluorescent Technology Excel in High-Voltage Applications?
2.2.1 All-Dielectric Construction Benefits
The sensor assembly contains exclusively insulating materials: quartz optical fiber, ceramic or polymer probe body, and fluorescent crystal. Complete absence of conductive elements eliminates electrical safety concerns inherent to metallic sensors like термопары, датчики температуры сопротивления, or thermoelectric devices. No clearance distances or creepage path requirements constrain installation, allowing direct mounting on energized busbar conductors и связи.
Dielectric withstand testing validates >100kV voltage tolerance between sensor and ground. This capability enables placement on 220kV and 110kV шинные системы without insulation coordination concerns. The probe functions equally well on grounded equipment, floating potentials, or fully energized conductors.
2.2.2 Electromagnetic Immunity Characteristics
Optical signal transmission remains completely unaffected by electromagnetic fields, радиочастотные помехи, or harmonic distortion present in силовые подстанции. Strong magnetic fields surrounding high-current шины during fault conditions or switching transients do not influence measurement accuracy. This immunity proves especially valuable in applications involving variable frequency drives, power electronic converters, or traction power systems generating severe electrical noise.
Where wireless temperature sensors require battery power and radio transmitters—both susceptible to electromagnetic disturbance—флуоресцентное оптоволокно systems operate purely on optical principles. No batteries eliminate maintenance requirements and failure modes associated with electrochemical energy storage in demanding thermal environments.
2.3 What Performance Advantages Distinguish Fluorescent Sensing from Alternatives?
2.3.1 Comparison with Infrared Thermography
Флуоресцентные датчики provide direct contact measurement at critical junctions, while infrared imaging detects only surface radiation. Contact sensing eliminates emissivity uncertainty, atmospheric attenuation, and reflected energy errors affecting infrared accuracy. Continuous online monitoring captures transient thermal events missed by periodic surveys. Installation inside КРУЭ-корпуса и enclosed busbar ducts overcomes fundamental infrared penetration limitations.
2.3.2 Comparison with Wireless Temperature Indicators
Battery-powered wireless sensors suffer from limited operational life (обычно 3-5 годы), requiring periodic replacement and disposal. Fluorescent probe lifespan exceeds 25 лет без технического обслуживания. Wireless transmission reliability degrades inside grounded metal enclosures due to electromagnetic shielding, while optical fiber penetrates cabinet walls through small ports. Wireless devices also introduce additional electronic components subject to electromagnetic interference and thermal stress failures.
2.3.3 Comparison with Metallic Temperature Sensors
Thermocouples and RTDs exhibit measurement drift over time, requiring periodic calibration. Thermoelectric voltage signals suffer from noise pickup in electrically noisy environments. Lead wire resistance affects RTD accuracy unless compensated through 3-wire or 4-wire configurations. Оптоволоконный контроль температуры provides inherent calibration stability through physics-based measurement independent of aging effects. The non-metallic construction eliminates insulation requirements and safety clearances mandatory for resistive devices.
2.3.4 Comparison with Distributed Fiber Optic Systems
Distributed temperature sensing based on Raman or Brillouin scattering offers continuous measurement along fiber length but with reduced accuracy (typically ±2-5°C), slower response (30-60 секунды), and meter-scale spatial resolution. Point fluorescent systems achieve ±1°C accuracy, sub-second response, and millimeter-scale localization. For critical applications requiring precise hotspot detection at specific клеммы подключения, point sensing delivers superior performance at competitive installed cost.
3. Which Busbar Equipment Requires Temperature Monitoring Systems?
3.1 What GIS/GIL Components Need Measurement Points?
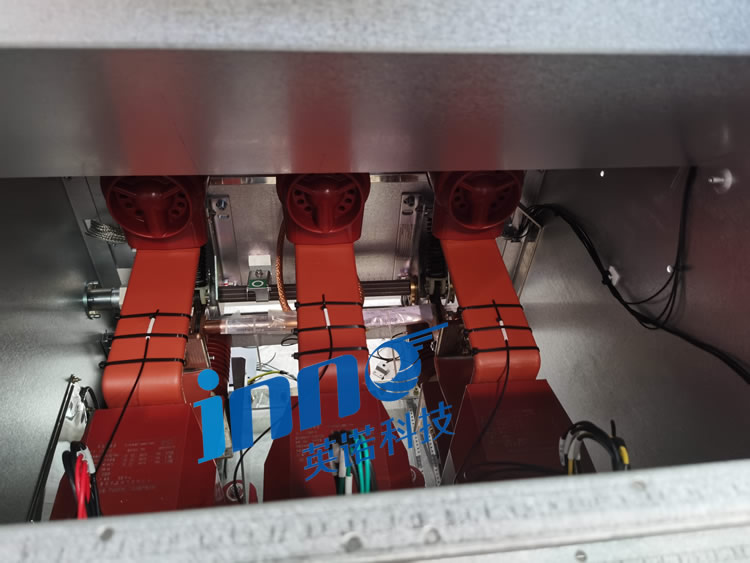
3.1.1 Busbar Connection Flange Monitoring
Распределительное устройство с элегазовой изоляцией employs bolted flanges to join busbar sections and connect equipment modules. Each three-phase flange contains six to nine bolted connections (two or three per phase) representing potential failure points. Recommended monitoring includes at minimum one сенсорный зонд per phase on critical flanges such as transformer feeders, generator connections, and inter-bay links. High-importance circuits may justify monitoring all connections for redundancy.
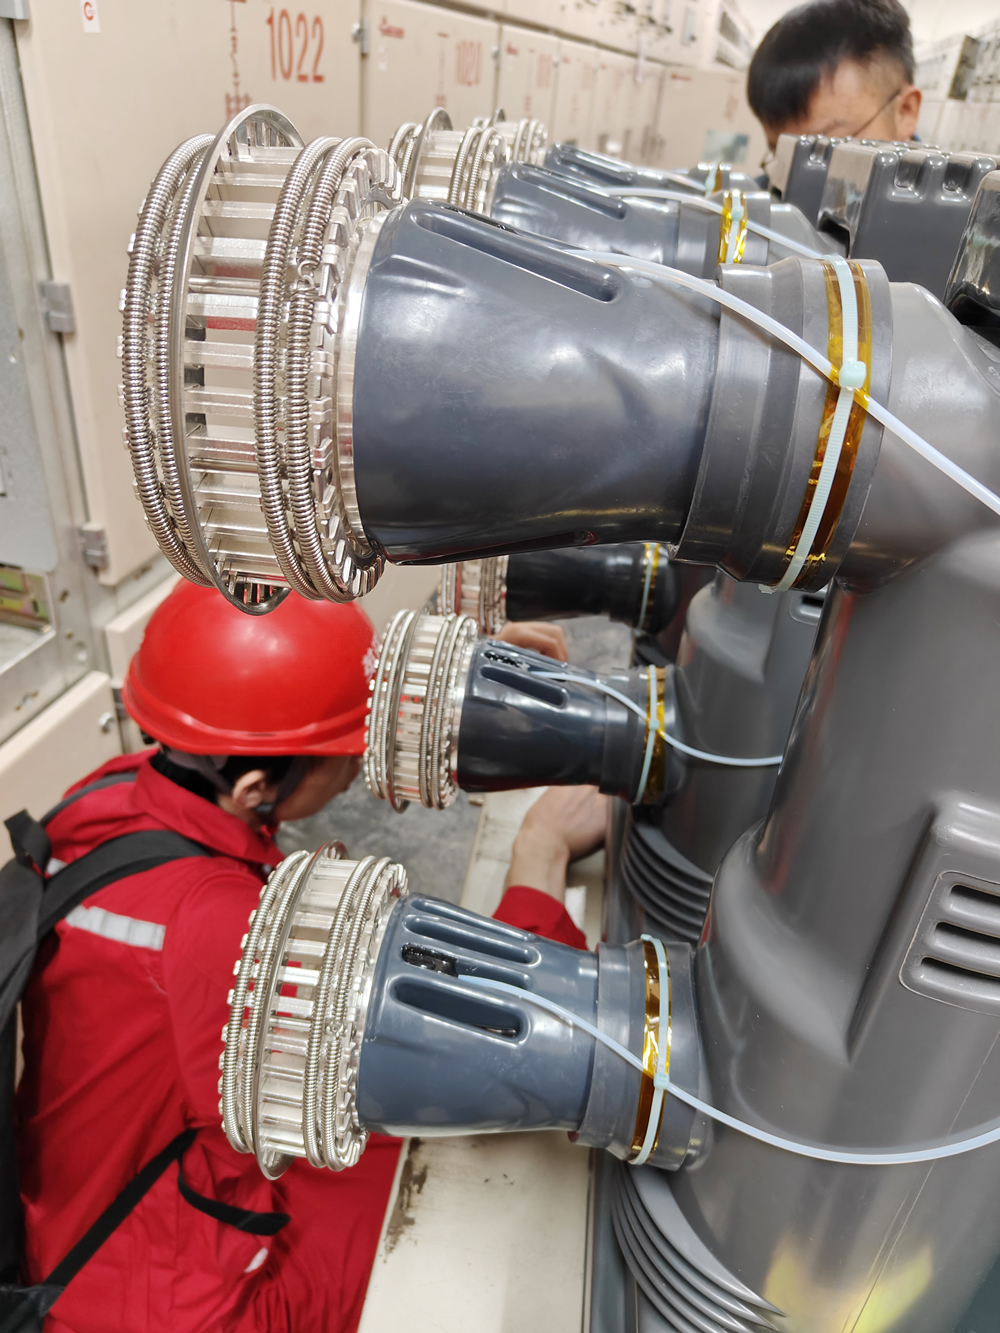
3.1.2 Cable Termination and Feeder Connections
Where power cables enter ГИС-оборудование through cable sealing ends or plug-in terminals, переход от жилы кабеля к шине представляет собой высокоомное соединение. Компрессионные наконечники, механические разъемы, и клеммные шпильки выделяют тепло под током нагрузки.. Мониторинг этих интерфейсов предотвращает сбои, которые могут привести к неисправностям кабелей или повреждению оборудования..
3.1.3 Контакты разъединителя и заземлителя
В разъединителях в отсеках КРУЭ используются скользящие или вращающиеся контакты, подверженные износу., загрязнение, и проблемы с выравниванием. Заземлители carry high fault currents during system events, experiencing severe mechanical and thermal stress. Both switch types benefit from contact temperature surveillance to detect degradation before catastrophic failure.
3.2 How to Configure Enclosed Busbar Duct Monitoring?
3.2.1 Busbar Splice Joint Measurement
Закрытые шинные системы consist of aluminum or copper bars housed in protective enclosures, with joints every few meters to accommodate thermal expansion and facilitate installation. Each splice joint utilizes bolted connections or welded interfaces—both susceptible to increased resistance over time. Typical monitoring schemes place one or two датчики температуры per splice across all phases. For a 50-meter busbar run with 10-meter sections, this approach yields 10-20 точки измерения.
3.2.2 Branch Connection and Tap-Off Monitoring
Where feeder circuits tap off main distribution busbars, ответвленные соединения создают дополнительные соединения и потенциальные точки отказа. Т-образные соединения, фазовые изоляторы, и врезка центров нагрузки требуют индивидуальной оценки температуры. Размещение для мониторинга должно уделять особое внимание наиболее актуальным филиалам и местам с историческими проблемами..
3.2.3 Интерфейсы проникновения через стену и фазового барьера
Проходки шин через бетонные стены, противопожарные барьеры, or phase segregation panels create mechanical constraint points with differential thermal expansion. Sealing materials may harden over time, imposing stress on conductors. Bushing terminals at penetrations warrant monitoring due to combination of mechanical stress and electrical connection.
3.3 Which Outdoor Busbar Components Demand Surveillance?
3.3.1 Flexible Connector to Rigid Bus Transitions
Открытый high-voltage substations employ flexible braided connectors or expansion joints between rigid aluminum tube bus sections to accommodate thermal expansion and seismic movement. Эти flexible bus connections experience mechanical flexing, environmental exposure, and contact surface oxidation. Temperature monitoring detects deterioration before complete failure causes system outage.
3.3.2 Busbar Expansion Joint Monitoring
Expansion joints accommodate thermal length changes in long rigid bus runs. Sliding contact designs or bellows-type joints introduce contact resistance and wear surfaces. Monitoring identifies excessive friction heating or joint binding that impedes proper expansion.
3.3.3 Equipment Terminal Connections
Connections between outdoor buswork and transformer bushings, circuit breaker terminals, or disconnect switch blades represent critical interfaces. Terminal bolting torque, surface condition, and alignment directly affect contact resistance and thermal performance. Each phase connection should receive dedicated оптоволоконный датчик температуры покрытие.
3.4 What Special Applications Require Busbar Temperature Monitoring?
3.4.1 Traction Power Substation DC Busbars
Railway electrification systems utilize rectifier substations converting AC to DC for train propulsion. DC busbar systems carry extremely high continuous currents (thousands of amperes) with superimposed pulsating loads from multiple trains. Contact resistance has proportionally greater thermal impact under DC operation compared to AC. Both positive and negative bus connections require comprehensive тепловой мониторинг.
3.4.2 Data Center High-Current Distribution
Современный центры обработки данных employ overhead or underfloor busbar systems delivering megawatts to server racks through tap-off connections. The mission-critical nature of data center operations makes prevention of busbar failures imperative. Monitoring schemes address main distribution busbars, PDU connections, and static transfer switch terminals.
3.4.3 Industrial Rectifier and Electrolysis Applications
Aluminum smelters, chlor-alkali plants, and other electrochemical processes utilize massive DC busbar systems carrying tens or hundreds of kiloamperes. Copper-aluminum transition joints at rectifier outputs, anode connections, and cell interconnections experience severe thermal and corrosive environments. Temperature monitoring integrated with process control systems optimizes operation while preventing equipment damage.
3.4.4 Renewable Energy Collector Systems
Wind farm and solar power plant коллекторные подстанции aggregate generation from multiple sources through распределительное устройство and busbar networks. Intermittent generation patterns cause thermal cycling that accelerates connection degradation. Step-up transformer feeders, generator connections, and reactive compensation equipment all benefit from continuous temperature assessment.
4. How Many Measurement Points Can the System Monitor? Configuration Options
4.1 What Channel Capacities Do Demodulators Offer?
Стандартный оптоволоконный температурный демодулятор configurations support 4, 8, 16, 32, или 64 independent measurement channels within a single chassis. Each channel connects to one fluorescent sensor probe through dedicated optical fiber up to 80 meters in length. The multi-channel architecture enables centralized data acquisition and processing while distributing sensors throughout monitoring zones.
Demodulator selection depends on total measurement point requirements, physical distribution geometry, and system redundancy considerations. Smaller substations may deploy one 16-channel unit, while large facilities utilize multiple 32-channel or 64-channel systems. Modular expansion capability allows initial installation of basic capacity with field upgrades as monitoring needs grow.
4.2 How Many Monitoring Points Does a Typical Substation Need?
4.2.1 220kV Substation Configuration Example
A representative 220kV transmission substation with two transformer bays, four line bays, and auxiliary equipment might configure monitoring as follows:
- Main transformer HV bushings: 3 phases × 2 transformers = 6 очки
- Transformer MV and LV feeders: 3 × 2 × 2 = 12 очки
- GIS line bay связи: 3 × 4 bays = 12 очки
- Bus coupler and sectionalizer: 6 очки
- Cable connections and critical joints: 8-12 очки
Total system requirement: 44-50 точки измерения, accommodated by two 32-channel demodulators with expansion capacity.
4.2.2 110kV Distribution Substation Approach
Medium-voltage distribution substations with 10-15 feeder bays typically monitor:
- Main transformer connections: 6-9 очки
- Each feeder bay critical joints: 2-3 points × 12 bays = 24-36 очки
- Bus sectionalizers and tie breakers: 4-6 очки
- Reactive compensation equipment: 3-6 очки
A single 64-channel system or two 32-channel units provide adequate capacity.
4.2.3 35kV Switchgear and Distribution Applications
Промышленные предприятия, renewable energy facilities, and commercial complexes operating at 35kV distribution voltage install распределительное устройство с металлическим покрытием with numerous feeder circuits. Each circuit breaker cubicle contains 6-9 critical measurement points (three-phase upper contacts, lower contacts, cable terminals). A facility with 20 feeders requires 120-180 датчики, implementable through three to six demodulator chassis depending on channel density selection.
4.3 What Factors Determine Optimal Measurement Point Quantity?
4.3.1 Equipment Criticality Assessment
Priority monitoring addresses equipment whose failure would cause significant operational, безопасность, or financial consequences. Main transformer connections, generator feeders, and critical process loads receive comprehensive coverage. Less critical distribution circuits may employ selective monitoring based on risk assessment.
4.4.2 Historical Failure Data Analysis
Maintenance records identifying previously failed connections, thermographic survey hotspots, and equipment types with known reliability issues guide measurement point allocation. Components with failure history justify more extensive monitoring than equipment with proven reliability.
4.3.3 Economic Optimization Modeling
Cost-benefit analysis balances monitoring system investment against prevented failure costs and operational improvements. While comprehensive coverage provides maximum protection, practical deployments optimize measurement point quantity to address highest-risk locations within budget constraints. Phased implementation strategies install core monitoring initially with planned expansion based on operational experience and evolving requirements.
5. What Temperature Accuracy Can Be Achieved? Performance Specifications
5.1 What Measurement Precision Standards Apply?
The флуоресцентная оптоволоконная система контроля температуры delivers ±1°C accuracy across the complete -40°C to 260°C measurement range. This full-scale precision ensures reliable detection of abnormal temperature conditions throughout normal operation and fault scenarios. Temperature resolution of 0.1°C enables identification of subtle trending patterns indicating gradual equipment degradation.
Время ответа под 1 second captures rapid thermal transients during switching operations, условия неисправности, or sudden load changes. Fast response combined with continuous sampling (обычно 1-10 second intervals) provides real-time thermal surveillance exceeding capabilities of periodic infrared surveys or manual inspections.
5.2 How Do System Reliability Parameters Compare?
5.2.1 Sensor Probe Operational Lifespan
Люминесцентные датчики температуры achieve >25 year operational life under continuous service in harsh electrical environments. The physics-based measurement principle exhibits no aging drift or calibration degradation. Absence of batteries, электронные компоненты, or consumable elements in the probe assembly eliminates common failure modes affecting other sensing technologies.
5.2.2 Среднее время между отказами
Demodulator electronics designed for industrial environments achieve MTBF exceeding 50,000 часы (примерно 5.7 лет непрерывной работы). Redundant power supply options, watchdog circuits, and self-diagnostic capabilities enhance overall system reliability. Field experience demonstrates actual reliability substantially exceeding theoretical predictions due to conservative component selection and rigorous quality control.
5.2.3 Environmental Protection Standards
Demodulator chassis maintain IP65 protection against dust ingress and water spray, suitable for indoor substation control room installation. Sensor probes achieve IP67 rating, providing submersion resistance for outdoor installations or locations subject to condensation, washing, or weather exposure. Hermetically sealed probe construction prevents moisture infiltration that could compromise measurement accuracy or dielectric strength.
5.2.4 Withstand Voltage Capabilities
Type testing validates sensor insulation withstand voltage >100kV AC at power frequency, exceeding requirements for direct mounting on 220kV and 110kV systems. Dielectric strength testing protocols follow IEC 60060 standards for high-voltage testing procedures. The all-dielectric construction provides inherent voltage tolerance without relying on insulating barriers or clearance distances.
5.3 What Environmental Operating Conditions Are Supported?
5.3.1 Temperature Range Adaptation
Demodulator electronics operate across -40°C to +85°C ambient temperature range, accommodating outdoor installations in extreme climates from arctic to tropical environments. Sensor probes measure across -40°C to 260°C, providing substantial margin above normal busbar operating temperatures (обычно <80°С) while detecting severe overheating conditions approaching conductor damage thresholds.
5.3.2 Humidity and Condensation Tolerance
Systems function throughout 5%-95% relative humidity range including condensing conditions. Conformal coating of electronic assemblies, sealed connectors, and moisture-resistant materials enable reliable operation in high-humidity substations, coastal installations, or tropical climates.
5.3.3 Seismic and Vibration Resistance
Mechanical design follows 8-degree seismic intensity criteria per Chinese seismic design codes (approximately 0.3g peak ground acceleration). Vibration testing validates performance under continuous vibration and shock loading representative of switchgear operation, mechanical equipment nearby, or transportation environments. Secure fiber routing, strain relief provisions, and robust probe attachment methods prevent mechanical failure during seismic events.
5.3.4 Электромагнитная совместимость
Equipment meets IEC 61000 electromagnetic compatibility standards including immunity to electrostatic discharge, radiated RF fields, electrical fast transients, surge voltages, and conducted disturbances. Emission testing confirms compliance with radiated and conducted emission limits. Comprehensive EMC qualification ensures reliable operation in severe electromagnetic environments characteristic of силовые подстанции и промышленные объекты.
6. How Does Intelligent Alarm Functionality Work? Predictive Capabilities
6.1 What Alarm Threshold Configurations Are Available?
6.1.1 Absolute Temperature Limit Alarms
The system supports user-configurable warning and critical temperature thresholds for each measurement point. Typical configurations establish warning levels 20-30°C below critical limits, providing advance notice of developing problems. Например, шинные соединения might set 80°C warning and 100°C critical thresholds based on equipment ratings and historical operating data.
Multi-level alarming enables graduated response protocols. Warning alarms trigger investigation and trending analysis without immediate operational action. Critical alarms mandate urgent response including load reduction, equipment inspection, or emergency shutdown depending on severity and affected systems.
6.1.2 Temperature Rate-of-Rise Detection
Beyond static temperature thresholds, the system calculates temperature change rates (°C/minute or °C/hour) to identify abnormally rapid heating. Sudden resistance increases from loose connections, contact deterioration, or incipient faults produce characteristic rapid temperature rise signatures. Rate-based alarms detect these conditions earlier than absolute temperature limits, providing additional response time for corrective action.
6.1.3 Phase Imbalance Comparison
For three-phase equipment, the system automatically compares temperatures across phases to identify asymmetric conditions. Significant phase-to-phase temperature differences (обычно >10-15°С) indicate single-phase problems like loose connections, unbalanced loading, or contact defects. This comparative analysis proves especially valuable since three-phase systems should exhibit similar thermal behavior under balanced load conditions.
6.1.4 Equipment Class Benchmarking
Advanced alarming compares similar equipment types (например, all line feeder connections) to identify outliers operating warmer than peers. Statistical analysis of temperature distribution across equipment populations highlights degrading units even when absolute temperatures remain below alarm thresholds. This predictive approach detects deterioration trends before conventional alarms trigger.
6.2 How Are Operators Notified of Alarm Conditions?
6.2.1 Local Annunciation
Temperature demodulators provide local visual and audible alarm indication through panel-mounted indicators, LCD displays, or touchscreen interfaces. Color-coded status LEDs (green/yellow/red) convey normal/warning/critical conditions at a glance. Audible alarms with silence acknowledgment ensure operator awareness even when displays are not actively monitored.
6.2.2 Centralized Monitoring System Integration
Alarm data transmits to substation СКАДА-системы, платформы управления зданием, or dedicated monitoring software through standard communication protocols. Centralized displays show station-wide temperature status with alarmed points highlighted. Operators access detailed trending, measurement histories, and diagnostic information for investigation and troubleshooting.
6.2.3 Remote Notification Channels
Email and SMS text message notifications alert designated personnel when alarm conditions occur, enabling rapid response regardless of operator location. Configurable notification lists, escalation procedures, and time-based routing ensure appropriate staff receive alerts. Remote notification proves especially valuable for unattended facilities, after-hours monitoring, or critical equipment requiring immediate attention.
6.3 What Historical Data Capabilities Support Predictive Maintenance?
Continuous data logging captures complete temperature histories for trend analysis and equipment health assessment. Nonvolatile memory stores minimum 5 years of measurement data at configurable sampling rates. Historical databases enable:
- Long-term trending to identify gradual degradation patterns
- Seasonal variation analysis for baseline establishment
- Load correlation studies linking temperature to current magnitude
- Failure forensics through pre-event data review
- Maintenance effectiveness validation by comparing pre- and post-maintenance temperatures
Automated report generation produces daily, weekly, monthly, and annual temperature summaries with statistical analysis, alarm event logs, and equipment health scoring. These reports support regulatory compliance documentation, asset management programs, и инициативы постоянного улучшения.
7. How Does the System Interface with Substation Automation?
7.1 Which Communication Protocols Are Supported?
7.1.1 RS485 Modbus RTU Industrial Standard
Стандартный RS485 serial communication using Modbus RTU protocol provides robust connectivity for industrial environments. Transmission distances up to 1200 meters support distributed demodulator placement throughout substations. Multi-drop capability allows up to 32 устройства (expandable with repeaters) on single bus network. Configurable parameters include baud rates from 9600 к 115200 б/с, data bits, parity, and stop bits for compatibility with diverse master systems.
7.1.2 МЭК 60870-5-101/104 Power Utility Protocols
The IEC 60870-5 series represents international standards for telecontrol equipment and systems in electrical engineering and power system automation. Protocol support enables seamless integration with utility SCADA master stations, remote terminal units (RTUs), and substation automation gateways. Both serial (101) and TCP/IP (104) variants accommodate different network architectures.
7.1.3 МЭК 61850 Substation Automation Standard
МЭК 61850 определяет сети и системы связи для автоматизации энергосистемы, providing object-oriented data models, high-speed peer-to-peer messaging, and time synchronization. Мониторинг температуры integration through IEC 61850 enables advanced applications including coordinated control, event sequence recording, and integration with protection systems. Спецификация производственного сообщения (ММС) provides standardized access to real-time data and configuration parameters.
7.1.4 OPC UA Industrial Interoperability
Open Platform Communications Unified Architecture (ОПЦ ЮА) provides vendor-neutral industrial automation connectivity. Platform-independent architecture supports integration with enterprise systems, облачные платформы, and Industry 4.0 приложения. Secure authentication, зашифрованная связь, and information modeling capabilities facilitate digital transformation initiatives.
7.2 What Integration Architectures Are Possible?
7.2.1 Direct SCADA Connection
Temperature demodulators connect directly to substation automation system RTUs or data concentrators through serial or Ethernet interfaces. Real-time data including individual point temperatures, статус тревоги, and diagnostic information upload to master stations for centralized visualization and archiving. Integration depth ranges from simple analog value reporting to complex event notification and time-series data streaming.
7.2.2 Standalone Monitoring Networks
Преданный temperature monitoring networks operate independently from primary SCADA infrastructure, providing isolation and security. Standalone architecture suits applications requiring separate monitoring for safety systems, critical infrastructure protection, or installations where existing automation systems lack expansion capacity. Dedicated monitoring stations offer specialized displays, расширенная аналитика, and operator interfaces optimized for thermal management.
7.2.3 Cloud-Based Data Analytics
Modern installations leverage cloud connectivity for advanced analytics, remote access, and multi-site aggregation. Secure gateway devices upload temperature data to cloud platforms providing machine learning analysis, обнаружение аномалий, and predictive maintenance algorithms. Cloud architectures enable centralized monitoring of distributed facilities, vendor remote support, and correlation with external data sources like weather, commodity prices, or market conditions.
7.3 What Data Upload Intervals Are Typical?
Real-time temperature measurements update at 1-10 second intervals depending on application criticality and communication bandwidth. Faster update rates (1-2 секунды) suit dynamic processes or rapid-response applications. Slower intervals (5-10 секунды) suffice for thermal mass equipment with gradual temperature changes. Alarm events trigger immediate notification regardless of normal polling schedules, ensuring timely awareness of abnormal conditions.
Historical data uploads occur through scheduled batch transfers to minimize communication overhead. Typical configurations archive minute-average, hourly-average, and daily-average values with configurable retention periods. Event-triggered uploads capture alarm occurrences, пересечение порогов, and operator actions with precise timestamps for forensic analysis.
8. Which Industries Are Implementing Busbar Temperature Monitoring?
8.1 What Power Utility Applications Dominate Deployment?
8.1.1 Transmission and Distribution Substations
Electric utilities represent the largest market segment for контроль температуры шин, with installations spanning voltage classes from 35kV distribution to 500kV transmission. National grid operators implement standardized monitoring specifications across substation portfolios to reduce failure rates, extend equipment life, and optimize maintenance resources. Typical deployments address ГИС-оборудование, открытый подстанции с воздушной изоляцией, and hybrid installations combining both technologies.
8.1.2 Renewable Energy Generation Facilities
Ветровые электростанции, solar power plants, and energy storage installations utilize коллекторные подстанции aggregating distributed generation for grid interconnection. Variable generation patterns create thermal cycling stress on electrical connections. Системы мониторинга optimize operation, prevent revenue loss from unplanned outages, and support remote facility management with minimal on-site staffing. Battery energy storage systems particularly benefit from thermal management preventing fire hazards and maximizing cycle life.
8.1.3 Hydroelectric and Thermal Power Stations
Generating stations employ high-current шинные системы connecting generators to step-up transformers and transmission networks. Generator bus ducts, unit auxiliary transformers, and station service distribution all incorporate temperature monitoring. Continuous surveillance prevents forced outages, снижает затраты на техническое обслуживание, and extends major equipment service intervals. Integration with plant distributed control systems enables automated load optimization based on thermal constraints.
8.2 Why Do Industrial Facilities Require Busbar Monitoring?
8.2.1 Heavy Industry Process Reliability
Сталелитейные заводы, алюминиевые заводы, химические заводы, and refineries operate continuous processes where electrical failures cause substantial production losses and safety hazards. Mission-critical electrical infrastructure receives comprehensive тепловой мониторинг to prevent disruptions. Arc furnace installations, electrolytic cells, and large motor drives present particularly demanding thermal management challenges.
8.2.2 Manufacturing Facility Uptime Requirements
Automotive assembly plants, semiconductor fabrication facilities, и фармацевтические производители поддерживают строгие производственные графики с минимальными простоями. Прогностическое обслуживание активируется контролем температуры, предотвращает незапланированные перерывы в работе, поддерживает запланированные окна обслуживания, и оптимизирует сроки замены оборудования. Системы управления производством интегрируют тепловые данные для обеспечения общей эффективности оборудования. (OEE) оптимизация.
8.2.3 Критическая инфраструктура центра обработки данных
Hyperscale data centers, услуги колокейшн, и серверные помещения предприятий реализуют резервное распределение электроэнергии с шинные системы подача мегаватт для ИТ-нагрузок. Стандарты надежности Tier III и Tier IV требуют постоянного мониторинга., Резервирование N+1, и отсутствие незапланированных простоев. Датчики температуры на главных распределительных шинах, распределительные устройства (PDU), автоматические переключатели резерва, и филиальные сети обеспечивают надежность инфраструктуры, поддерживая облачные сервисы, финансовые системы, и телекоммуникационные сети.
8.3 Какие существуют специализированные транспортные приложения?
8.3.1 Железнодорожные тяговые энергосистемы
Electrified railways including metros, Скоростной трамвай, and high-speed trains utilize traction substations converting utility power to DC or low-frequency AC for train propulsion. Rectifier busbars carrying thousands of amperes require robust thermal management. Third rail systems, overhead catenary supports, and substation distribution all incorporate temperature monitoring. Integration with railway signaling and operations control centers coordinates power management with train scheduling.
8.3.2 Airport Ground Power and Lighting
Airport electrical infrastructure supports runway lighting, terminal buildings, fueling systems, and aircraft ground power. Reliability requirements for navigational aids and critical lighting demand predictive maintenance. Системы мониторинга address airfield electrical vaults, lighting control centers, and terminal distribution.
8.3.3 Marine and Offshore Installations
Ships, морские платформы, and marine terminals operate in harsh environments with limited maintenance access. Флуоресцентное оптоволокно systems provide corrosion resistance, иммунитет к электромагнитным помехам, and reliable operation under vibration and thermal cycling. Marine classification societies increasingly specify online monitoring for critical electrical systems.
8.4 How Do Commercial Buildings Benefit from Temperature Monitoring?
High-rise buildings, shopping centers, and campus facilities utilize busbar riser systems distributing power vertically through building structures. Monitoring addresses tap-off connections at floor levels, main distribution boards, and generator tie-in points. Building management system (БМС) integration enables coordinated facility management, energy optimization, and preventive maintenance scheduling. Green building certifications increasingly require advanced monitoring supporting sustainability objectives.
9. What Return on Investment Can Be Expected? Экономический анализ

9.1 What Investment Components Comprise Total System Cost?
9.1.1 Hardware Capital Expenditure
System acquisition costs include temperature demodulators, sensor probes, оптоволоконные кабели, монтажное оборудование, и интерфейсы связи. Demodulator pricing scales with channel capacity, protocol support, and feature set. Sensor quantity determines overall material cost, with typical installations ranging from 16 к 64 measurement points depending on facility size and criticality.
9.1.2 Installation and Commissioning Expenses
Field installation labor includes sensor mounting, маршрутизация оптоволокна, demodulator installation, and system commissioning. Installation complexity varies with equipment accessibility, outage availability, и требования к интеграции. Straightforward installations on accessible outdoor busbars require minimal labor, пока GIS retrofits or confined space work increase installation effort. Commissioning activities encompass functional testing, настройка порога тревоги, communication verification, и обучение операторов.
9.1.3 Lifecycle Operating Costs
The maintenance-free design eliminates periodic calibration, замена датчика, and consumable expenses characteristic of alternative technologies. Annual operating costs include minimal electrical power consumption (обычно <100W per demodulator), software maintenance agreements (необязательный), and periodic functional verification. Total lifecycle cost analysis demonstrates significant advantage over systems requiring battery replacement, calibration services, or component refresh.
9.2 What Failure Costs Does Monitoring Prevent?
9.2.1 Equipment Replacement Expenses
Катастрофический busbar failures necessitate replacement of damaged conductors, изоляторы, вложения, и подключенное оборудование. Repair costs for ГИС-оборудование prove particularly substantial due to specialized components, Обработка газа SF6, and factory-trained service requirements. Transformer damage from busbar faults may require complete unit replacement. Early detection through temperature monitoring prevents progression from manageable maintenance issues to catastrophic failures requiring major equipment replacement.
9.2.2 Unplanned Outage Impact
Beyond direct repair costs, electrical failures cause business interruption losses varying by industry and facility criticality. Manufacturing plants experience production losses, raw material waste, and contract penalties. Data centers face service level agreement violations and customer attrition. Utilities incur energy not served penalties and regulatory scrutiny. Healthcare facilities encounter patient safety risks and operational disruptions. Прогностическое обслуживание enabled by continuous monitoring schedules repairs during planned outages, minimizing business impact.
9.2.3 Safety Incident Consequences
Electrical failures create arc flash, огонь, and explosion hazards threatening personnel safety. Workplace injuries trigger workers compensation claims, regulatory investigations, potential litigation, и репутационный ущерб. Proactive thermal management reduces accident risk, supporting corporate safety objectives and regulatory compliance. Insurance underwriters increasingly recognize advanced monitoring in premium calculations and coverage terms.
9.3 How Quickly Does Investment Return Through Operational Benefits?
9.3.1 Payback Period Calculation
Return on investment analysis compares system acquisition and installation costs against prevented failure expenses and operational improvements. Conservative analysis assumes prevention of one major failure over equipment service life justifies monitoring investment. Facilities with higher failure risk, critical operations, or expensive equipment achieve faster payback. Typical ROI periods range from 1-3 years depending on application specifics and risk exposure.
9.3.2 Увеличенный срок службы оборудования
Continuous thermal surveillance prevents cumulative damage from repeated overheating episodes, extending busbar system and connected equipment service life. Deferring capital replacement through optimized maintenance generates substantial value, particularly for expensive assets like transformers and распределительное устройство. Time value of money analysis demonstrates that extending equipment life by even modest percentages significantly improves lifecycle economics.
9.3.3 Optimized Maintenance Resource Allocation
Condition-based maintenance guided by temperature trending focuses resources on equipment actually requiring attention rather than time-based preventive maintenance schedules. This optimization reduces unnecessary inspections, extends maintenance intervals for healthy equipment, and improves workforce productivity. Maintenance cost savings accumulate annually throughout monitoring system operational life.
9.3.4 Insurance and Regulatory Benefits
Some insurance providers offer premium reductions for facilities implementing advanced monitoring and risk mitigation measures. Regulatory compliance for critical infrastructure, ядерные объекты, or hazardous processes may mandate online monitoring, making system investment necessary rather than optional. Documented condition monitoring supports regulatory inspections and demonstrates due diligence for safety management.
10. How to Select Reliable Busbar Monitoring System Suppliers?
10.1 What Supplier Qualifications Indicate Competence?
10.1.1 Quality Management System Certifications
ИСО 9001 quality management certification demonstrates established processes for design control, manufacturing quality, and continuous improvement. Suppliers maintaining certified quality systems implement documented procedures for component selection, производственное тестирование, калибровка, and traceability. Certification by accredited registrars provides independent verification of quality capabilities.
10.1.2 Product Type Testing and Compliance
Type test reports from accredited laboratories validate product performance against published specifications and relevant standards. Testing should encompass temperature accuracy, время ответа, environmental qualification, электромагнитная совместимость, and safety parameters. Compliance with CE marking requirements, RoHS hazardous substance restrictions, and regional electrical safety codes confirms product suitability for target markets.
10.1.3 Industry Experience and Reference Projects
Demonstrated experience in power utility, промышленный, or transportation sectors indicates understanding of application requirements and operating environments. Reference installations at comparable facilities provide validation of supplier capabilities and product performance. Customer testimonials, case studies, and site visit opportunities enable due diligence investigation before supplier selection.
10.2 How to Evaluate Product Quality and Reliability?
10.2.1 Technology Ownership and Innovation
Suppliers developing proprietary fluorescent sensing technology rather than reselling third-party products demonstrate technical depth and long-term commitment. Patents, технические публикации, and research partnerships indicate innovation capability. In-house engineering expertise supports customization, Поиск неисправностей, and continuous product improvement.
10.2.2 Component Selection and Manufacturing Standards
Quality suppliers specify components from reputable manufacturers with established reliability data. Critical items like photodetectors, optical components, and electronic assemblies should come from recognized brands with industrial-grade specifications. Manufacturing in controlled environments with documented procedures, automated testing, and statistical process control ensures consistent product quality.
10.2.3 Factory Testing and Quality Assurance
Comprehensive factory testing validates each production unit before shipment. Testing protocols should include temperature accuracy verification across operating range, communication interface validation, alarm functionality confirmation, и скрининг экологического стресса. Test documentation accompanying shipped equipment provides traceability and baseline performance data.
10.2.4 Warranty Terms and Technical Support
Warranty coverage duration, scope, and response commitments indicate supplier confidence in product reliability. Standard warranties spanning multiple years with comprehensive coverage demonstrate quality commitment. Technical support availability including application engineering, помощь в установке, and post-installation troubleshooting proves essential for successful project execution.
10.3 What Technical Support Capabilities Matter Most?
10.3.1 Pre-Sales Engineering Services
Competent suppliers provide application consultation, site surveys, measurement point selection guidance, and system design services before purchase commitments. Engineering support should address integration requirements, планирование установки, and performance prediction. Detailed proposals with equipment specifications, layout drawings, and implementation plans demonstrate supplier technical depth.
10.3.2 Installation and Commissioning Assistance
Field services including supervised installation, startup commissioning, and system optimization ensure proper deployment. Supplier technicians bring specialized knowledge of sensor mounting techniques, fiber routing best practices, и конфигурация системы. On-site training transfers knowledge to facility maintenance personnel for ongoing operation.
10.3.3 Ongoing Technical Support Infrastructure
Post-installation support through helpdesk services, удаленная диагностика, and emergency response maintains system reliability. Responsive technical support with knowledgeable staff resolves issues quickly, minimizing downtime. Global suppliers should provide regional support centers addressing time zone differences and language requirements.
10.4 Почему стоит выбрать Фучжоускую инновационную электронную науку&Компания Тех., ООО?
Фучжоу, инновационная электронная наука&Компания Тех., ООО. brings comprehensive expertise to контроль температуры шин приложения, combining technical innovation with proven field performance since establishment in 2011. The company maintains ISO quality certification, holds relevant product certifications including CE and RoHS compliance, and serves over 500 power utility customers across 30+ страны.
Core competencies include proprietary технология флуоресцентного оптоволокна, multi-channel demodulator platforms, and application-specific solutions for ГИС-оборудование, закрытые шины, and outdoor installations. Engineering capabilities support custom configurations, protocol development, and integration with diverse automation platforms. Manufacturing facilities employ rigorous quality control with comprehensive testing protocols.
Technical support infrastructure provides pre-sales consultation, detailed engineering design, шеф-монтаж, пуско-наладочные услуги, and ongoing maintenance assistance. Customer success focus ensures proper system specification, reliable implementation, and long-term operational satisfaction.
Часто задаваемые вопросы
1 квартал: What differentiates busbar monitoring from switchgear contact temperature monitoring?
Both applications utilize identical флуоресцентная волоконно-оптическая технология with distinctions primarily in installation locations and measurement point configurations. Switchgear monitoring emphasizes circuit breaker moving and stationary contacts plus cable terminal connections within individual cubicles. Busbar monitoring focuses on connection flanges, splice joints, точки отвода, and equipment interconnections across distribution systems. Optimal substation protection combines both approaches, creating comprehensive thermal surveillance networks addressing all critical current-carrying components.
2 квартал: Can monitoring systems be retrofitted to existing GIS equipment already in service?
Retrofit installations represent common deployment scenarios with proven methodologies minimizing operational disruption. No-outage installation techniques leverage scheduled maintenance windows, coordinated outages, or live-line working procedures to position датчики without extended service interruptions. Над 200 successful GIS retrofit projects demonstrate feasibility across diverse equipment manufacturers and vintages. Detailed planning, proper tooling, and experienced installation personnel ensure safe, efficient upgrades of operating equipment.
Q3: Does the system require periodic calibration like conventional temperature sensors?
No calibration necessary. Флуоресцентные оптоволоконные датчики employ fundamental physics-based measurement principles without drift phenomena affecting thermocouples, РДД, or thermistors. The temperature-fluorescence decay relationship remains constant over sensor lifetime, maintaining factory calibration accuracy for 25+ годы. This maintenance-free characteristic eliminates periodic calibration expenses, documentation requirements, and accuracy uncertainty between calibration intervals. Field experience validates long-term stability with sensors operating continuously for over a decade without measurable drift.
Q4: Can the system monitor transformers, реакторы, and other equipment beyond busbars?
Абсолютно. The versatile fluorescent fiber optic platform addresses diverse thermal monitoring applications throughout electrical infrastructure. Dry-type transformers benefit from winding hotspot measurement (12-24 point configurations). Oil-immersed transformers utilize fiber sensors for winding temperature, top oil measurement, and core monitoring. Shunt reactors, series reactors, and filter reactors incorporate thermal surveillance. Cable systems employ monitoring at splice joints, прекращение, and transitions. The technology’s electromagnetic immunity, high voltage tolerance, and intrinsic safety enable deployment across virtually all electrical equipment types requiring temperature assessment.
Q5: How can I obtain detailed technical documentation and project quotations?
Technical documentation, application guidelines, and project-specific proposals are available through direct consultation with our engineering team. Please provide the following information to facilitate accurate recommendations:
- Equipment types and models (GIS manufacturer, busbar specifications, класс напряжения)
- Voltage levels (35кВ, 110кВ, 220кВ, or other)
- Specific measurement locations and component identification
- Project location and implementation timeline
- Integration requirements (протоколы связи, existing automation systems)
- Any special environmental or operational considerations
Our team will respond with comprehensive technical proposals including measurement point recommendations, системная архитектура, equipment specifications, рекомендации по установке, and detailed commercial quotations tailored to your specific requirements.
Technical Documentation and Consultation

For comprehensive technical specifications, engineering design support, application consultation, or project quotations, пожалуйста, свяжитесь с нашей технической командой:
Фучжоу, инновационная электронная наука&Компания Тех., ООО.
Учредил: 2011
Электронная почта: web@fjinno.net
WhatsApp/WeChat/телефон: +86 13599070393
QQ: 3408968340
Адрес: Промышленный парк Liandong U Grain Networking,
№ 12 Синъе Вест Роуд, Фучжоу, Фуцзянь, Китай
Веб-сайт: www.fjinno.net
Our experienced engineering team provides comprehensive support throughout project lifecycle including:
- Pre-sales application consultation and site assessment
- Custom system design and measurement point optimization
- Detailed technical specifications and compliance documentation
- Installation planning and fiber routing design
- On-site commissioning and system optimization
- Operator training and maintenance procedures
- Ongoing technical support and troubleshooting assistance
- System expansion and upgrade planning
Available technical documentation includes:
- Product datasheets and specification sheets
- Installation manuals and mounting guidelines
- Communication protocol documentation
- Integration guides for automation platforms
- Application notes for specific equipment types
- Case studies and reference installations
- Test reports and certification documents
We welcome inquiries regarding busbar temperature monitoring solutions, custom configurations, international projects, and integration with existing substation infrastructure. Our global experience spans utility, промышленный, транспорт, and commercial applications across diverse operating environments and regulatory frameworks.
Отказ от ответственности
Техническая информация, технические характеристики, and application guidance presented in this article represent general characteristics of fluorescent fiber optic temperature monitoring systems for busbar applications. Фактическая производительность системы, configuration requirements, and operational results may vary based on specific installation conditions, факторы окружающей среды, типы оборудования, требования к интеграции, and operational practices.
В то время как Фучжоуская инновационная электронная наука&Компания Тех., ООО. strives to provide accurate and current information, we make no warranties, явный или подразумеваемый, относительно полноты, точность, надежность, or suitability of this content for any particular application or purpose. Характеристики продукта, функции, сертификаты, and availability are subject to change without prior notice as part of our continuous product development and improvement processes.
The case studies, примеры применения, and installation scenarios described are provided for illustrative purposes only and do not constitute performance guarantees for other installations or operating conditions. Customers should consult directly with our engineering team to confirm current specifications, obtain detailed technical data, and receive application-specific recommendations for their particular requirements.
Установка, операция, обслуживание, and modification of electrical monitoring equipment must be performed exclusively by qualified personnel following applicable safety regulations, электрические нормы и правила, industry standards, and manufacturer guidelines. Фучжоу, инновационная электронная наука&Компания Тех., ООО. assumes no liability for damages, травмы, потери, or consequences resulting from improper installation, misapplication, несоблюдение рекомендуемых практик, несанкционированные модификации, или использовать сверх опубликованных номиналов и характеристик.
Все экономические анализы, расчет рентабельности инвестиций, Представленное сравнение затрат представляет собой наглядные примеры, основанные на типичных сценариях и средних показателях по отрасли.. Фактические затраты, преимущества, сроки окупаемости, и финансовые результаты будут значительно различаться в зависимости от факторов, специфичных для учреждения., региональная экономика, эксплуатационная практика, частота отказов, и множество других переменных. Клиенты должны провести независимый финансовый анализ, соответствующий их конкретным обстоятельствам, прежде чем принимать инвестиционные решения..
Ссылки на сторонние продукты, системы, протоколы, стандарты, или организаций предоставлены только в информационных целях и не являются одобрением, partnerships, или принадлежности, если прямо не указано иное. All trademarks, product names, названия компаний, и упомянутые логотипы остаются собственностью их владельцев..
Эта статья не представляет собой профессиональную инженерную консультацию., and readers should consult with qualified electrical engineers, safety professionals, and regulatory authorities regarding specific project requirements, code compliance, and safety considerations. System design, выбор оборудования, and installation practices must consider site-specific conditions, applicable regulations, and professional engineering judgment.
Information regarding certifications, согласие, and regulatory approvals reflects status at time of publication. Customers requiring specific certifications for particular jurisdictions or applications should verify current certification status directly with our technical team and request relevant documentation.
For authoritative technical information, current product specifications, application-specific recommendations, and professional engineering support, please contact Fuzhou Innovation Electronic Scie&Компания Тех., ООО. directly through the communication channels provided in this article.

Оптоволоконный датчик температуры, Интеллектуальная система мониторинга, Распределенный производитель оптоволокна в Китае
 |
 |
 |