 Sensores de temperatura de fibra óptica INNO ,sistemas de monitoramento de temperatura.
- Aparelhagem isolada a gás (SIG) concentra componentes de alta tensão em selados, Compartimentos preenchidos com SF₆ onde mesmo um pequeno defeito de isolamento pode evoluir para uma falha catastrófica com tempos de reparo extremamente longos - tornando monitoramento aprimorado de descarga parcial essencial em vez de opcional.
- UHF (Frequência ultra-alta) detecção no 300 MHz–3 000 A banda MHz é o método preferido para GIS porque o invólucro metálico atua como um escudo eletromagnético natural, fornecendo relações sinal-ruído excepcionais que outras técnicas de detecção de PD não conseguem igualar neste ambiente.
- Um moderno sistema de monitoramento GIS PD com 5 sensibilidade do PC, 4–6 canais de aquisição, e 3Análise de padrão D PRPD pode identificar e classificar corona, superfície, vazio, e descarga de potencial flutuante – transformando sinais brutos em decisões de manutenção acionáveis.
- Sem costura Integração SCADA via IEC 61850, Modbus, e o DNP3 incorpora dados de integridade do isolamento GIS na camada de automação da subestação, permitindo a manutenção baseada em condições em escala de frota.
Índice
- Por que o GIS exige uma abordagem diferente para o monitoramento de descargas parciais
- Como ocorre a PD dentro de painéis isolados a gás – Mecanismos de falha
- Por que UHF é o método de detecção superior para descarga parcial GIS
- Arquitetura central de um sistema aprimorado de monitoramento GIS PD
- Especificações do sensor UHF que determinam o desempenho da detecção
- Host de aquisição multicanal – Parâmetros técnicos
- Análise de padrões PRPD – Identificando tipos de descarga em GIS
- Software de back-end e integração SCADA
- Considerações sobre instalação e implantação para ambientes GIS
- Como escolher um sistema de monitoramento GIS PD – Critérios de seleção
- Perguntas frequentes (Perguntas frequentes)
1. Por que GIS exige uma abordagem diferente para monitoramento de descargas parciais
O painel isolado a gás não é simplesmente um transformador ou cabo em um pacote diferente – ele apresenta um desafio de monitoramento fundamentalmente diferente. Todos os componentes ativos — barramentos, disjuntores, seccionadores, transformadores de corrente, e buchas - são encerrados em invólucros metálicos aterrados preenchidos com gás SF₆ pressurizado. Esta arquitetura selada elimina a inspeção visual, impede o acoplamento acústico direto a sensores externos, e faz IEC convencional 60270 medições elétricas de PD são impraticáveis em campo.
Ao mesmo tempo, as consequências de uma falha de isolamento não detectada no GIS são desproporcionalmente graves. Uma falha em um único compartimento pode exigir meses de reparo porque as peças de reposição são fabricadas sob medida e o manuseio do gás, desmontagem, e o processo de recomissionamento é complexo e demorado. Para GIS de tensão de transmissão operando em 110 kV, 220 kV, ou 500 kV, a interrupção resultante pode afetar a estabilidade da rede em toda uma região. Esta combinação de inspecionabilidade limitada e altas consequências de falhas é precisamente a razão pela qual monitoramento on-line aprimorado de descarga parcial tornou-se um requisito padrão para instalações GIS em todo o mundo.
2. Como ocorre a PD dentro de painéis isolados a gás – Mecanismos de falha
A descarga parcial dentro do GIS é impulsionada por concentrações localizadas de campo elétrico que excedem a rigidez dielétrica do gás SF₆ ou dos espaçadores isolantes sólidos. Quatro causas principais são responsáveis pela grande maioria dos eventos de PD GIS.
Partículas metálicas livres — pequenos fragmentos condutores deixados durante a fabricação ou gerados pelo desgaste mecânico dos contatos — são a causa mais comum de PD em GIS. Essas partículas podem migrar sob forças eletrostáticas, assentar em superfícies espaçadoras, ou ficar preso em regiões de alto campo, criando corona ou descarga superficial. Contaminação nas superfícies do espaçador, seja por umidade, pó, ou manusear resíduos, reduz a tensão de descarga superficial e inicia a descarga de rastreamento ao longo da interface sólido-gás. Vazios ou delaminação dentro dos espaçadores de resina fundida criam bolsas de gás onde a tensão de ruptura é menor que a do sólido circundante, levando a descargas internas repetitivas. Componentes metálicos flutuantes - escudos, eletrodos, ou parafusos que perderam sua conexão elétrica - adquirem um potencial indeterminado através do acoplamento capacitivo e acionam descargas de alta energia contra estruturas adjacentes aterradas ou energizadas.
Cada um desses mecanismos produz uma assinatura eletromagnética distinta que um sistema de monitoramento UHF adequadamente projetado pode detectar., classificar, e acompanhar ao longo do tempo.
3. Por que UHF é o método de detecção superior para descarga parcial GIS
Existem vários métodos de detecção de PD - elétricos (CEI 60270), emissão acústica, tensão transitória de terra (TEV), e UHF - mas a física da operação GIS favorece esmagadoramente o Abordagem UHF para monitoramento on-line permanente.
Quando ocorre um pulso de descarga parcial dentro de um compartimento GIS, ele irradia energia eletromagnética através de um amplo espectro de frequência. O invólucro metálico do GIS atua como um guia de ondas, permitindo sinais UHF no 300 MHz–3 000 MHz alcance para se propagar eficientemente ao longo do barramento com atenuação relativamente baixa. Crucialmente, o mesmo invólucro metálico protege os sensores UHF de interferência eletromagnética externa - transmissões de rádio, comutação de transientes, corona de linhas aéreas — isso sobrecarregaria os métodos de detecção de baixa frequência em um ambiente de subestação. Este efeito de blindagem natural dá à detecção UHF uma vantagem inerente de sinal-ruído que nenhum outro método pode replicar dentro do GIS.
Em comparação, Sensores TEV medem transientes de tensão na superfície externa do gabinete. Embora útil para verificações pontuais portáteis, TEV tem menor sensibilidade a defeitos internos, não é possível distinguir com segurança os tipos de DP, e é mais suscetível a ruídos externos. Os sensores acústicos lutam com os múltiplos reflexos e caminhos de atenuação dentro do volume de gás envolto em metal. A CEI 60270 método elétrico, embora altamente preciso em ambientes de laboratório, requer capacitores de acoplamento que são impraticáveis para adaptação em GIS operacional. Para contínuo, monitoramento instalado de GIS, UHF é a escolha técnica clara.
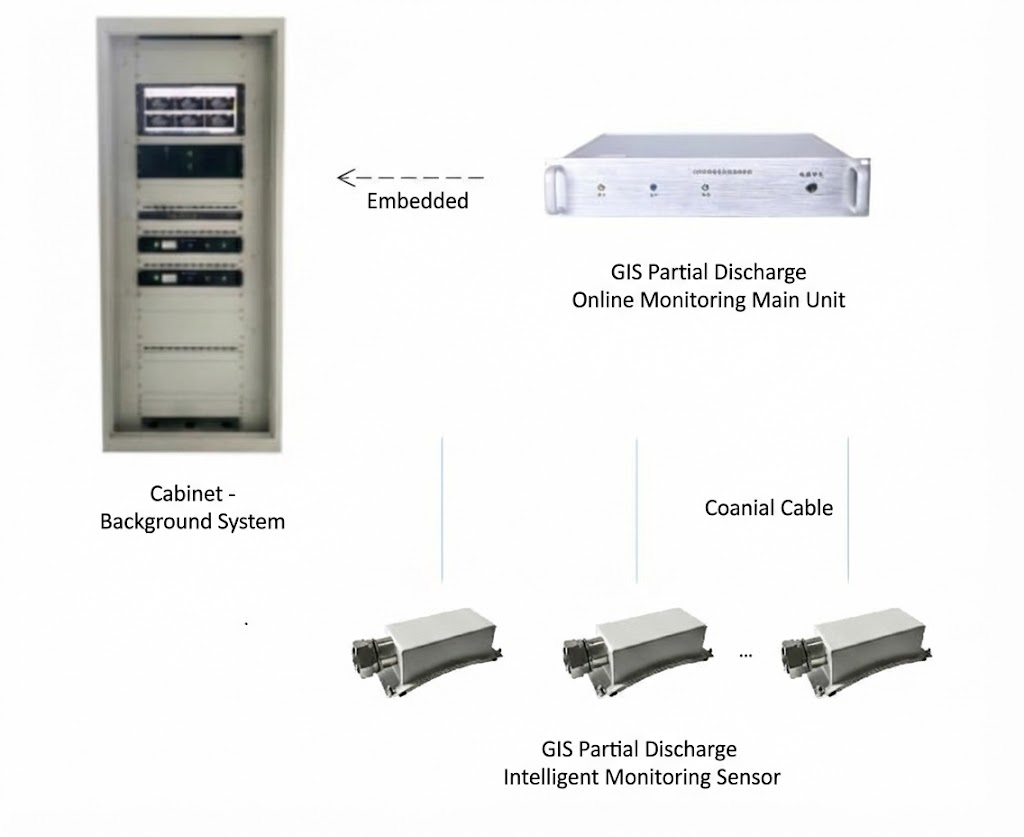
4. Arquitetura central de um sistema aprimorado de monitoramento GIS PD
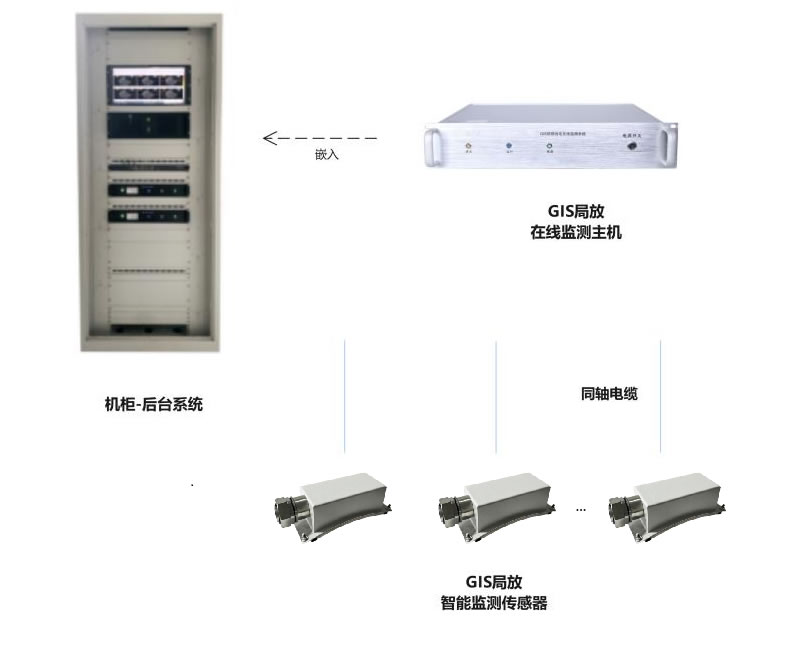
Uma instalação completa de monitoramento GIS PD compreende três camadas: sensores de campo, um host centralizado de aquisição e processamento, e software de diagnóstico de back-end. A arquitetura é projetada para que cada camada execute uma função específica e se comunique perfeitamente com a próxima..
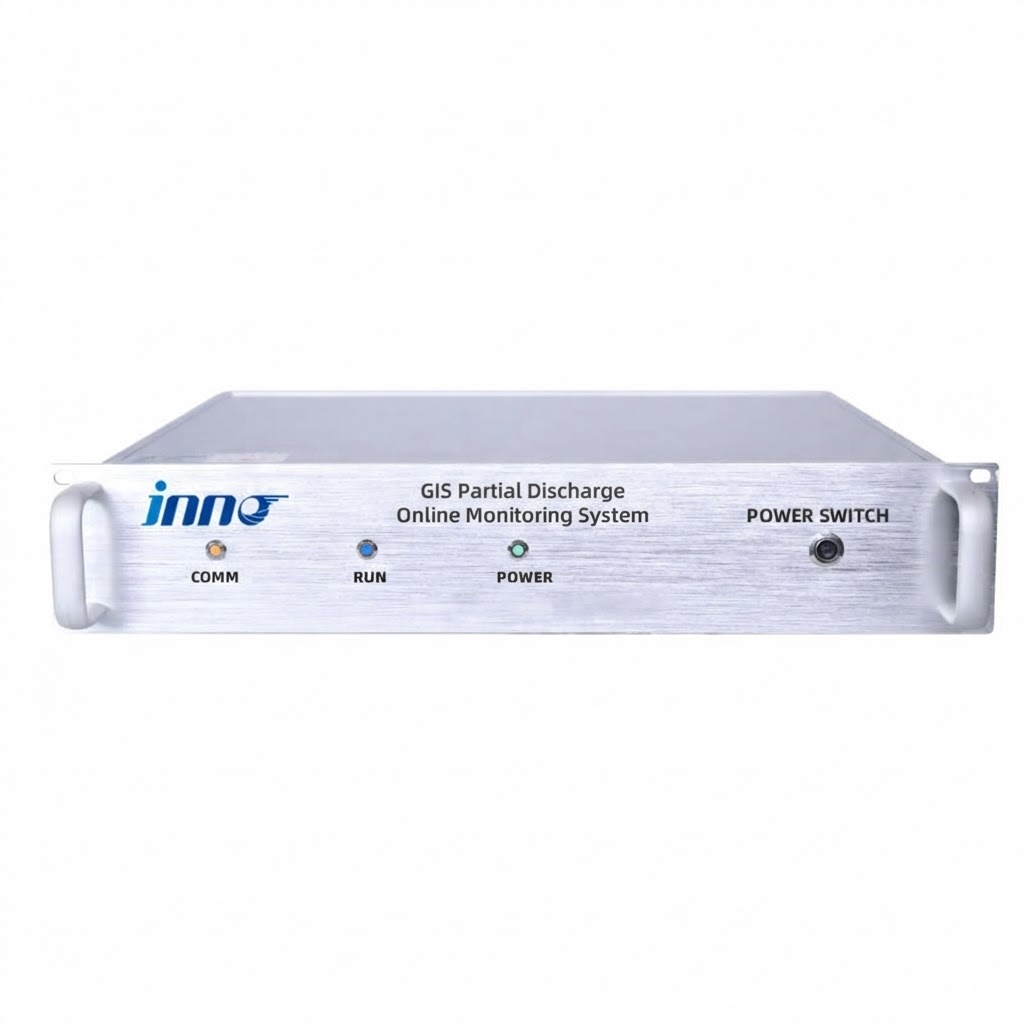
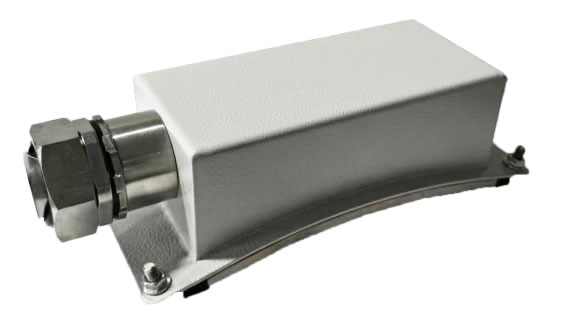
Sensores UHF são instalados em pontos estratégicos do GIS — normalmente em juntas espaçadoras, terminações de cabos, e interfaces de bucha onde a PD tem maior probabilidade de se originar. Cada sensor captura a radiação eletromagnética produzida por eventos de descarga e transmite o sinal via cabo coaxial para o host de monitoramento. O anfitrião de aquisição, alojado em um gabinete de montagem em rack 2U, recebe sinais de vários sensores simultaneamente, realiza digitalização em alta velocidade e condicionamento de sinal (demodulação, redução de ruído, amplificação), e calcula os principais parâmetros de PD, incluindo magnitude de descarga, ângulo de fase, e taxa de repetição. O host então transmite os dados processados pela Ethernet para o plataforma de software de back-end, que fornece visualização em tempo real, Análise de padrão PRPD, gerenciamento de alarme, tendências históricas, e integração com o sistema SCADA da subestação.
5. Especificações do sensor UHF que determinam o desempenho da detecção
O sensor é o primeiro e mais crítico elo da cadeia de detecção. Suas especificações determinam diretamente se o sistema pode detectar PD incipiente ou apenas falhas avançadas. A tabela abaixo detalha os principais parâmetros de um sensor UHF de alto desempenho projetado especificamente para aplicações GIS.
| Parâmetro | Especificação | Por que é importante |
|---|---|---|
| Faixa de frequência de monitoramento | 300 – 3 000 MHz | Cobre toda a faixa UHF onde os sinais GIS PD se propagam com mais eficiência dentro do invólucro metálico |
| Sensibilidade | 5 computador | Detecta descargas incipientes muito pequenas antes que elas atinjam níveis prejudiciais |
| Correspondência de Impedância | 50 Oh | A impedância de RF padrão garante transferência máxima de energia do sensor para o cabo coaxial com perda mínima de reflexão |
| ROE (Relação de onda estacionária de tensão) | ≤ 2 | A baixa taxa de onda estacionária confirma a transmissão eficiente do sinal; VSWR mais alto causa degradação do sinal e erro de medição |
| Diretividade | Omnidirecional | A sensibilidade igual em todas as direções elimina a necessidade de alinhamento angular preciso durante a instalação |
| Interface de saída | Conector RF tipo N | O conector padrão da indústria fornece confiabilidade, conexões repetíveis com baixa resistência de contato |
| Comprimento do cabo coaxial | Padrão 10 eu (personalizável) | Acomoda distâncias típicas entre o GIS e o gabinete de monitoramento; comprimentos personalizados disponíveis para grandes instalações |
| Temperatura operacional | -40 °C a +85 °C | Suporta implantação em climas extremos — desde subestações árticas até ambientes desérticos que excedem 50 °C |
| Tolerância à umidade | ≤ 95 % RH | Classificado para locais tropicais e costeiros com alta umidade persistente |
A combinação de 5 sensibilidade pC e um VSWR de ≤ 2 é particularmente importante. A sensibilidade determina a menor descarga que o sistema pode detectar; O VSWR determina quanto desse sinal realmente chega ao host de aquisição sem ser refletido de volta ao longo do cabo. Um sistema com alta sensibilidade declarada, mas VSWR ruim perderá uma fração significativa do sinal detectado em trânsito, negando efetivamente sua vantagem de sensibilidade.
6. Host de aquisição multicanal – Parâmetros técnicos
O host de aquisição é o núcleo de processamento do sistema, responsável pela digitalização, condicionamento, e analisando sinais de todos os sensores conectados. A tabela abaixo apresenta as principais especificações da unidade host de monitoramento.
| Parâmetro | Especificação |
|---|---|
| Frequência de monitoramento | 300 – 3 000 MHz |
| Número de canais | 4 ou 6 (selecionável) |
| Interfaces de comunicação | Ethernet RJ45 + RS-485 |
| Protocolos Suportados | Modbus RTU / TCP, CEI 61850, DNP3 |
| Fonte de energia | AC 90 – 240 V, 50/60 Hz |
| Gabinete | 2Montagem em rack U (483 milímetros × 89 milímetros × 300 milímetros) |
| Classificação de proteção do gabinete | IP54 |
| Processamento de Sinal | Demodulação, isolamento, redução de ruído, amplificação, aquisição de alta velocidade, medição periódica multiciclo |
| Saídas de diagnóstico | Magnitude máxima de descarga, magnitude média de descarga, frequência de descarga, 3Padrões PRPD, estatísticas de tendência |
A escolha entre 4 e 6 canais depende da configuração do GIS. Um GIS de compartimento único com três compartimentos pode ser totalmente coberto por um host de 4 canais, enquanto seções de barramento estendidas ou arranjos de barramento duplo se beneficiam da capacidade adicional de uma unidade de 6 canais. A arquitetura de canal modular também significa que o sistema pode ser implantado inicialmente com menos sensores e expandido posteriormente sem substituir o hardware host.
7. Análise de padrões PRPD – Identificando tipos de descarga em GIS

Detectar que uma descarga parcial está ocorrendo é apenas o primeiro passo. O verdadeiro valor diagnóstico reside na identificação que tipo de descarga é, porque cada tipo implica um mecanismo de defeito diferente, uma trajetória de gravidade diferente, e uma resposta de manutenção diferente.
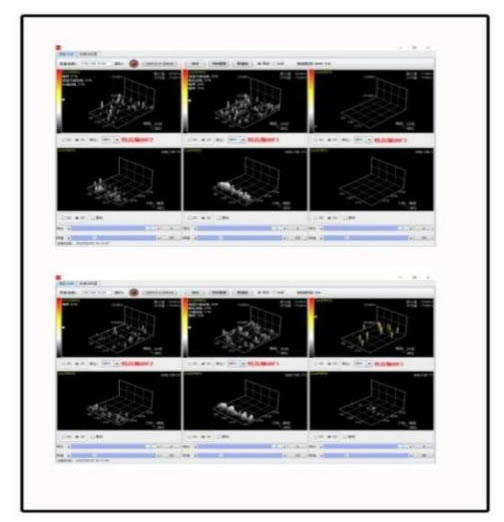
Descarga parcial resolvida por fase (PRPD) a análise consegue isso mapeando cada pulso PD detectado em um sistema de coordenadas tridimensional: magnitude de descarga no eixo vertical, ângulo de fase do ciclo de frequência de potência no eixo horizontal, e densidade de pulso representada por cor ou altura. Ao longo de centenas de ciclos de energia, cada tipo de descarga constrói um padrão característico.
Corona de partículas livres normalmente se concentra perto dos picos de tensão de uma polaridade, com magnitude relativamente baixa e uniforme. Descarga superficial em espaçadores produz padrões assimétricos que se espalham por uma ampla faixa de fase, com magnitude aumentando à medida que a contaminação piora. Descarga de vazio interno dentro do material espaçador gera padrões simétricos em ambos os semiciclos, com magnitude relativamente estável que muda pouco com a tensão aplicada. Descarga de potencial flutuante cria denso, aglomerados de alta magnitude que mudam de posição de fase conforme o acoplamento capacitivo do componente flutuante muda com a carga ou temperatura.
O software de monitoramento compara padrões PRPD medidos com um banco de dados especializado de assinaturas de descargas GIS conhecidas. Quando uma correspondência é encontrada, o sistema informa o tipo provável de descarga e a ação recomendada - por exemplo, “partícula metálica livre detectada no compartimento B3; recomendar inspeção na próxima interrupção planejada” — transformar uma medição eletromagnética complexa em uma instrução de manutenção clara.
8. Software de back-end e integração SCADA
A plataforma de software back-end é executada no computador da sala de controle da subestação ou em um servidor centralizado para implantações em vários locais. Ele fornece quatro recursos principais: monitoramento em tempo real com visualização 3D PRPD, consulta de dados históricos e análise de tendências, gerenciamento de alarmes multinível com limites configuráveis, e geração automatizada de relatórios para planejamento de manutenção e conformidade regulatória.
Para integração na camada de automação da subestação, o host de monitoramento suporta CEI 61850, Modbus RTU/TCP, e DNP3 nativamente — nenhum conversor de protocolo externo é necessário. Principais pontos de dados — magnitude PD em tempo real, sinalizadores de status de alarme, e códigos de classificação de diagnóstico — são transmitidos ao sistema SCADA, dando aos despachantes visibilidade imediata da integridade do isolamento GIS juntamente com medições convencionais, como tensão do barramento, corrente de carga, e pressão do gás SF₆. Essa integração permite manutenção baseada em condições em escala de frota: em vez de inspecionar todos os compartimentos GIS em um calendário fixo, as equipes de manutenção são direcionadas para os compartimentos específicos onde o sistema de monitoramento identificou PD ativo ou em desenvolvimento.
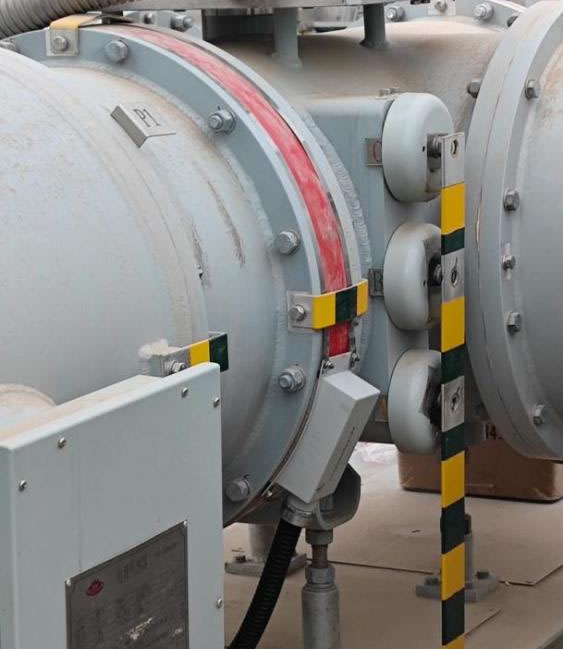
9. Considerações sobre instalação e implantação para ambientes GIS
Os sistemas de monitoramento GIS PD são projetados para instalação de retroajuste em equipamentos operacionais sem necessidade de interrupção do GIS. Os sensores UHF são montados em pontos de acesso designados no gabinete GIS — normalmente em flanges espaçadores, escotilhas de inspeção, ou portas de sensores dedicadas fornecidas pelo fabricante do GIS. Os cabos coaxiais passam dos sensores até o gabinete de monitoramento, que pode ser um gabinete independente com classificação IP54 ou um painel dentro da sala de relés existente.
Várias práticas de instalação são críticas para um desempenho confiável. Os cabos coaxiais devem manter seu raio de curvatura mínimo para evitar descontinuidades de impedância que degradam a qualidade do sinal. As rotas dos cabos devem evitar correr paralelamente a barramentos de alta tensão ou cabos de energia para minimizar o acoplamento eletromagnético. Todas as conexões de aterramento do equipamento devem ser verificadas, como um terreno ruim pode introduzir ruído que imita os sinais PD. Após a instalação física, uma medição de linha de base deve ser registrada com o GIS em serviço normal — esta linha de base se torna a referência com a qual todas as medições futuras serão comparadas.
Uma instalação típica cobrindo um único compartimento GIS com 3 a 4 sensores, um host de aquisição, e o software back-end pode ser concluído em uma a duas semanas, incluindo o comissionamento, calibração, e treinamento de operadores.
10. Como escolher um sistema de monitoramento GIS PD – Critérios de seleção
O mercado inclui produtos que vão desde instrumentos portáteis de verificação pontual até plataformas completas de monitoramento contínuo. Os critérios a seguir ajudam os compradores a encontrar a solução certa para seu ativo GIS específico.
Sensibilidade e VSWR
Especifique uma sensibilidade do sensor de 5 pC ou melhor e um VSWR ≤ 2. Esses dois parâmetros juntos determinam a capacidade de detecção no mundo real. Um sensor com excelente sensibilidade declarada, mas um VSWR de 3 ou superior perde uma parte substancial do sinal antes de atingir o host de aquisição.
Cobertura de frequência
Os 300–3 completos 000 A banda UHF de MHz deve ser coberta. Alguns sistemas de baixo custo operam apenas em uma sub-banda estreita, que pode perder assinaturas PD que se manifestam em frequências fora dessa janela.
Contagem de canais e capacidade de expansão
Escolha um sistema com selecionável 4- ou capacidade de 6 canais e uma arquitetura modular que permite adicionar sensores e canais sem substituir a unidade host. Isto protege o investimento inicial à medida que a instalação do GIS cresce.
Inteligência Diagnóstica
O sistema deve oferecer exibição de padrões PRPD 3D com correspondência automatizada de padrões em um banco de dados especializado. Sistemas que relatam apenas a amplitude bruta do sinal sem classificação do tipo de descarga fornecem detecção, mas não diagnóstico – e o diagnóstico é o que orienta decisões de manutenção eficazes.
Compatibilidade de protocolo
Suporte nativo ao protocolo de comunicação já implantado na subestação — IEC 61850, Modbus RTU/TCP, ou DNP3 — evita o risco de custo e confiabilidade de adicionar conversores externos.
Classificação Ambiental
Os sensores devem ser classificados para toda a faixa de temperatura e umidade do local. Para subestações GIS externas em climas extremos, verifique a operação do sensor de -40 °C a +85 °C e proteção do gabinete de pelo menos IP54.
Histórico do fornecedor
Solicite instalações de referência em configurações GIS e classes de tensão comparáveis. Um fornecedor com uma base instalada comprovada em 110 kV, 220 kV, e 500 kV GIS proporciona maior confiança na confiabilidade do sistema e capacidade de suporte técnico.
11. Perguntas frequentes (Perguntas frequentes)
1º trimestre: O que torna a detecção UHF melhor que TEV para monitoramento de descarga parcial GIS?
A detecção UHF opera na faixa 300–3 000 Alcance de MHz e captura ondas eletromagnéticas que se propagam dentro do gabinete GIS selado, que atua como um escudo natural contra ruídos externos. Isso dá ao UHF uma relação sinal-ruído superior em comparação ao TEV, que mede pulsos de tensão transitórios na superfície externa do gabinete e está mais exposto à interferência eletromagnética ambiental. UHF também oferece maior sensibilidade a defeitos internos e melhor capacidade de classificação do tipo de descarga por meio de análise de padrão PRPD. TEV continua útil como ferramenta de triagem portátil, mas para monitoramento online permanente de GIS, UHF é a escolha tecnicamente superior.
2º trimestre: Quantos sensores UHF são necessários por compartimento GIS?
A prática recomendada é um sensor por compartimento GIS para uma cobertura abrangente. Para um arranjo típico de compartimento único, isso significa 3 a 4 sensores cobrindo os compartimentos do barramento e a terminação dos cabos. Baias críticas ou baias com histórico de problemas de isolamento podem exigir sensores adicionais em pontos fracos conhecidos, como juntas espaçadoras e interfaces de buchas. UM 4- ou host de aquisição de 6 canais acomoda essas configurações sem dificuldade.
3º trimestre: O sistema pode distinguir entre tipos de PD dentro do GIS??
Sim. O sistema usa análise de padrão PRPD 3D para classificar eventos de descarga em quatro categorias: descarga corona de partículas metálicas livres, descarga superficial em espaçadores contaminados, descarga de vazio interno dentro de isolamento sólido, e descarga potencial flutuante de peças metálicas não aterradas. Cada tipo produz um padrão característico de magnitude de fase que o software compara com um banco de dados especializado para identificação automatizada.
4º trimestre: A instalação requer uma interrupção do GIS?
Não. Os sensores UHF são montados em pontos de acesso externos no gabinete GIS — flanges espaçadores, portos de inspeção, ou janelas de sensores dedicadas — sem abrir nenhum compartimento de gás. Os cabos coaxiais são direcionados para o gabinete de monitoramento, que é instalado em uma sala de relés próxima ou em um gabinete independente. Toda a instalação, incluindo comissionamento e medição de linha de base, é realizado com o GIS energizado e em serviço normal.
Q5: Como o sistema lida com alarmes falsos em subestações com ruído elétrico?
O invólucro metálico GIS fornece blindagem eletromagnética natural que rejeita inerentemente a maioria das interferências externas na banda UHF. Além desta vantagem física, o host de aquisição aplica filtragem no domínio da frequência, gate no domínio do tempo, e algoritmos de reconhecimento de padrões para distinguir pulsos PD genuínos de distúrbios transitórios. Limites de alarme ajustáveis podem ser ajustados ao nível de ruído de fundo específico do local durante o comissionamento. Essas medidas combinadas normalmente alcançam uma precisão de detecção de DP acima 95 % com taxas de falsos alarmes abaixo 2 %.
Q6: Quais protocolos SCADA o sistema suporta?
O host de monitoramento fornece interfaces Ethernet RJ45 e RS-485 com suporte nativo para Modbus RTU, Modbus TCP, CEI 61850, e DNP3. Isso abrange praticamente todas as arquiteturas de automação de subestações em uso atualmente e garante que os dados PD — incluindo a magnitude da descarga em tempo real, status de alarme, e códigos de diagnóstico — podem ser transmitidos diretamente para a estação mestre SCADA sem conversores de protocolo externos.
Q7: Qual é o retorno esperado do investimento?
Uma única falha evitada no compartimento GIS – que pode custar vários milhões de dólares na substituição de equipamentos, reparo de emergência, e perda de receita devido a interrupções prolongadas — normalmente justifica todo o investimento no sistema de monitoramento. Fontes adicionais de ROI incluem custos de manutenção reduzidos através da mudança da inspeção baseada no tempo para a inspeção baseada na condição, vida útil prolongada do GIS através de intervenção precoce, e prêmios de seguro reduzidos. A maioria das instalações atinge o ROI total dentro de dois a três anos.
P8: O sistema pode ser expandido após a instalação inicial?
Sim. A arquitetura modular permite que sensores adicionais sejam adicionados a novos compartimentos GIS e conectados a canais sobressalentes no host de aquisição existente. Se todos os canais estiverem ocupados, uma unidade host adicional pode ser instalada e conectada à mesma plataforma de software backend. Vários compartimentos GIS, ou mesmo múltiplas subestações, pode ser monitorado a partir de uma única interface de software centralizada, fornecendo visibilidade em toda a frota da saúde do isolamento GIS.
Isenção de responsabilidade: As informações fornecidas neste artigo são apenas para fins educacionais gerais e de referência. FJINNO (www.fjinno.net) não oferece garantias, expresso ou implícito, em relação à completude, precisão, ou aplicabilidade do conteúdo a qualquer projeto ou instalação específica. As especificações técnicas aqui mencionadas representam valores típicos e podem variar dependendo do tipo de GIS, colocação do sensor, e ambiente do local. As decisões de engenharia devem sempre ser baseadas em avaliações específicas do local, realizadas por profissionais qualificados, de acordo com as normas aplicáveis, incluindo IEC 62478, CEI 61850, e códigos de rede locais. Nomes de produtos de fabricantes terceiros são marcas registradas de seus respectivos proprietários e são mencionados apenas para referência informativa. A FJINNO não será responsável por qualquer perda ou dano decorrente do uso ou confiança nesta informação.

Sensor de temperatura de fibra óptica, Sistema de monitoramento inteligente, Fabricante distribuído de fibra óptica na China
 |
 |
 |