 Światłowodowe czujniki temperatury INNO ,systemy monitorowania temperatury.
Podstawy monitorowania temperatury połączeń szyn zbiorczych

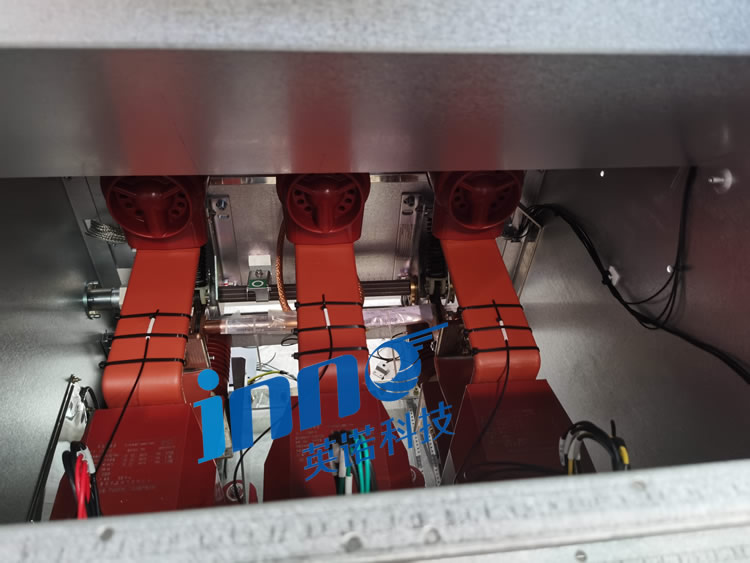
- Krytyczne wyzwanie: Przyczyny przegrzania złącza szyn zbiorczych 40% awarii podstacji; tradycyjna termografia w podczerwieni nie jest w stanie przeniknąć przez metalowe obudowy GIS ani wykryć wewnętrznych punktów gorących w zamkniętych szynach zbiorczych
- Rozwiązanie technologiczne: Fluorescencyjny punktowy czujnik światłowodowy zapewnia dokładność ±1°C w zakresie od -40°C do 260°C przy <1 drugi czas reakcji dla bezpośredniego pomiaru kontaktowego
- Nieodłączne bezpieczeństwo: Konstrukcja całkowicie dielektryczna, bez elementów metalowych, wytrzymać napięcie >100kv, całkowita odporność elektromagnetyczna w środowiskach wysokiego napięcia
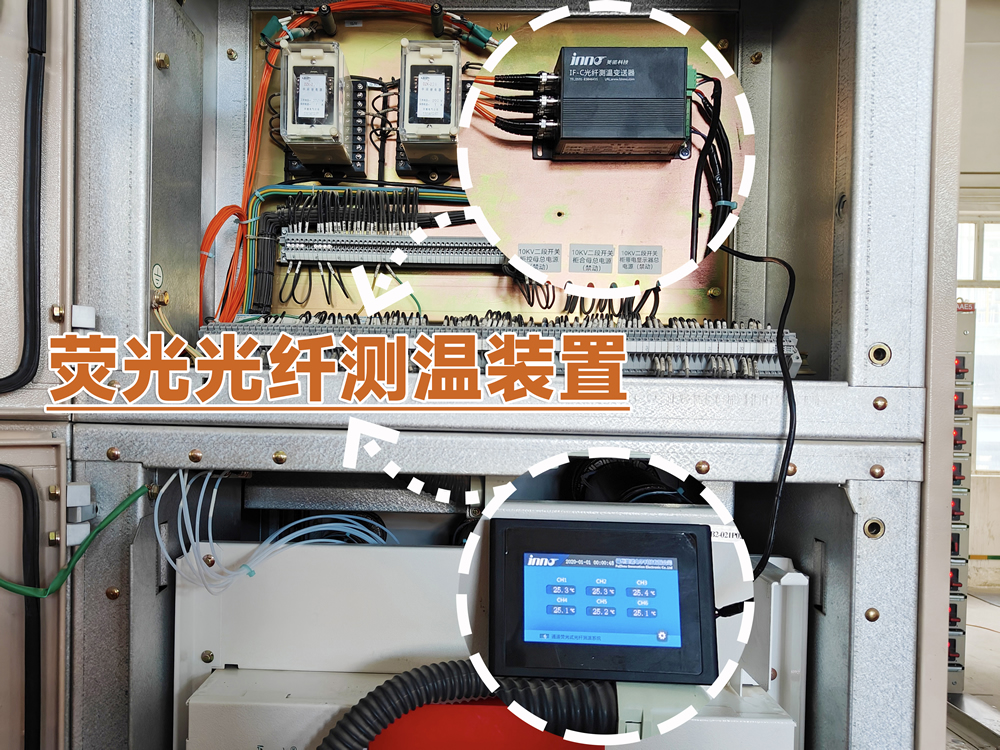
- Pojemność systemu: Monitory z pojedynczym demodulatorem 4-64 kanały jednocześnie; długość światłowodu 0-80m na kanał; wymaga typowa podstacja 220 kV 16-32 punkty pomiarowe
- Inteligentne alarmowanie: Progi wielopoziomowe, w tym temperatura bezwzględna, tempo wzrostu (°C/min), wykrywanie nierównowagi faz, i analizę porównawczą podobnego sprzętu
- Integracja podstacji: RS485 Modbus RTU, IEC 60870-5-101/104, IEC 61850 Protokoły MMS zapewniające bezproblemową łączność z platformami SCADA i automatyzacją
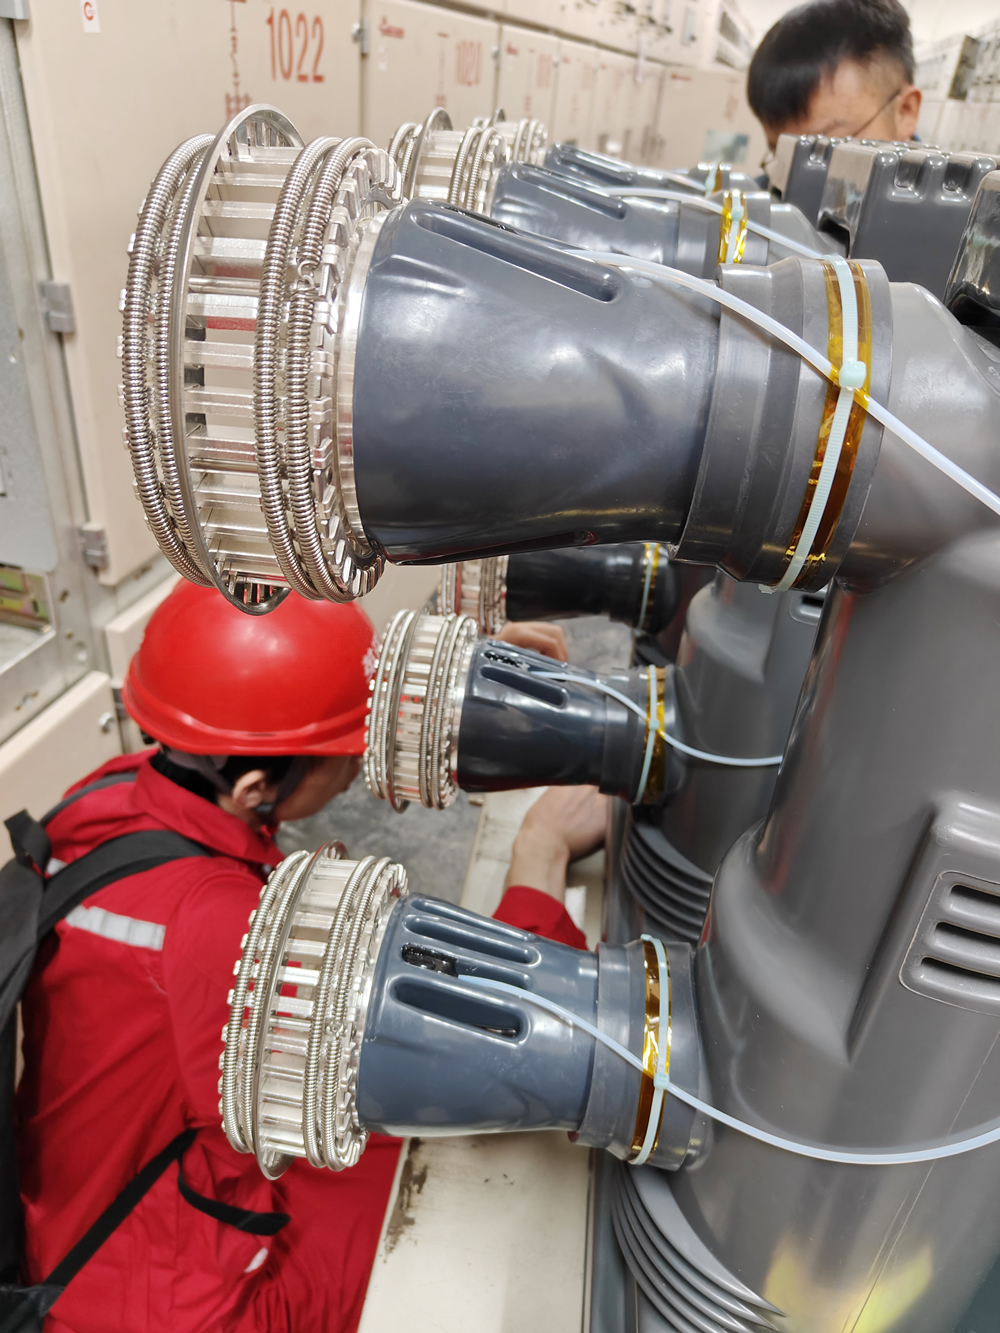
- Portfolio aplikacji: 220Instalacje GIS kV/110kV, zamknięte systemy kanałów szynowych, zewnętrzne sztywne mosty autobusowe, złącza przejściowe miedź-aluminium, podstacje trakcyjne, dystrybucja zasilania centrum danych
- Trwałość operacyjna: Żywotność czujnika przekracza 25 lata, bezobsługowa praca, nie wymaga kalibracji, Stopień ochrony IP67, odporność sejsmiczna do intensywności 8 stopni
- Uzasadnienie ekonomiczne: Awaria pojedynczej szyny zbiorczej powoduje uszkodzenie sprzętu i straty wynikające z przestoju; wdrożenie systemu zapobiega katastrofalnym awariom i wydłuża żywotność zasobów
- Zapewnienie jakości: ISO 9001 certyfikowana produkcja, Zgodność z CE/RoHS, certyfikaty badań typu, 500+ instalacje energetyczne, eksport do 30+ kraje
1. Dlaczego połączenia szyn zbiorczych mają tendencję do przegrzewania się? Wyjaśnienie mechanizmów awarii krytycznych
1.1 Co powoduje zwiększoną rezystancję styku w złączach szyn zbiorczych?
Degradacja połączeń szyn zbiorczych wynika z wielu jednoczesnych mechanizmów wpływających na obciążalność prądową. Połączenia śrubowe doświadczają relaksacji momentu obrotowego w cyklach operacyjnych z powodu rozszerzalności cieplnej, wibracje wywołane siłami elektromagnetycznymi, i mechaniczne osadzanie powierzchni stykowych. W miarę zmniejszania się nacisku mocowania, Na styku powstają mikroskopijne szczeliny powietrzne, koncentrując przepływ prądu przez zmniejszoną efektywną powierzchnię styku.
Utlenianie powierzchniowe stanowi kolejny krytyczny tryb awarii. Tlen atmosferyczny reaguje z przewodnikami miedzianymi lub aluminiowymi, tworząc warstwy tlenkowe o znacznie wyższym oporze elektrycznym niż metale nieszlachetne. Te warstwy izolacyjne zwiększają się rezystancja złącza, generowanie lokalnego ogrzewania Joule'a proporcjonalnie do strat I²R. Ogrzewanie przyspiesza utlenianie w destrukcyjnym cyklu dodatniego sprzężenia zwrotnego.
1.1.1 Korozja galwaniczna złącza przejściowego miedź-aluminium
Połączenia przejściowe miedź-aluminium stwarzają szczególne wyzwania ze względu na różne reakcje elektrochemiczne metali. Gdy wilgoć przedostanie się do połączeń, pomiędzy metalami tworzą się ogniwa galwaniczne, powodując preferencyjną korozję aluminium. Produkty korozji gromadzą się na stykach, drastycznie zwiększając rezystancję styku. Dane branżowe wskazują, że złącza przejściowe wykazują częstość awaryjności 3-5 razy wyższe niż w przypadku jednorodnych połączeń metalowych bez odpowiedniego zabezpieczenia.
1.1.2 Wpływ cykli termicznych na integralność połączenia
Różnicowe współczynniki rozszerzalności cieplnej pomiędzy przewody szynowe, elementy złączne, i podkładki powodują naprężenia mechaniczne podczas cyklicznych zmian obciążenia. Dzienne i sezonowe wahania temperatury powodują mikroskopijne ruchy na stykach, noszenie powłok ochronnych i sprzyjanie korozji ciernej. Przez lata służby, te skumulowane efekty pogarszają wydajność elektryczną i mechaniczną.
1.2 Jakie konsekwencje wynikają z przegrzania złącza szyn zbiorczych?
1.2.1 Drogi degradacji systemu izolacyjnego
Podwyższone temperatury przyspieszają rozkład chemiczny otaczających polimerowych materiałów izolacyjnych połączenia szyn zbiorczych. Żywice epoksydowe, gumki silikonowe, i rurki termokurczliwe tracą wytrzymałość dielektryczną pod wpływem długotrwałych temperatur przekraczających wartości znamionowe projektowe. Starzenie termiczne zmniejsza napięcie przebicia, zwiększa tangens strat dielektrycznych, i sprzyja tworzeniu się śladów na zanieczyszczonych powierzchniach.
W Sprzęt GIS, przegrzanie powoduje rozkład gazu SF6, wytwarzające żrące i toksyczne produkty uboczne, w tym fluorki siarki i fluorki metali. Związki te atakują elementy aluminiowe i niszczą powierzchnie izolatorów, naruszyć zarówno izolację elektryczną, jak i integralność mechaniczną. Analiza gazu ujawniająca podwyższone stężenia produktów rozkładu służy jako wczesny wskaźnik ostrzegawczy stresu termicznego.
1.2.2 Katastrofalny postęp awarii
Niepowstrzymany przegrzanie szyn zbiorczych podąża przewidywalnymi ścieżkami eskalacji. Początkowy wzrost temperatury zwiększa rezystancję styku, co powoduje dodatkowe ogrzewanie w przyspieszającym niszczeniu. Gdy temperatura złącza przekracza temperaturę topnienia przewodu (1085°C dla miedzi, 660°C dla aluminium), następuje stopienie lub odparowanie metalu. Krople stopionego metalu mogą mostkować odstępy fazowe, inicjowanie zwarć międzyfazowych lub międzyfazowych.
Udokumentowane studium przypadku: W podstacji 220 kV doszło do awarii połączenia śrubowego szyn zbiorczych, co spowodowało zwarcie jednej fazy z ziemią, Uwolnienie gazu SF6, i uszkodzenia sprzętu. Analiza po zdarzeniu wykazała, że uszkodzone połączenie działało w temperaturze 150°C powyżej temperatury otoczenia przez około sześć miesięcy, zanim doszło do katastrofalnej awarii. Straty całkowite łącznie z wymianą sprzętu, przestój systemu, i reagowania w sytuacjach nadzwyczajnych przekroczyła znaczne kwoty, wykazując krytyczne znaczenie ciągłego monitoring termiczny.
1.3 Dlaczego tradycyjne metody inspekcji nie mogą wykryć problemów ze złączami szyn zbiorczych??
1.3.1 Podstawowe ograniczenia termowizji w podczerwieni
Obrazowanie termowizyjne w podczerwieni umożliwia bezdotykową ocenę temperatury poprzez detekcję energii promieniowanej w widmie podczerwieni. Jednak, technika ta napotyka przeszkody nie do pokonania we współczesnym świecie Instalacje GIS gdzie krytyczne połączenia znajdują się w uziemionych metalowych obudowach. Promieniowanie podczerwone nie może przenikać przez bariery metalowe, ograniczanie pomiarów do zewnętrznych powierzchni szafy, które wykazują minimalną korelację temperatury z wewnętrznymi gorącymi punktami.
Nawet za przystępną szynoprzewód zewnętrzny instalacje, Dokładność podczerwieni zależy od wiedzy o emisyjności powierzchni, właściwy kąt pomiaru, kompensacja odbitego promieniowania tła, i korekta absorpcji atmosferycznej. Namalowany, utleniony, lub zanieczyszczone powierzchnie wykazują zmienną emisyjność, wprowadzenie istotnej niepewności pomiaru. Efekty chłodzenia wiatrem dodatkowo zniekształcają odczyty temperatury zewnętrznej, potencjalnie maskując niebezpieczne warunki wewnętrzne.
1.3.2 Nieodpowiedni cykl kontroli ręcznej
Konwencjonalne harmonogramy konserwacji określają okresy miesięczne lub kwartalne badania w podczerwieni, tworzenie dłuższych okresów bez nadzoru. Szybki postęp awarii pomiędzy przeglądami uniemożliwia interwencję w odpowiednim czasie. Dane termograficzne reprezentują natychmiastowe migawki bez możliwości ciągłego tworzenia trendów w celu identyfikacji wzorców stopniowej degradacji. Inspektorzy nie mają dostępu do wnętrz urządzeń pod napięciem, pozostawiając krytyczny Szyna zbiorcza GIL połączenia i zamknięty kanał szynowy elementy wewnętrzne całkowicie niemonitorowane.
1.3.3 Zagrożenia bezpieczeństwa związane z oceną ręczną
Inspektorzy pracujący w pobliżu napięcia sprzęt wysokiego napięcia narażać się na zagrożenia elektryczne, w tym łuk elektryczny, porażenie prądem, i ryzyko obrażeń spowodowanych wybuchem. Wspinaczka po konstrukcjach mierzących podwyższone szyny stwarza ryzyko upadku. Zautomatyzowane monitorowanie temperatury w Internecie eliminuje narażenie personelu, zapewniając jednocześnie najwyższą jakość danych i rozdzielczość czasową.
2. Jak Fluorescencyjne czujniki światłowodowe rozwiązują monitorowanie szyn zbiorczychg Wyzwania?
2.1 Jakie zasady działania rządzą Fluorescencyjny pomiar temperatury?
2.1.1 Zależność temperatury fluorescencji pierwiastków ziem rzadkich
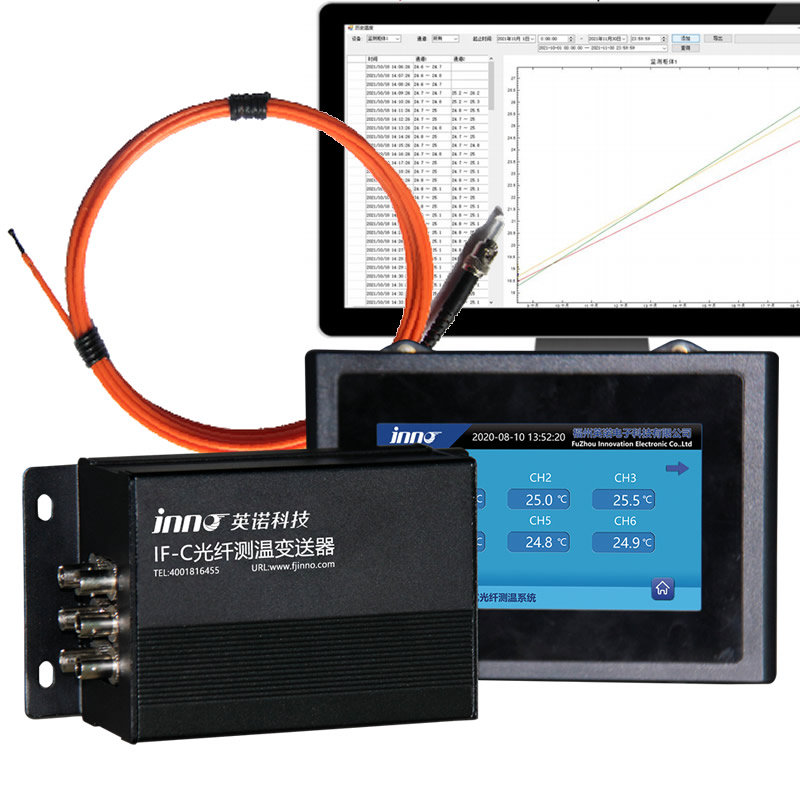
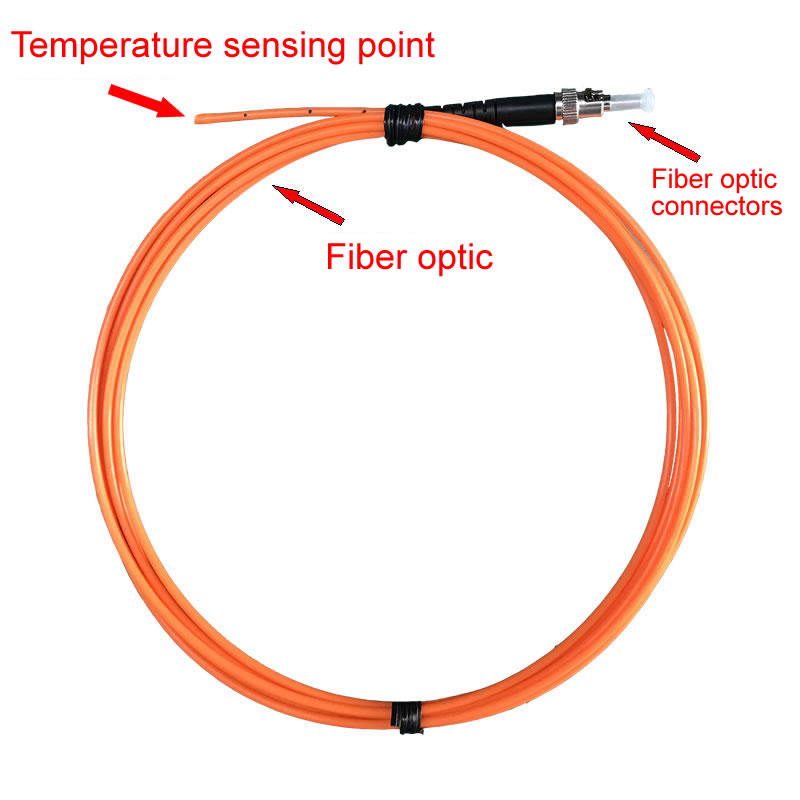
Ten fluorescencyjny czujnik światłowodowy wykorzystuje wrażliwe na temperaturę właściwości zaniku fluorescencji materiałów z luminoforu ziem rzadkich. Po wzbudzeniu impulsami świetlnymi o określonej długości fali (zazwyczaj niebieski lub UV), domieszkowane kryształy emitują fluorescencję o dłuższej długości fali. Czasowy zanik tej emisji fluorescencji wykazuje precyzyjną wykładniczą zależność od temperatury bezwzględnej, zgodnie z zasadami mechaniki kwantowej.
na sonda czujnika wskazówka, Światło wzbudzające dostarczane przez światłowód stymuluje materiał fluorescencyjny. Emitowana fluorescencja powraca przez to samo włókno do a demodulator temperatury zawierające fotodetektory i elektronikę przetwarzającą sygnały. By measuring fluorescence lifetime—the time constant of exponential decay—the system calculates temperature with accuracy independent of light intensity, straty zginania włókien, lub degradacja złącza. Ta niezależna od intensywności charakterystyka zapewnia wyjątkową długoterminową stabilność w porównaniu z konwencjonalnymi czujnikami światłowodowymi.
2.1.2 Punktowy a rozproszony czujnik temperatury
Punktowe wykrywanie fluorescencji zapewnia doskonałą rozdzielczość przestrzenną i precyzję pomiaru w porównaniu do rozproszonych systemów światłowodowych opartych na rozpraszaniu Ramana lub Brillouina. Każde miejsce pomiarowe wykorzystuje dedykowany światłowód i dyskretny czujnik, umożliwiając niezależną ocenę temperatury bez zakłóceń międzykanałowych. Średnia temperatura systemów rozproszonych w rozdzielczości przestrzennej w skali metra, potencjalnie maskując zlokalizowane punkty aktywne w określonych miejscach połączenia śrubowe lub złącza spawane.
Architektura punktowa obsługuje elastyczne topologie sieci. Pojedynczy wielokanałowy światłowodowy przetwornik temperatury łączy się z wieloma niezależnymi punktami detekcji poprzez konfigurację gwiazdy lub routing łańcuchowy. This modularity facilitates system expansion and troubleshooting compared to continuous distributed fiber requiring complete replacement when damaged.
2.2 Why Does Fluorescent Technology Excel in High-Voltage Applications?
2.2.1 All-Dielectric Construction Benefits
The sensor assembly contains exclusively insulating materials: quartz optical fiber, ceramic or polymer probe body, and fluorescent crystal. Complete absence of conductive elements eliminates electrical safety concerns inherent to metallic sensors like termopary, oporowe czujniki temperatury, or thermoelectric devices. No clearance distances or creepage path requirements constrain installation, allowing direct mounting on energized przewody szynowe i połączenia.
Testy wytrzymałości dielektrycznej potwierdzają >100Tolerancja napięcia kV pomiędzy czujnikiem a masą. Możliwość ta umożliwia umieszczenie na napięciach 220 kV i 110 kV systemy szyn zbiorczych bez problemów z koordynacją izolacji. Sonda działa równie dobrze na uziemionym sprzęcie, pływające potencjały, lub przewody w pełni pod napięciem.
2.2.2 Charakterystyka odporności elektromagnetycznej
Na transmisję sygnału optycznego nie wpływają pola elektromagnetyczne, zakłócenia częstotliwości radiowej, lub zniekształcenia harmoniczne obecne w podstacje energetyczne. Silne pola magnetyczne otaczające duży prąd szyny zbiorcze podczas warunków awaryjnych lub stanów przejściowych przełączania nie mają wpływu na dokładność pomiaru. Odporność ta okazuje się szczególnie cenna w zastosowaniach obejmujących przetwornice częstotliwości, konwertery energoelektroniczne, lub systemy zasilania trakcyjnego generujące poważne zakłócenia elektryczne.
Tam, gdzie bezprzewodowe czujniki temperatury wymagają zasilania bateryjnego i nadajników radiowych – oba podatne na zakłócenia elektromagnetyczne –światłowód fluorescencyjny systemy działają wyłącznie na zasadach optycznych. Brak akumulatorów eliminuje wymagania konserwacyjne i tryby awarii związane z elektrochemicznym magazynowaniem energii w wymagających środowiskach termicznych.
2.3 Jakie zalety w zakresie wydajności odróżniają czujniki fluorescencyjne od rozwiązań alternatywnych?
2.3.1 Porównanie z termografią w podczerwieni
Czujniki fluorescencyjne zapewniają bezpośredni pomiar kontaktowy w krytycznych skrzyżowaniach, podczas gdy obrazowanie w podczerwieni wykrywa tylko promieniowanie powierzchniowe. Wykrywanie kontaktu eliminuje niepewność dotyczącą emisyjności, tłumienie atmosferyczne, i odbite błędy energii wpływające na dokładność podczerwieni. Ciągły monitoring online rejestruje przejściowe zdarzenia termiczne, które są pomijane w okresowych badaniach. Instalacja wewnątrz Obudowy GIS i zamknięte kanały szyn zbiorczych pokonuje podstawowe ograniczenia penetracji podczerwieni.
2.3.2 Comparison with Wireless Temperature Indicators
Battery-powered wireless sensors suffer from limited operational life (zazwyczaj 3-5 lata), requiring periodic replacement and disposal. Sonda fluorescencyjna lifespan exceeds 25 lat bez konserwacji. Wireless transmission reliability degrades inside grounded metal enclosures due to electromagnetic shielding, while optical fiber penetrates cabinet walls through small ports. Wireless devices also introduce additional electronic components subject to electromagnetic interference and thermal stress failures.
2.3.3 Comparison with Metallic Temperature Sensors
Thermocouples and RTDs exhibit measurement drift over time, requiring periodic calibration. Thermoelectric voltage signals suffer from noise pickup in electrically noisy environments. Lead wire resistance affects RTD accuracy unless compensated through 3-wire or 4-wire configurations. Światłowodowy monitoring temperatury provides inherent calibration stability through physics-based measurement independent of aging effects. The non-metallic construction eliminates insulation requirements and safety clearances mandatory for resistive devices.
2.3.4 Comparison with Distributed Fiber Optic Systems
Distributed temperature sensing based on Raman or Brillouin scattering offers continuous measurement along fiber length but with reduced accuracy (typowo ±2-5°C), wolniejsza reakcja (30-60 Sekund), and meter-scale spatial resolution. Point fluorescent systems achieve ±1°C accuracy, sub-second response, and millimeter-scale localization. For critical applications requiring precise hotspot detection at specific zaciski przyłączeniowe, point sensing delivers superior performance at competitive installed cost.
3. Które wyposażenie szyn zbiorczych wymaga systemów monitorowania temperatury?
3.1 What GIS/GIL Components Need Measurement Points?
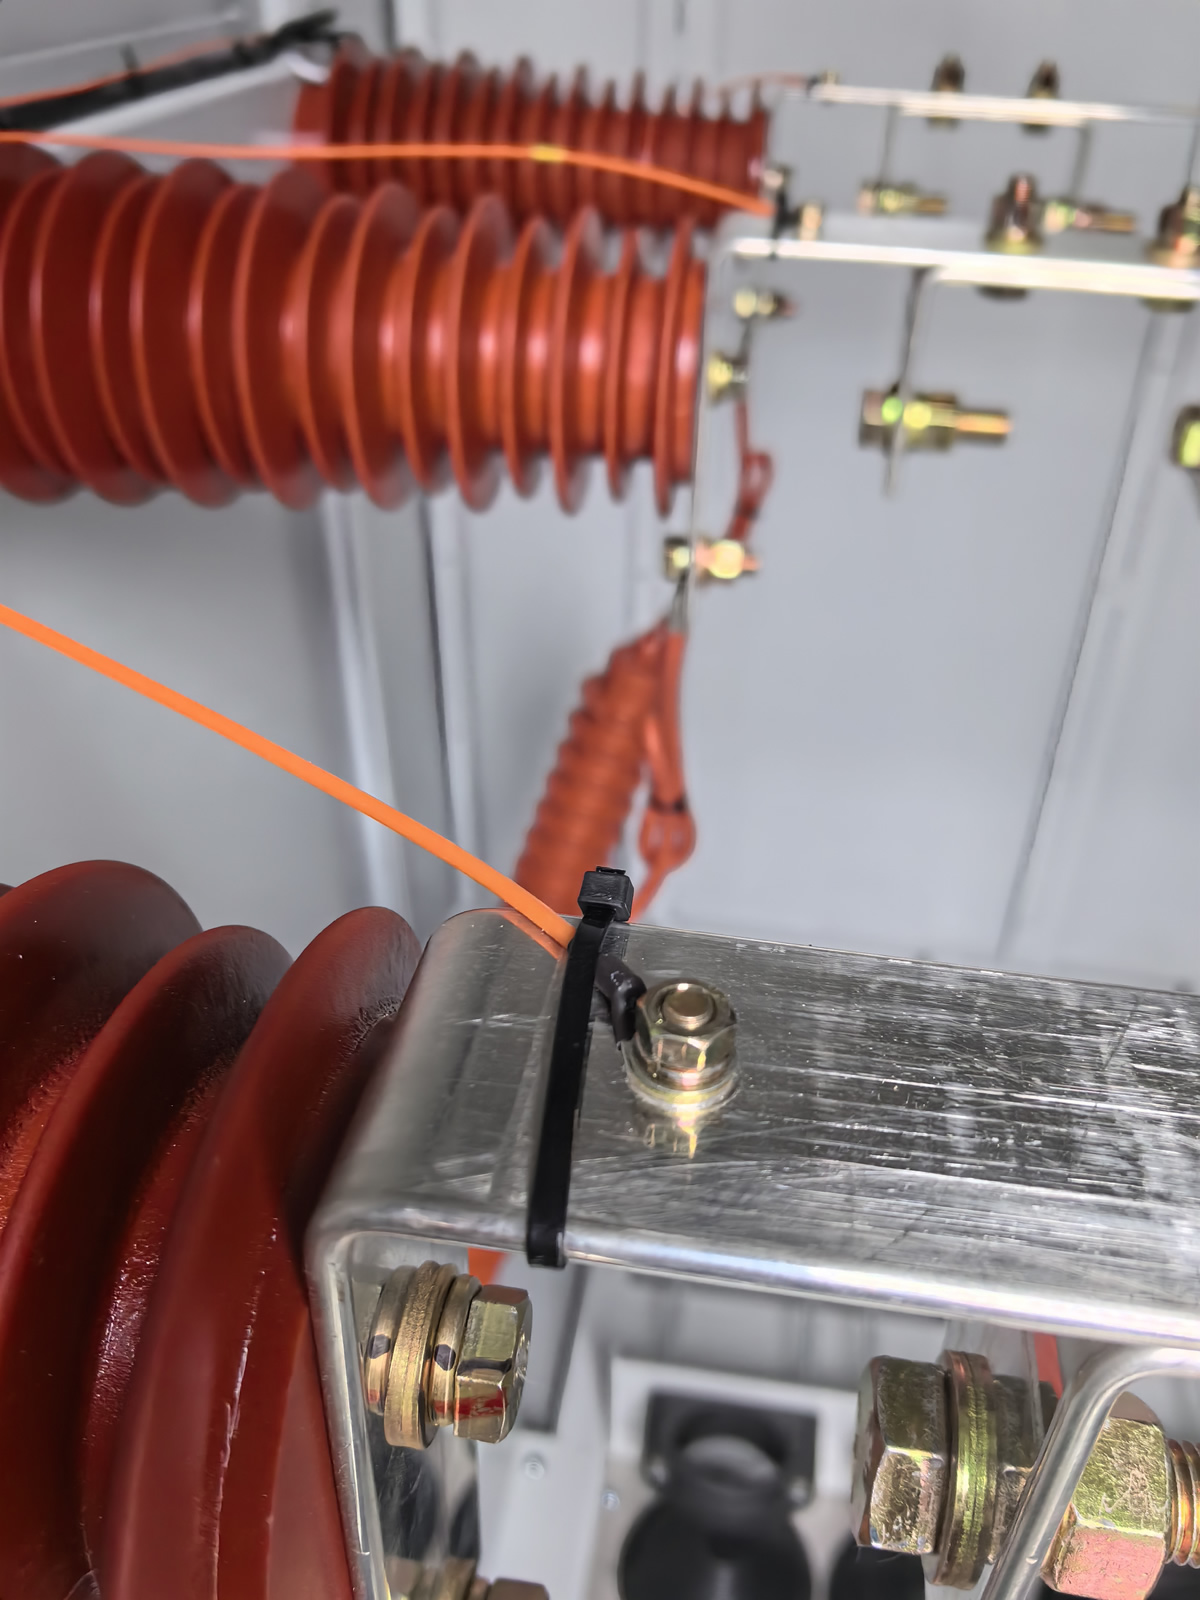
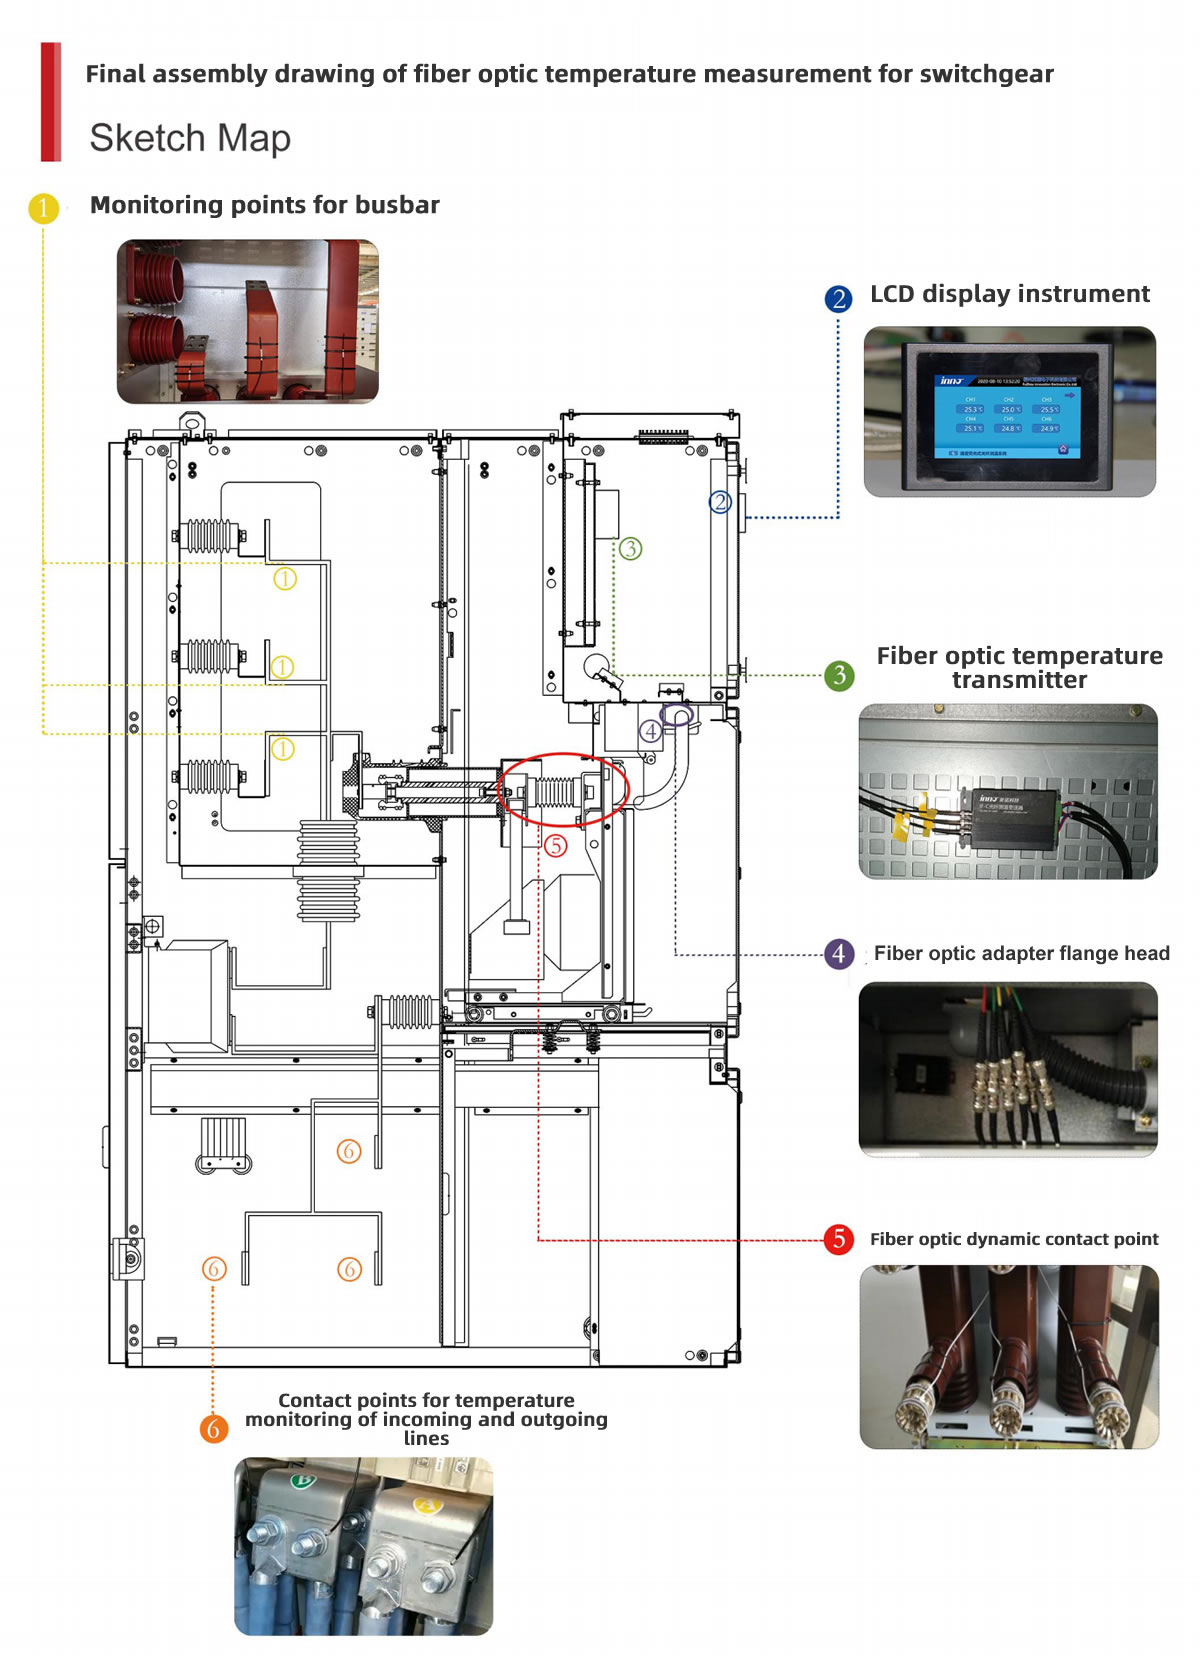
3.1.1 Busbar Connection Flange Monitoring
Rozdzielnica w izolacji gazowej employs bolted flanges to join busbar sections and connect equipment modules. Each three-phase flange contains six to nine bolted connections (two or three per phase) representing potential failure points. Recommended monitoring includes at minimum one sonda czujnika per phase on critical flanges such as transformer feeders, generator connections, and inter-bay links. High-importance circuits may justify monitoring all connections for redundancy.
3.1.2 Cable Termination and Feeder Connections
Where power cables enter Sprzęt GIS Poprzez cable sealing ends or plug-in terminals, the transition from cable conductor to busbar represents a high-resistance junction. Compression lugs, mechanical connectors, and terminal studs all generate heat under load current. Monitoring these interfaces prevents failures that could cascade into cable faults or equipment damage.
3.1.3 Disconnect Switch and Grounding Switch Contacts
Isolation disconnectors within GIS bays employ sliding or rotating contacts subject to wear, zanieczyszczenie, and alignment issues. Grounding switches carry high fault currents during system events, experiencing severe mechanical and thermal stress. Both switch types benefit from contact temperature surveillance to detect degradation before catastrophic failure.
3.2 How to Configure Enclosed Busbar Duct Monitoring?
3.2.1 Busbar Splice Joint Measurement
Zamknięte systemy szyn zbiorczych consist of aluminum or copper bars housed in protective enclosures, with joints every few meters to accommodate thermal expansion and facilitate installation. Each splice joint utilizes bolted connections or welded interfaces—both susceptible to increased resistance over time. Typical monitoring schemes place one or two czujniki temperatury per splice across all phases. For a 50-meter busbar run with 10-meter sections, this approach yields 10-20 punkty pomiarowe.
3.2.2 Branch Connection and Tap-Off Monitoring
Where feeder circuits tap off main distribution busbars, branch connections introduce additional joints and potential failure points. T-connections, phase isolators, and load center tie-ins require individual temperature assessment. Monitoring placement should emphasize highest current branches and locations with historical problems.
3.2.3 Wall Penetration and Phase Barrier Interfaces
Busbar penetrations through concrete walls, fire barriers, or phase segregation panels create mechanical constraint points with differential thermal expansion. Sealing materials may harden over time, imposing stress on conductors. Bushing terminals at penetrations warrant monitoring due to combination of mechanical stress and electrical connection.
3.3 Which Outdoor Busbar Components Demand Surveillance?
3.3.1 Flexible Connector to Rigid Bus Transitions
Plenerowy podstacje wysokiego napięcia employ flexible braided connectors or expansion joints between rigid aluminum tube bus sections to accommodate thermal expansion and seismic movement. Te flexible bus connections experience mechanical flexing, narażenie środowiska, and contact surface oxidation. Temperature monitoring detects deterioration before complete failure causes system outage.
3.3.2 Busbar Expansion Joint Monitoring
Expansion joints accommodate thermal length changes in long rigid bus runs. Sliding contact designs or bellows-type joints introduce contact resistance and wear surfaces. Monitoring identifies excessive friction heating or joint binding that impedes proper expansion.
3.3.3 Equipment Terminal Connections
Connections between outdoor buswork and transformer bushings, zaciski wyłącznika, or disconnect switch blades represent critical interfaces. Terminal bolting torque, surface condition, and alignment directly affect contact resistance and thermal performance. Each phase connection should receive dedicated światłowodowy czujnik temperatury zasięg.
3.4 What Special Applications Require Busbar Temperature Monitoring?
3.4.1 Traction Power Substation DC Busbars
Railway electrification systems utilize rectifier substations converting AC to DC for train propulsion. DC busbar systems carry extremely high continuous currents (thousands of amperes) with superimposed pulsating loads from multiple trains. Contact resistance has proportionally greater thermal impact under DC operation compared to AC. Both positive and negative bus connections require comprehensive monitoring termiczny.
3.4.2 Data Center High-Current Distribution
Nowoczesny centra danych employ overhead or underfloor busbar systems delivering megawatts to server racks through tap-off connections. The mission-critical nature of data center operations makes prevention of busbar failures imperative. Monitoring schemes address main distribution busbars, PDU connections, and static transfer switch terminals.
3.4.3 Industrial Rectifier and Electrolysis Applications
Aluminum smelters, chlor-alkali plants, and other electrochemical processes utilize massive DC busbar systems carrying tens or hundreds of kiloamperes. Połączenia przejściowe miedź-aluminium at rectifier outputs, anode connections, and cell interconnections experience severe thermal and corrosive environments. Temperature monitoring integrated with process control systems optimizes operation while preventing equipment damage.
3.4.4 Renewable Energy Collector Systems
Wind farm and solar power plant podstacje kolektorowe aggregate generation from multiple sources through rozdzielnica and busbar networks. Intermittent generation patterns cause thermal cycling that accelerates connection degradation. Step-up transformer feeders, generator connections, and reactive compensation equipment all benefit from continuous temperature assessment.
4. Ile punktów pomiarowych może monitorować system? Opcje konfiguracji
4.1 What Channel Capacities Do Demodulators Offer?
Norma Demodulator temperatury światłowodu configurations support 4, 8, 16, 32, lub 64 independent measurement channels within a single chassis. Każdy kanał łączy się z jednym fluorescent sensor probe through dedicated optical fiber up to 80 meters in length. The multi-channel architecture enables centralized data acquisition and processing while distributing sensors throughout monitoring zones.
Demodulator selection depends on total measurement point requirements, physical distribution geometry, and system redundancy considerations. Smaller substations may deploy one 16-channel unit, while large facilities utilize multiple 32-channel or 64-channel systems. Modular expansion capability allows initial installation of basic capacity with field upgrades as monitoring needs grow.
4.2 How Many Monitoring Points Does a Typical Substation Need?
4.2.1 220kV Substation Configuration Example
A representative 220kV transmission substation with two transformer bays, four line bays, and auxiliary equipment might configure monitoring as follows:
- Main transformer HV bushings: 3 phases × 2 transformers = 6 zwrotnica
- Transformer MV and LV feeders: 3 × 2 × 2 = 12 zwrotnica
- GIS line bay znajomości: 3 × 4 bays = 12 zwrotnica
- Bus coupler and sectionalizer: 6 zwrotnica
- Cable connections and critical joints: 8-12 zwrotnica
Total system requirement: 44-50 punkty pomiarowe, accommodated by two 32-channel demodulators with expansion capacity.
4.2.2 110kV Distribution Substation Approach
Medium-voltage distribution substations with 10-15 feeder bays typically monitor:
- Main transformer connections: 6-9 zwrotnica
- Each feeder bay critical joints: 2-3 points × 12 bays = 24-36 zwrotnica
- Bus sectionalizers and tie breakers: 4-6 zwrotnica
- Reactive compensation equipment: 3-6 zwrotnica
A single 64-channel system or two 32-channel units provide adequate capacity.
4.2.3 35kV Switchgear and Distribution Applications
Zakłady przemysłowe, obiekty wykorzystujące energię odnawialną, and commercial complexes operating at 35kV distribution voltage install rozdzielnica w obudowie metalowej with numerous feeder circuits. Each circuit breaker cubicle contains 6-9 krytyczne punkty pomiarowe (three-phase upper contacts, lower contacts, końcówki kablowe). A facility with 20 feeders requires 120-180 czujniki, implementable through three to six demodulator chassis depending on channel density selection.
4.3 What Factors Determine Optimal Measurement Point Quantity?
4.3.1 Equipment Criticality Assessment
Priority monitoring addresses equipment whose failure would cause significant operational, bezpieczeństwo, or financial consequences. Main transformer connections, generator feeders, and critical process loads receive comprehensive coverage. Less critical distribution circuits may employ selective monitoring based on risk assessment.
4.4.2 Historical Failure Data Analysis
Maintenance records identifying previously failed connections, thermographic survey hotspots, and equipment types with known reliability issues guide measurement point allocation. Components with failure history justify more extensive monitoring than equipment with proven reliability.
4.3.3 Economic Optimization Modeling
Cost-benefit analysis balances monitoring system investment against prevented failure costs and operational improvements. While comprehensive coverage provides maximum protection, practical deployments optimize measurement point quantity to address highest-risk locations within budget constraints. Phased implementation strategies install core monitoring initially with planned expansion based on operational experience and evolving requirements.
5. Jaką dokładność temperatury można osiągnąć? Specyfikacje wydajności
5.1 What Measurement Precision Standards Apply?
Ten fluorescencyjny, światłowodowy system monitorowania temperatury delivers ±1°C accuracy across the complete -40°C to 260°C measurement range. This full-scale precision ensures reliable detection of abnormal temperature conditions throughout normal operation and fault scenarios. Temperature resolution of 0.1°C enables identification of subtle trending patterns indicating gradual equipment degradation.
Czas reakcji poniżej 1 second captures rapid thermal transients during switching operations, warunki usterek, lub nagłe zmiany obciążenia. Fast response combined with continuous sampling (zazwyczaj 1-10 drugie interwały) provides real-time thermal surveillance exceeding capabilities of periodic infrared surveys or manual inspections.
5.2 Jak porównuje się parametry niezawodności systemu?
5.2.1 Żywotność sondy czujnika
Fluorescencyjne czujniki temperatury osiągnąć >25 roczny okres eksploatacji przy ciągłej pracy w trudnych warunkach elektrycznych. Zasada pomiaru oparta na fizyce nie wykazuje dryftu starzenia ani degradacji kalibracji. Brak baterii, elementy elektroniczne, lub elementy eksploatacyjne w zespole sondy eliminują typowe tryby awarii wpływające na inne technologie wykrywania.
5.2.2 Średni czas między awariami
Elektronika demodulatorów zaprojektowana dla środowisk przemysłowych osiąga ponadprzeciętny współczynnik MTBF 50,000 Godzin (około 5.7 lat ciągłej pracy). Opcje redundantnego zasilania, obwody watchdoga, i możliwości autodiagnostyki zwiększają ogólną niezawodność systemu. Doświadczenie terenowe pokazuje rzeczywistą niezawodność znacznie przekraczającą przewidywania teoretyczne, wynikającą z konserwatywnego doboru komponentów i rygorystycznej kontroli jakości.
5.2.3 Normy Ochrony Środowiska
Demodulator chassis maintain IP65 protection against dust ingress and water spray, suitable for indoor substation control room installation. Sondy czujnikowe achieve IP67 rating, providing submersion resistance for outdoor installations or locations subject to condensation, washing, or weather exposure. Hermetically sealed probe construction prevents moisture infiltration that could compromise measurement accuracy or dielectric strength.
5.2.4 Withstand Voltage Capabilities
Type testing validates sensor insulation withstand voltage >100kV AC at power frequency, exceeding requirements for direct mounting on 220kV and 110kV systems. Dielectric strength testing protocols follow IEC 60060 standards for high-voltage testing procedures. The all-dielectric construction provides inherent voltage tolerance without relying on insulating barriers or clearance distances.
5.3 What Environmental Operating Conditions Are Supported?
5.3.1 Temperature Range Adaptation
Demodulator electronics operate across -40°C to +85°C ambient temperature range, accommodating outdoor installations in extreme climates from arctic to tropical environments. Sondy czujnikowe measure across -40°C to 260°C, providing substantial margin above normal busbar operating temperatures (zazwyczaj <80°C) while detecting severe overheating conditions approaching conductor damage thresholds.
5.3.2 Humidity and Condensation Tolerance
Systems function throughout 5%-95% relative humidity range including condensing conditions. Conformal coating of electronic assemblies, sealed connectors, and moisture-resistant materials enable reliable operation in high-humidity substations, instalacje przybrzeżne, or tropical climates.
5.3.3 Odporność na wstrząsy sejsmiczne i wibracje
Mechanical design follows 8-degree seismic intensity criteria per Chinese seismic design codes (approximately 0.3g peak ground acceleration). Vibration testing validates performance under continuous vibration and shock loading representative of switchgear operation, mechanical equipment nearby, or transportation environments. Secure fiber routing, strain relief provisions, and robust probe attachment methods prevent mechanical failure during seismic events.
5.3.4 Kompatybilność elektromagnetyczna
Equipment meets IEC 61000 electromagnetic compatibility standards including immunity to electrostatic discharge, radiated RF fields, electrical fast transients, surge voltages, and conducted disturbances. Emission testing confirms compliance with radiated and conducted emission limits. Comprehensive EMC qualification ensures reliable operation in severe electromagnetic environments characteristic of podstacje energetyczne i obiektów przemysłowych.
6. Jak działa funkcja inteligentnego alarmu? Możliwości przewidywania
6.1 What Alarm Threshold Configurations Are Available?
6.1.1 Absolute Temperature Limit Alarms
The system supports user-configurable warning and critical temperature thresholds for each measurement point. Typical configurations establish warning levels 20-30°C below critical limits, providing advance notice of developing problems. Na przykład, połączenia szyn zbiorczych might set 80°C warning and 100°C critical thresholds based on equipment ratings and historical operating data.
Multi-level alarming enables graduated response protocols. Warning alarms trigger investigation and trending analysis without immediate operational action. Critical alarms mandate urgent response including load reduction, inspekcja sprzętu, or emergency shutdown depending on severity and affected systems.
6.1.2 Temperature Rate-of-Rise Detection
Beyond static temperature thresholds, the system calculates temperature change rates (°C/minute or °C/hour) to identify abnormally rapid heating. Sudden resistance increases from loose connections, contact deterioration, or incipient faults produce characteristic rapid temperature rise signatures. Rate-based alarms detect these conditions earlier than absolute temperature limits, providing additional response time for corrective action.
6.1.3 Phase Imbalance Comparison
For three-phase equipment, the system automatically compares temperatures across phases to identify asymmetric conditions. Significant phase-to-phase temperature differences (zazwyczaj >10-15°C) indicate single-phase problems like loose connections, niezrównoważone obciążenie, or contact defects. This comparative analysis proves especially valuable since three-phase systems should exhibit similar thermal behavior under balanced load conditions.
6.1.4 Equipment Class Benchmarking
Advanced alarming compares similar equipment types (Na przykład., all line feeder connections) to identify outliers operating warmer than peers. Statistical analysis of temperature distribution across equipment populations highlights degrading units even when absolute temperatures remain below alarm thresholds. This predictive approach detects deterioration trends before conventional alarms trigger.
6.2 How Are Operators Notified of Alarm Conditions?
6.2.1 Local Annunciation
Temperature demodulators provide local visual and audible alarm indication through panel-mounted indicators, LCD displays, or touchscreen interfaces. Color-coded status LEDs (zielony/żółty/czerwony) convey normal/warning/critical conditions at a glance. Audible alarms with silence acknowledgment ensure operator awareness even when displays are not actively monitored.
6.2.2 Centralized Monitoring System Integration
Alarm data transmits to substation systemy SCADA, platformy zarządzania budynkami, or dedicated monitoring software through standard communication protocols. Centralized displays show station-wide temperature status with alarmed points highlighted. Operators access detailed trending, measurement histories, and diagnostic information for investigation and troubleshooting.
6.2.3 Remote Notification Channels
Email and SMS text message notifications alert designated personnel when alarm conditions occur, enabling rapid response regardless of operator location. Configurable notification lists, procedury eskalacyjne, and time-based routing ensure appropriate staff receive alerts. Remote notification proves especially valuable for unattended facilities, after-hours monitoring, or critical equipment requiring immediate attention.
6.3 What Historical Data Capabilities Support Predictive Maintenance?
Ciągłe rejestrowanie danych rejestruje pełną historię temperatur na potrzeby analizy trendów i oceny stanu sprzętu. Pamięć nieulotna przechowuje minimum 5 lat danych pomiarowych przy konfigurowalnych częstotliwościach próbkowania. Umożliwiają to historyczne bazy danych:
- Długoterminowe trendy w celu identyfikacji wzorców stopniowej degradacji
- Analiza zmienności sezonowej w celu ustalenia poziomu bazowego
- Badania korelacji obciążenia łączące temperaturę z wielkością prądu
- Kryminalistyka awarii poprzez przegląd danych przed zdarzeniem
- Weryfikacja efektywności konserwacji poprzez porównanie wyników wstępnych- i temperatury po konserwacji
Automatyczne generowanie raportów odbywa się codziennie, tygodnik, miesięczny, oraz roczne podsumowania temperatur wraz z analizą statystyczną, dzienniki zdarzeń alarmowych, i punktacja stanu sprzętu. Raporty te wspierają dokumentację zgodności z przepisami, programy zarządzania aktywami, i inicjatywy ciągłego doskonalenia.
7. W jaki sposób system współpracuje z automatyką podstacji?
7.1 Które protokoły komunikacyjne są obsługiwane?
7.1.1 Standard przemysłowy RS485 Modbus RTU
Norma Komunikacja szeregowa RS485 using Modbus RTU protocol provides robust connectivity for industrial environments. Transmission distances up to 1200 meters support distributed demodulator placement throughout substations. Multi-drop capability allows up to 32 urządzenia (expandable with repeaters) on single bus network. Configurable parameters include baud rates from 9600 do 115200 bps, bity danych, parytet, and stop bits for compatibility with diverse master systems.
7.1.2 IEC 60870-5-101/104 Power Utility Protocols
IEC 60870-5 series represents international standards for telecontrol equipment and systems in electrical engineering and power system automation. Protocol support enables seamless integration with utility Stacje nadrzędne SCADA, remote terminal units (RTU), and substation automation gateways. Both serial (101) and TCP/IP (104) variants accommodate different network architectures.
7.1.3 IEC 61850 Substation Automation Standard
IEC 61850 definiuje sieci i systemy komunikacyjne dla automatyki energetycznej, providing object-oriented data models, high-speed peer-to-peer messaging, i synchronizacja czasu. Monitorowanie temperatury integration through IEC 61850 enables advanced applications including coordinated control, event sequence recording, and integration with protection systems. Specyfikacja komunikatu produkcyjnego (MMS-y) provides standardized access to real-time data and configuration parameters.
7.1.4 OPC UA Industrial Interoperability
Open Platform Communications Unified Architecture (OPC UA) provides vendor-neutral industrial automation connectivity. Platform-independent architecture supports integration with enterprise systems, platformy chmurowe, and Industry 4.0 aplikacje. Secure authentication, szyfrowana komunikacja, and information modeling capabilities facilitate digital transformation initiatives.
7.2 What Integration Architectures Are Possible?
7.2.1 Direct SCADA Connection
Temperature demodulators connect directly to substation automation system RTUs or data concentrators through serial or Ethernet interfaces. Real-time data including individual point temperatures, stan alarmowy, and diagnostic information upload to master stations for centralized visualization and archiving. Integration depth ranges from simple analog value reporting to complex event notification and time-series data streaming.
7.2.2 Standalone Monitoring Networks
Dedykowany temperature monitoring networks operate independently from primary SCADA infrastructure, providing isolation and security. Standalone architecture suits applications requiring separate monitoring for safety systems, ochrona infrastruktury krytycznej, or installations where existing automation systems lack expansion capacity. Dedicated monitoring stations offer specialized displays, zaawansowana analityka, and operator interfaces optimized for thermal management.
7.2.3 Cloud-Based Data Analytics
Modern installations leverage cloud connectivity for advanced analytics, zdalny dostęp, and multi-site aggregation. Secure gateway devices upload temperature data to cloud platforms providing machine learning analysis, wykrywanie anomalii, and predictive maintenance algorithms. Cloud architectures enable centralized monitoring of distributed facilities, vendor remote support, and correlation with external data sources like weather, commodity prices, or market conditions.
7.3 What Data Upload Intervals Are Typical?
Real-time temperature measurements update at 1-10 second intervals depending on application criticality and communication bandwidth. Faster update rates (1-2 Sekund) suit dynamic processes or rapid-response applications. Slower intervals (5-10 Sekund) suffice for thermal mass equipment with gradual temperature changes. Alarm events trigger immediate notification regardless of normal polling schedules, ensuring timely awareness of abnormal conditions.
Historical data uploads occur through scheduled batch transfers to minimize communication overhead. Typical configurations archive minute-average, hourly-average, and daily-average values with configurable retention periods. Event-triggered uploads capture alarm occurrences, threshold crossings, and operator actions with precise timestamps for forensic analysis.
8. Które branże wdrażają monitorowanie temperatury szyn zbiorczych?
8.1 What Power Utility Applications Dominate Deployment?
8.1.1 Transmission and Distribution Substations
Electric utilities represent the largest market segment for monitorowanie temperatury szyn zbiorczych, with installations spanning voltage classes from 35kV distribution to 500kV transmission. National grid operators implement standardized monitoring specifications across substation portfolios to reduce failure rates, przedłużyć żywotność sprzętu, and optimize maintenance resources. Typical deployments address Sprzęt GIS, plenerowy podstacje izolowane powietrzem, and hybrid installations combining both technologies.
8.1.2 Renewable Energy Generation Facilities
Farmy wiatrowe, solar power plants, and energy storage installations utilize podstacje kolektorowe aggregating distributed generation for grid interconnection. Variable generation patterns create thermal cycling stress on electrical connections. Systemy monitorowania optimize operation, prevent revenue loss from unplanned outages, and support remote facility management with minimal on-site staffing. Battery energy storage systems particularly benefit from thermal management preventing fire hazards and maximizing cycle life.
8.1.3 Hydroelectric and Thermal Power Stations
Generating stations employ high-current systemy szyn zbiorczych connecting generators to step-up transformers and transmission networks. Generator bus ducts, unit auxiliary transformers, and station service distribution all incorporate temperature monitoring. Continuous surveillance prevents forced outages, zmniejsza koszty konserwacji, and extends major equipment service intervals. Integration with plant distributed control systems enables automated load optimization based on thermal constraints.
8.2 Why Do Industrial Facilities Require Busbar Monitoring?
8.2.1 Heavy Industry Process Reliability
Huty stali, huty aluminium, zakłady chemiczne, and refineries operate continuous processes where electrical failures cause substantial production losses and safety hazards. Mission-critical electrical infrastructure receives comprehensive monitoring termiczny to prevent disruptions. Arc furnace installations, electrolytic cells, and large motor drives present particularly demanding thermal management challenges.
8.2.2 Manufacturing Facility Uptime Requirements
Automotive assembly plants, zakłady produkujące półprzewodniki, and pharmaceutical manufacturers maintain stringent production schedules with minimal downtime tolerance. Konserwacja predykcyjna enabled by temperature monitoring prevents unscheduled interruptions, supports planned maintenance windows, and optimizes equipment replacement timing. Manufacturing execution systems integrate thermal data for overall equipment effectiveness (OEE) optymalizacja.
8.2.3 Infrastruktura krytyczna centrum danych
Hyperscale data centers, colocation facilities, and enterprise server rooms implement redundant power distribution with systemy szyn zbiorczych delivering megawatts to IT loads. Tier III and Tier IV reliability standards demand continuous monitoring, N+1 redundancy, and zero unplanned downtime. Czujniki temperatury on main distribution busbars, jednostki dystrybucji energii (PDUs), automatyczne przełączniki transferu, and branch circuits ensure infrastructure reliability supporting cloud services, financial systems, and telecommunications networks.
8.3 What Specialized Transportation Applications Exist?
8.3.1 Systemy zasilania trakcji kolejowej
Electrified railways including metros, lekka kolej, and high-speed trains utilize traction substations converting utility power to DC or low-frequency AC for train propulsion. Rectifier busbars carrying thousands of amperes require robust thermal management. Third rail systems, overhead catenary supports, and substation distribution all incorporate temperature monitoring. Integration with railway signaling and operations control centers coordinates power management with train scheduling.
8.3.2 Airport Ground Power and Lighting
Airport electrical infrastructure supports runway lighting, terminal buildings, fueling systems, and aircraft ground power. Reliability requirements for navigational aids and critical lighting demand predictive maintenance. Systemy monitorowania address airfield electrical vaults, lighting control centers, and terminal distribution.
8.3.3 Marine and Offshore Installations
Ships, platformy morskie, and marine terminals operate in harsh environments with limited maintenance access. Fluorescencyjny światłowód systems provide corrosion resistance, Odporność na zakłócenia elektromagnetyczne, and reliable operation under vibration and thermal cycling. Marine classification societies increasingly specify online monitoring for critical electrical systems.
8.4 How Do Commercial Buildings Benefit from Temperature Monitoring?
High-rise buildings, centra handlowe, and campus facilities utilize busbar riser systems distributing power vertically through building structures. Monitoring addresses tap-off connections at floor levels, main distribution boards, and generator tie-in points. Building management system (BMS) integration enables coordinated facility management, energy optimization, and preventive maintenance scheduling. Green building certifications increasingly require advanced monitoring supporting sustainability objectives.
9. Jakiego zwrotu z inwestycji można się spodziewać? Analiza ekonomiczna

9.1 What Investment Components Comprise Total System Cost?
9.1.1 Hardware Capital Expenditure
System acquisition costs include temperature demodulators, sondy czujnikowe, kable światłowodowe, elementy montażowe, i interfejsy komunikacyjne. Demodulator pricing scales with channel capacity, obsługa protokołu, and feature set. Sensor quantity determines overall material cost, with typical installations ranging from 16 do 64 measurement points depending on facility size and criticality.
9.1.2 Koszty instalacji i uruchomienia
Field installation labor includes sensor mounting, prowadzenie włókien, demodulator installation, i uruchomienie systemu. Installation complexity varies with equipment accessibility, outage availability, i wymagania integracyjne. Straightforward installations on accessible outdoor busbars require minimal labor, chwila GIS retrofits or confined space work increase installation effort. Commissioning activities encompass functional testing, konfiguracja progu alarmowego, communication verification, i szkolenie operatorów.
9.1.3 Lifecycle Operating Costs
The maintenance-free design eliminates periodic calibration, wymiana czujnika, and consumable expenses characteristic of alternative technologies. Annual operating costs include minimal electrical power consumption (zazwyczaj <100W per demodulator), software maintenance agreements (fakultatywny), and periodic functional verification. Total lifecycle cost analysis demonstrates significant advantage over systems requiring battery replacement, usługi kalibracyjne, or component refresh.
9.2 What Failure Costs Does Monitoring Prevent?
9.2.1 Equipment Replacement Expenses
Catastrophic busbar failures necessitate replacement of damaged conductors, izolatory, obudowy, i podłączony sprzęt. Repair costs for Sprzęt GIS prove particularly substantial due to specialized components, Obsługa gazu SF6, and factory-trained service requirements. Transformer damage from busbar faults may require complete unit replacement. Early detection through temperature monitoring prevents progression from manageable maintenance issues to catastrophic failures requiring major equipment replacement.
9.2.2 Unplanned Outage Impact
Beyond direct repair costs, electrical failures cause business interruption losses varying by industry and facility criticality. Manufacturing plants experience production losses, raw material waste, and contract penalties. Data centers face service level agreement violations and customer attrition. Utilities incur energy not served penalties and regulatory scrutiny. Healthcare facilities encounter patient safety risks and operational disruptions. Konserwacja predykcyjna enabled by continuous monitoring schedules repairs during planned outages, minimizing business impact.
9.2.3 Safety Incident Consequences
Electrical failures create arc flash, ogień, and explosion hazards threatening personnel safety. Workplace injuries trigger workers compensation claims, regulatory investigations, potential litigation, i szkody dla reputacji. Proactive thermal management reduces accident risk, supporting corporate safety objectives and regulatory compliance. Insurance underwriters increasingly recognize advanced monitoring in premium calculations and coverage terms.
9.3 How Quickly Does Investment Return Through Operational Benefits?
9.3.1 Payback Period Calculation
Return on investment analysis compares system acquisition and installation costs against prevented failure expenses and operational improvements. Conservative analysis assumes prevention of one major failure over equipment service life justifies monitoring investment. Facilities with higher failure risk, critical operations, or expensive equipment achieve faster payback. Typowe okresy ROI wahają się od 1-3 years depending on application specifics and risk exposure.
9.3.2 Wydłużony okres użytkowania sprzętu
Continuous thermal surveillance prevents cumulative damage from repeated overheating episodes, extending system szyn zbiorczych and connected equipment service life. Deferring capital replacement through optimized maintenance generates substantial value, particularly for expensive assets like transformers and rozdzielnica. Time value of money analysis demonstrates that extending equipment life by even modest percentages significantly improves lifecycle economics.
9.3.3 Optimized Maintenance Resource Allocation
Condition-based maintenance guided by temperature trending focuses resources on equipment actually requiring attention rather than time-based preventive maintenance schedules. This optimization reduces unnecessary inspections, extends maintenance intervals for healthy equipment, and improves workforce productivity. Maintenance cost savings accumulate annually throughout monitoring system operational life.
9.3.4 Insurance and Regulatory Benefits
Niektórzy ubezpieczyciele oferują obniżki składek dla placówek wdrażających zaawansowane środki monitorowania i ograniczania ryzyka. Zgodność z przepisami dotyczącymi infrastruktury krytycznej, obiekty nuklearne, lub niebezpieczne procesy mogą wymagać monitorowania online, co sprawia, że inwestycja w system jest konieczna, a nie opcjonalna. Udokumentowane monitorowanie stanu wspiera inspekcje regulacyjne i wykazuje należytą staranność w zarządzaniu bezpieczeństwem.
10. Jak wybrać niezawodnych dostawców systemów monitorowania szyn zbiorczych?
10.1 Jakie kwalifikacje dostawcy wskazują na kompetencje?
10.1.1 Certyfikaty Systemu Zarządzania Jakością
ISO 9001 certyfikacja zarządzania jakością demonstruje ustalone procesy kontroli projektu, jakość produkcji, i ciągłe doskonalenie. Dostawcy utrzymujący certyfikowane systemy jakości wdrażają udokumentowane procedury doboru komponentów, testowanie produkcji, kalibrowanie, i identyfikowalność. Certyfikacja przez akredytowanych rejestratorów zapewnia niezależną weryfikację możliwości jakościowych.
10.1.2 Testowanie typu produktu i zgodność
Type test reports from accredited laboratories validate product performance against published specifications and relevant standards. Testing should encompass temperature accuracy, Czas reakcji, kwalifikacja środowiskowa, kompatybilność elektromagnetyczna, and safety parameters. Compliance with CE marking requirements, RoHS hazardous substance restrictions, and regional electrical safety codes confirms product suitability for target markets.
10.1.3 Industry Experience and Reference Projects
Demonstrated experience in power utility, przemysłowy, or transportation sectors indicates understanding of application requirements and operating environments. Reference installations at comparable facilities provide validation of supplier capabilities and product performance. Customer testimonials, studia przypadków, and site visit opportunities enable due diligence investigation before supplier selection.
10.2 How to Evaluate Product Quality and Reliability?
10.2.1 Technology Ownership and Innovation
Suppliers developing proprietary technologię wykrywania fluorescencyjnego rather than reselling third-party products demonstrate technical depth and long-term commitment. Patents, publikacje techniczne, and research partnerships indicate innovation capability. In-house engineering expertise supports customization, rozwiązywanie problemów, and continuous product improvement.
10.2.2 Component Selection and Manufacturing Standards
Quality suppliers specify components from reputable manufacturers with established reliability data. Critical items like photodetectors, optical components, and electronic assemblies should come from recognized brands with industrial-grade specifications. Manufacturing in controlled environments with documented procedures, automated testing, and statistical process control ensures consistent product quality.
10.2.3 Factory Testing and Quality Assurance
Comprehensive factory testing validates each production unit before shipment. Testing protocols should include temperature accuracy verification across operating range, communication interface validation, alarm functionality confirmation, oraz badanie stresu środowiskowego. Test documentation accompanying shipped equipment provides traceability and baseline performance data.
10.2.4 Warranty Terms and Technical Support
Warranty coverage duration, scope, and response commitments indicate supplier confidence in product reliability. Standard warranties spanning multiple years with comprehensive coverage demonstrate quality commitment. Technical support availability including application engineering, pomoc w montażu, and post-installation troubleshooting proves essential for successful project execution.
10.3 What Technical Support Capabilities Matter Most?
10.3.1 Pre-Sales Engineering Services
Competent suppliers provide application consultation, badania witryny, measurement point selection guidance, and system design services before purchase commitments. Engineering support should address integration requirements, planowanie instalacji, and performance prediction. Detailed proposals with equipment specifications, layout drawings, and implementation plans demonstrate supplier technical depth.
10.3.2 Installation and Commissioning Assistance
Field services including supervised installation, startup commissioning, and system optimization ensure proper deployment. Supplier technicians bring specialized knowledge of sensor mounting techniques, najlepsze praktyki w zakresie routingu światłowodów, i konfiguracji systemu. On-site training transfers knowledge to facility maintenance personnel for ongoing operation.
10.3.3 Ongoing Technical Support Infrastructure
Post-installation support through helpdesk services, zdalna diagnostyka, and emergency response maintains system reliability. Responsive technical support with knowledgeable staff resolves issues quickly, minimalizując przestoje. Global suppliers should provide regional support centers addressing time zone differences and language requirements.
10.4 Dlaczego warto wybrać Fuzhou Innovation Electronic Scie&Technologia Co., z oo?
Fuzhou Innowacja Elektroniczna Scie&Technologia Co., Ltd. brings comprehensive expertise to monitorowanie temperatury szyn zbiorczych aplikacje, combining technical innovation with proven field performance since establishment in 2011. The company maintains ISO quality certification, holds relevant product certifications including CE and RoHS compliance, and serves over 500 power utility customers across 30+ kraje.
Core competencies include proprietary fluorescencyjna technologia wykrywania światłowodów, multi-channel demodulator platforms, and application-specific solutions for Sprzęt GIS, zamknięte szyny zbiorcze, and outdoor installations. Engineering capabilities support custom configurations, opracowanie protokołu, and integration with diverse automation platforms. Manufacturing facilities employ rigorous quality control with comprehensive testing protocols.
Technical support infrastructure provides pre-sales consultation, detailed engineering design, nadzór nad montażem, usługi uruchomieniowe, and ongoing maintenance assistance. Customer success focus ensures proper system specification, reliable implementation, and long-term operational satisfaction.
Często zadawane pytania
Pytanie 1: What differentiates busbar monitoring from switchgear contact temperature monitoring?
Both applications utilize identical fluorescencyjna technologia światłowodowa with distinctions primarily in installation locations and measurement point configurations. Switchgear monitoring emphasizes circuit breaker moving and stationary contacts plus cable terminal connections within individual cubicles. Busbar monitoring focuses on connection flanges, złącza spawane, punkty odpływowe, and equipment interconnections across distribution systems. Optimal substation protection combines both approaches, creating comprehensive thermal surveillance networks addressing all critical current-carrying components.
Pytanie 2: Can monitoring systems be retrofitted to existing GIS equipment already in service?
Retrofit installations represent common deployment scenarios with proven methodologies minimizing operational disruption. No-outage installation techniques leverage scheduled maintenance windows, coordinated outages, or live-line working procedures to position czujniki without extended service interruptions. Nad 200 successful GIS retrofit projects demonstrate feasibility across diverse equipment manufacturers and vintages. Detailed planning, proper tooling, and experienced installation personnel ensure safe, efficient upgrades of operating equipment.
Pytanie 3: Does the system require periodic calibration like conventional temperature sensors?
No calibration necessary. Fluorescencyjne czujniki światłowodowe employ fundamental physics-based measurement principles without drift phenomena affecting thermocouples, BRT, lub termistory. The temperature-fluorescence decay relationship remains constant over sensor lifetime, maintaining factory calibration accuracy for 25+ lata. This maintenance-free characteristic eliminates periodic calibration expenses, documentation requirements, and accuracy uncertainty between calibration intervals. Field experience validates long-term stability with sensors operating continuously for over a decade without measurable drift.
Pytanie 4: Can the system monitor transformers, reaktory, and other equipment beyond busbars?
Absolutnie. The versatile fluorescent fiber optic platform addresses diverse thermal monitoring applications throughout electrical infrastructure. Dry-type transformers benefit from winding hotspot measurement (12-24 point configurations). Transformatory zanurzone w oleju wykorzystują czujniki światłowodowe do pomiaru temperatury uzwojenia, górny pomiar oleju, i monitorowanie rdzenia. Reaktory bocznikowe, reaktory szeregowe, a reaktory filtrujące obejmują nadzór termiczny. Systemy kablowe wykorzystują monitorowanie połączeń spawanych, zakończenia, i przejścia. Odporność elektromagnetyczna technologii, tolerancja wysokiego napięcia, i iskrobezpieczeństwo umożliwiają zastosowanie w praktycznie wszystkich typach sprzętu elektrycznego wymagającego oceny temperatury.
Pytanie 5: W jaki sposób mogę uzyskać szczegółową dokumentację techniczną i wyceny projektów?
Dokumentacja techniczna, wytyczne dotyczące aplikacji, a propozycje dotyczące konkretnych projektów są dostępne po bezpośrednich konsultacjach z naszym zespołem inżynierów. Podaj poniższe informacje, aby ułatwić dokładne rekomendacje:
- Rodzaje i modele sprzętu (Producent GIS, specyfikacje szyn zbiorczych, klasa napięcia)
- Poziomy napięcia (35kv, 110kv, 220kv, lub inny)
- Konkretne miejsca pomiarów i identyfikacja komponentów
- Project location and implementation timeline
- Wymagania integracyjne (protokoły komunikacyjne, existing automation systems)
- Any special environmental or operational considerations
Our team will respond with comprehensive technical proposals including measurement point recommendations, architektura systemu, equipment specifications, wskazówki dotyczące instalacji, and detailed commercial quotations tailored to your specific requirements.
Dokumentacja techniczna i konsultacje

Aby uzyskać szczegółowe specyfikacje techniczne, wsparcie projektowania inżynierskiego, application consultation, or project quotations, prosimy o kontakt z naszym zespołem technicznym:
Fuzhou Innowacja Elektroniczna Scie&Technologia Co., Ltd.
Przyjęty: 2011
E-mail: web@fjinno.net
WhatsApp/WeChat/telefon: +86 13599070393
QQ: 3408968340
Adres: Liandong U Grain Networking Park Industrial Park,
Nr 12 Xingye West Road, Fuzhou, Fujian powiedział:, Chiny
Strona internetowa: www.fjinno.net
Our experienced engineering team provides comprehensive support throughout project lifecycle including:
- Pre-sales application consultation and site assessment
- Custom system design and measurement point optimization
- Detailed technical specifications and compliance documentation
- Installation planning and fiber routing design
- On-site commissioning and system optimization
- Operator training and maintenance procedures
- Ongoing technical support and troubleshooting assistance
- System expansion and upgrade planning
Available technical documentation includes:
- Product datasheets and specification sheets
- Installation manuals and mounting guidelines
- Communication protocol documentation
- Integration guides for automation platforms
- Application notes for specific equipment types
- Case studies and reference installations
- Test reports and certification documents
Zapraszamy do składania zapytań dot busbar temperature monitoring solutions, konfiguracje niestandardowe, international projects, and integration with existing substation infrastructure. Our global experience spans utility, przemysłowy, transport, and commercial applications across diverse operating environments and regulatory frameworks.
Zastrzeżenie
Informacje techniczne, specyfikacje wydajności, and application guidance presented in this article represent general characteristics of fluorescent fiber optic temperature monitoring systems for busbar applications. Actual system performance, configuration requirements, and operational results may vary based on specific installation conditions, czynniki środowiskowe, typy sprzętu, integration requirements, i praktyki operacyjne.
While Fuzhou Innovation Electronic Scie&Technologia Co., Ltd. strives to provide accurate and current information, we make no warranties, wyraźne lub dorozumiane, odnośnie kompletności, dokładność, niezawodność, or suitability of this content for any particular application or purpose. Specyfikacje produktu, cechy, certyfikaty, and availability are subject to change without prior notice as part of our continuous product development and improvement processes.
The case studies, przykłady zastosowań, and installation scenarios described are provided for illustrative purposes only and do not constitute performance guarantees for other installations or operating conditions. Customers should consult directly with our engineering team to confirm current specifications, obtain detailed technical data, and receive application-specific recommendations for their particular requirements.
Instalacja, działanie, konserwacja, and modification of electrical monitoring equipment must be performed exclusively by qualified personnel following applicable safety regulations, kody elektryczne, standardy branżowe, i wytyczne producenta. Fuzhou Innowacja Elektroniczna Scie&Technologia Co., Ltd. nie ponosi żadnej odpowiedzialności za szkody, urazy, straty, or consequences resulting from improper installation, misapplication, failure to follow recommended practices, unauthorized modifications, or use beyond published ratings and specifications.
All economic analyses, return on investment calculations, and cost comparisons presented represent illustrative examples based on typical scenarios and industry averages. Actual costs, korzyści, payback periods, and financial outcomes will vary significantly based on facility-specific factors, regional economics, operational practices, failure rates, and numerous other variables. Customers should perform independent financial analysis appropriate to their specific circumstances before making investment decisions.
Odniesienia do produktów stron trzecich, systemy, protokoły, standardy, or organizations are provided for informational purposes only and do not constitute endorsements, partnerstwa, or affiliations unless explicitly stated. Wszystkie znaki towarowe, nazwy produktów, company names, and logos mentioned remain the property of their respective owners.
Artykuł ten nie stanowi profesjonalnej porady inżynierskiej, and readers should consult with qualified electrical engineers, safety professionals, and regulatory authorities regarding specific project requirements, code compliance, i względy bezpieczeństwa. Projekt systemu, wybór sprzętu, and installation practices must consider site-specific conditions, applicable regulations, and professional engineering judgment.
Information regarding certifications, zgodność, and regulatory approvals reflects status at time of publication. Customers requiring specific certifications for particular jurisdictions or applications should verify current certification status directly with our technical team and request relevant documentation.
For authoritative technical information, current product specifications, application-specific recommendations, and professional engineering support, please contact Fuzhou Innovation Electronic Scie&Technologia Co., Ltd. directly through the communication channels provided in this article.

Światłowodowy czujnik temperatury, Inteligentny system monitorowania, Rozproszony producent światłowodów w Chinach
 |
 |
 |