 Penderia suhu gentian optik INNO ,sistem pemantauan suhu.
Alat Suis Bertebat Gas (GIS) has become the backbone of modern electrical power transmission and distribution networks worldwide. As critical infrastructure components operating at high voltages, peralatan GIS requires continuous monitoring to prevent catastrophic failures, ensure operational reliability, dan mengoptimumkan strategi penyelenggaraan. This comprehensive guide explores the GIS fault warning and monitoring system, covering detection technologies, sensor architectures, protokol komunikasi, and practical implementation strategies for utilities, power plant operators, dan kemudahan industri.
- Primary Application Scenarios: Extra-high voltage substations, urban distribution networks, kemudahan penjanaan kuasa, loji industri, offshore wind platforms, and railway electrification systems
- Kelebihan Teknikal Teras: Real-time condition assessment, pengesanan kerosakan awal, keupayaan penyelenggaraan ramalan, masa henti dikurangkan, enhanced safety protocols, and compliance with environmental regulations
- System Architecture Components: Multi-parameter sensor networks, intelligent data acquisition units, industrial communication infrastructure, centralized monitoring platforms, and automated alarm management systems
- Monitored Parameters: Aktiviti pelepasan separa, SF6 gas density and purity, pengagihan suhu, mechanical operating characteristics, kandungan lembapan, gas decomposition byproducts, dan keadaan persekitaran
- Communication and Data Infrastructure: IEC 61850 protocol implementation, Modbus RTU/TCP connectivity, fiber optic networks, industrial Ethernet backbone, wireless telemetry options, and cybersecurity frameworks
- Warning and Alert Functions: Multi-level alarm hierarchies, threshold-based notifications, trend analysis warnings, abnormal pattern recognition, mobile push notifications, and integration with SCADA systems
- Maintenance Benefits: Transition from time-based to condition-based maintenance, extended equipment lifespan, optimized inspection schedules, reduced operational costs, improved grid reliability, and comprehensive failure analysis databases
1. What is GIS (Alat Suis Bertebat Gas)
1.1 Basic Concepts and Operating Principles of GIS
Alat Suis Bertebat Gas (GIS) represents a compact high-voltage electrical substation technology where all primary switching and protection equipment are enclosed in sealed metal compartments filled with sulfur hexafluoride (SF6) gas. The SF6 insulating gas serves dual purposes: providing superior dielectric insulation strength approximately 2-3 times higher than air at atmospheric pressure, and acting as an arc-quenching medium during circuit breaker operations. Yang tipikal GIS assembly integrates circuit breakers, putuskan suis, grounding switches, transformer semasa, pengubah voltan, and busbars within a single metal-enclosed structure.
The operating principle relies on SF6 gas’s exceptional electrical properties. At pressures ranging from 0.4 kepada 0.6 MPa (4-6 bar), SF6 gas provides insulation equivalent to air at several times atmospheric pressure, enabling dramatic space reduction. The gas molecules possess excellent electron-capturing characteristics, rapidly neutralizing free electrons that could otherwise initiate electrical breakdown. semasa circuit breaker switching operations, the SF6 gas flow extinguishes the electrical arc through thermal and dielectric cooling processes, typically within milliseconds.
1.2 Development History of GIS Technology
Evolusi daripada teknologi GIS began in the 1960s when utilities faced increasing land costs and space constraints in urban areas. Early GIS installations operated at transmission voltages of 72.5 kV kepada 145 kV, primarily deployed in Japan and Europe. Throughout the 1970s-1980s, manufacturers expanded GIS capabilities to 245 kV, 420 kV, dan 550 kV voltage classes, incorporating improved SF6 gas handling systems and enhanced insulator designs.
The 1990s witnessed significant technological advancements including the introduction of ultra-high voltage (UHV) GIS rated at 800 kV dan 1100 kV for long-distance transmission projects in China, Jepun, and Russia. Modern fourth-generation GIS equipment features modular construction, integrated monitoring capabilities, environmentally-friendly designs with minimal SF6 gas emissions, and digital secondary systems compatible with IEC 61850 communication standards.
1.3 GIS vs Traditional Air-Insulated Switchgear (AIS) Perbandingan
| Comparison Parameter | GIS (Alat Suis Bertebat Gas) | AIS (Alat Suis Bertebat Udara) |
|---|---|---|
| Keperluan Ruang | lebih kurang 10-20% jejak AIS yang setara; typical 245kV bay requires 40-60 m² | Extensive outdoor area needed; typical 245kV bay requires 300-500 m² |
| Lokasi Pemasangan | Indoor or outdoor; ideal for underground substations, urban centers, platform luar pesisir | Primarily outdoor installations with adequate clearance distances |
| Medium Penebat | SF6 gas at 0.4-0.6 MPa pressure; superior dielectric strength | Atmospheric air; requires larger phase-to-phase and phase-to-ground clearances |
| Keperluan Penyelenggaraan | minima; sealed compartments prevent contamination; typical inspection intervals 5-10 tahun | Regular maintenance required; exposed equipment affected by weather, pencemaran, haiwan |
| Kebolehpercayaan dan Ketersediaan | Kebolehpercayaan yang tinggi (99.9%+); kadar kegagalan yang rendah; protected from environmental factors | Weather-dependent reliability; flashovers during contamination or severe weather |
| Pertimbangan Keselamatan | Keselamatan kakitangan dipertingkatkan; enclosed energized parts; reduced arc flash exposure | Higher safety risks; exposed high-voltage conductors; bird/animal intrusion hazards |
| Initial Capital Cost | Higher equipment cost; 1.5-2.5 times AIS equipment cost depending on voltage class | Lower equipment cost; higher civil works and land acquisition costs in urban areas |
| Lifecycle Costs | Lower total cost of ownership; penyelenggaraan berkurangan, higher reliability, smaller footprint | Higher lifecycle costs in most applications; frequent maintenance, larger land use |
| Kesan Alam Sekitar | Controlled SF6 emissions (potent greenhouse gas); modern designs minimize leakage to <0.5% setiap tahun | Minimal direct emissions; larger land disturbance; visual impact in landscapes |
| Seismic Performance | Excellent seismic withstand; compact rigid structure; suitable for high seismic zones | More vulnerable to seismic events; multiple support structures; longer conductors |
| Expansion Capability | Modular design allows controlled expansion; requires advance planning for additional bays | Easier horizontal expansion if land available; simpler to add equipment |
| Gangguan Elektromagnet | Metal enclosures provide electromagnetic shielding; reduced EMI emissions | Higher electromagnetic field levels; potential interference with nearby electronics |
1.4 GIS Voltage Class Classifications
Medium voltage GIS operates at 12 kV kepada 40.5 kV, commonly deployed in industrial facilities, bangunan komersial, and distribution substations. High voltage GIS ranges from 72.5 kV kepada 170 kV for regional transmission networks. Extra-high voltage (EHV) GIS spans 245 kV kepada 550 kV for bulk power transmission. Ultra-high voltage (UHV) GIS di 800 kV dan 1100 kV represents the pinnacle of current technology, utilized in China’s national transmission grid and select international projects requiring long-distance, high-capacity power delivery with minimal losses.
2. Primary Application Fields for GIS Equipment
2.1 Extra-High Voltage and Ultra-High Voltage Substations
EHV and UHV transmission substations represent the most demanding application environment for GIS technology. At voltage levels of 245 kV, 420 kV, 550 kV, 800 kV, dan 1100 kV, GIS installations form the critical switching infrastructure for national and regional power grids. These substations typically feature multiple transformer bays, extensive bus configurations (double-bus, ring-bus, or breaker-and-a-half arrangements), and sophisticated protection schemes.
The sistem pemantauan GIS in EHV/UHV applications must address unique challenges including higher insulation stress levels, more severe consequences of equipment failure, and extended maintenance intervals due to accessibility constraints. Monitoring equipment specifications require enhanced sensitivity for partial discharge detection, high-precision SF6 density measurement with temperature compensation, and comprehensive mechanical diagnostics to detect subtle degradation in circuit breaker operating mechanisms before catastrophic failure occurs.
2.2 Urban Center Distribution Substations
Metropolitan areas face severe land constraints, membuat compact GIS substations the preferred solution for 72.5 kV kepada 145 kV distribution networks. These installations frequently occupy underground locations beneath parks, commercial developments, or transportation infrastructure. The indoor GIS configuration eliminates minimum clearance distance requirements, enables multi-story vertical construction, and provides weather-independent operation.
Urban GIS installations benefit significantly from sistem pemantauan dalam talian because scheduled maintenance windows are difficult to obtain in networks serving critical loads such as hospitals, pusat data, financial districts, and mass transit systems. Real-time monitoring enables condition-based maintenance strategies that maximize equipment availability while ensuring public safety in densely populated areas.
2.3 Power Generation Plant Switchyards
Peningkatan penjana (GSU) transformers and switchyard GIS at thermal, nuklear, hydroelectric, and renewable energy power plants handle the transition from generator voltage levels (biasanya 13.8-24 kV) to transmission voltages. These installations experience frequent switching operations during unit startup, synchronization, and shutdown sequences, plus continuous operation during steady-state generation.
The GIS monitoring requirements at generation facilities emphasize mechanical wear tracking on circuit breakers and disconnect switches, temperature monitoring of high-current connections, and SF6 gas quality assessment. Many plants implement integrated monitoring systems that correlate GIS performance data with generator operating parameters, transformer loading, and grid dispatch instructions to optimize maintenance scheduling around planned outages.
2.4 Industrial Power Distribution Systems
Large industrial complexes including steel mills, petrochemical refineries, cement plants, mining operations, and manufacturing facilities deploy medium-voltage GIS (12-40.5 kV) for incoming utility feeds, on-site generation interconnections, and critical process load distribution. The compact footprint suits plant environments where production floor space carries high economic value.
Industrial GIS monitoring systems berintegrasi dengan sistem kawalan teragih loji (DCS) and manufacturing execution systems (MES) to coordinate electrical switching with production processes. Monitoring priorities include rapid fault detection to minimize production disruptions, contamination prevention in clean manufacturing environments, and safety compliance in hazardous areas where explosive atmospheres may exist.
3. Common GIS Failure Modes and Mechanisms
3.1 Insulation Failure Categories
3.1.1 Partial Discharge Degradation
Pelepasan separa (PD) activity represents localized electrical discharges that partially bridge the insulation between conductors without causing complete breakdown. PD occurs at defect sites including sharp metallic protrusions, free conducting particles, insulator surface contamination, or gas voids in solid insulation. Each discharge event deposits energy that gradually erodes insulating materials through electrochemical processes and thermal effects.
The PD degradation mechanism accelerates over time as initial micro-damage creates increasingly favorable conditions for discharge activity. Common PD sources in GIS include manufacturing defects (metal particles left during assembly), installation problems (contamination introduced during commissioning), and operational stress (mechanical vibration loosening internal components). UHF partial discharge monitoring detects these defects years before they progress to complete insulation failure, enabling planned interventions during scheduled outages rather than forced emergency repairs.
3.1.2 SF6 Gas Decomposition Effects
During electrical discharge events or thermal faults, SF6 gas decomposes into various byproducts including sulfur tetrafluoride (SF4), sulfur dioxide (SO2), thionyl fluoride (SOF2), and sulfuryl fluoride (SO2F2). These compounds react with trace moisture to form hydrofluoric acid (HF) and other corrosive substances that attack insulator surfaces, komponen logam, and sealant materials.
The presence of Produk penguraian SF6 indicates active or recent discharge activity. Monitoring systems detect these gases at parts-per-million concentrations, providing chemical evidence of insulation problems that may not yet produce detectable partial discharges under normal operating voltage. Gas analysis complements electrical PD detection methods, offering convergent evidence for diagnostic decision-making.
3.2 Kegagalan Mekanikal
3.2.1 Operating Mechanism Malfunctions
Mekanisme operasi pemutus litar employ spring-charged energy storage, sistem hidraulik, or pneumatic actuators to drive the moving contacts during opening and closing operations. Mechanical failures occur due to lubrication degradation, spring fatigue, seal leakage in hydraulic/pneumatic systems, linkage wear, or control valve malfunctions.
Symptoms of mechanism degradation include increasing operating times, reduced contact travel velocity, incomplete stroke completion, and excessive operating energy consumption. Mechanical monitoring systems track travel-time curves, measure operating coil currents, and analyze vibration signatures to identify developing problems before they cause breaker failure to operate (FTO) or failure to trip (FTT) events during critical switching operations.
3.2.2 Contact Wear and Erosion
Arcing contacts in GIS circuit breakers experience material erosion during each switching operation due to the high-energy electrical arc that forms when contacts separate under load. Contact materials (typically copper-tungsten or other refractory metal alloys) gradually vaporize and deposit on insulator surfaces, potentially creating conducting paths.
The contact erosion rate depends on switched current magnitude, total number of operations, circuit power factor, and switching duty cycle. Monitoring systems track cumulative operations and switched ampere-hours to estimate remaining contact life. Temperature monitoring detects abnormal heating from increased contact resistance as erosion progresses, enabling proactive contact replacement during planned maintenance.
3.3 SF6 Gas Leakage
SF6 gas leakage reduces insulation strength and interrupting capability, potentially leading to equipment failure if gas density falls below minimum operating thresholds. Leak sources include seal degradation at bolted flanges, gasket compression set over time, micro-cracks in welds or castings, valve stem packing wear, and corrosion-induced pitting of metal enclosures.
moden GIS leak rate specifications typically mandate less than 0.5% annual leakage per sealed compartment. Online gas density monitoring systems continuously track pressure and temperature, calculating real-time density values and detecting leaks within days rather than waiting months between manual inspections. Environmental SF6 concentration sensors detect major leaks immediately, activating ventilation systems and personnel alarms to prevent asphyxiation hazards in confined GIS rooms.
3.4 Overheating Failures
Thermal faults in GIS originate from high-resistance connections at bolted joints, inadequate contact pressure at sliding contacts, eddy current heating in enclosures, or localized insulation degradation. Unlike air-insulated equipment where visual inspection reveals discolored connections, GIS thermal problems develop hidden inside sealed compartments.
Sistem pemantauan suhu using fiber optic sensors or wireless temperature transmitters installed on critical connection points detect temperature rise trends before permanent damage occurs. Advanced installations employ distributed temperature sensing fiber optic cables that provide continuous temperature profiles along busbars and across multiple connection points, identifying hotspots with meter-level spatial resolution.
4. GIS Equipment Components and Structure
4.1 Primary Electrical Equipment
4.1.1 Circuit Breaker Units
pemutus litar GIS employ puffer-type or self-blast arc interruption mechanisms utilizing SF6 gas flow to extinguish switching arcs. The puffer breaker design uses a mechanically-driven piston to compress SF6 gas during opening operations, directing high-velocity gas flow across the separating contacts to cool and de-ionize the arc column. Self-blast breakers utilize arc energy itself to heat and pressurize SF6 gas in a heating volume, creating pressure differentials that drive gas flow through the arc region.
moden dead-tank GIS breakers enclose all live parts within grounded metal enclosures, enhancing safety and enabling close proximity to adjacent equipment. The interrupter unit contains the moving and fixed contacts, arc control nozzles, and insulating nozzles that shape the gas flow pattern. Monitoring requirements focus on mechanical travel characteristics, operating energy consumption, rintangan sentuhan, and partial discharge detection in the interrupter region.
4.1.2 Disconnect and Selector Switches
Disconnect switches (pengasing) in GIS provide visible isolation points when maintenance work requires de-energizing specific equipment. Unlike circuit breakers, disconnect switches cannot interrupt load current or fault current; they operate only after circuit breakers have interrupted current and created a current-zero condition. The three-position disconnect switch design common in ring-bus configurations enables selection between alternative circuit paths.
Motor-operated disconnect switches employ electric motors with gear reduction mechanisms to drive the moving contacts through their travel. Sistem pemantauan track motor current profiles during operation to detect mechanical binding, masalah pelinciran, or limit switch misalignment. Position indication sensors verify full open, perantaraan, or full closed positions, with interlocking circuits preventing unsafe operating sequences.
4.1.3 Sistem Bar Bas
GIS busbars comprise aluminum or copper tubular conductors encased in grounded metal enclosures, forming the main and transfer bus configurations. The three-phase separate-enclosure design isolates each phase conductor in its own gas compartment, preventing multi-phase faults and enabling independent maintenance. Common-enclosure designs house all three phases within a single large-diameter enclosure, offering space savings at the cost of reduced fault isolation.
Busbar monitoring emphasizes penderiaan suhu at expansion joints, bolted connections, and current transformer mounting points where contact resistance may increase over time. Penderia nyahcas separa mounted on busbar enclosures detect PD activity from particles or protrusions on the conductor surface or enclosure interior.
4.2 Insulation Systems
The GIS insulation system combines SF6 gas insulation with solid insulator supports. Post insulators made from cast epoxy resin or porcelain support high-voltage conductors within the grounded metal enclosure. These insulators withstand both continuous operating voltage stress and transient overvoltages from switching operations or lightning impulses.
Insulator surface condition critically affects GIS reliability. Contamination from metal particles, condensed moisture, or SF6 decomposition products reduces insulator flashover voltage. Penderia UHF mounted near major insulators detect partial discharges occurring on insulator surfaces, sementara pemantauan kelembapan prevents water condensation that could create conducting films on insulator surfaces during temperature fluctuations.
4.3 Operating Mechanisms
Spring-charged mechanisms represent the most common operating mechanism type for GIS circuit breakers. Motors charge powerful compression or torsion springs over several seconds, storing energy for release during breaker closing operations. The stored energy drives contacts closed rapidly (biasanya 60-100 milliseconds total operating time), then re-compresses opening springs that will drive the subsequent opening operation.
Hydraulic mechanisms used in high-voltage and UHV breakers employ hydraulic pumps to maintain pressure in accumulators. Pressure energy releases through control valves to drive hydraulic cylinders connected to the interrupter moving contacts. Sistem pemantauan track hydraulic pressure levels, pump motor duty cycles, and control valve operation to detect seal leakage, pencemaran minyak, or valve sticking before mechanism failure occurs.
4.4 Gas Handling Systems
The SF6 gas system includes gas storage cylinders, vacuum pumps for evacuation during commissioning, gas filling manifolds with pressure regulation, moisture filters to remove water vapor, and transfer lines connecting storage to GIS compartments. Gas quality specifications mandate moisture content below 150 parts per million by volume (ppmv) and oxygen content below 100 ppmv to prevent insulator tracking and internal corrosion.
Online gas monitoring continuously measures SF6 density (mass per unit volume) which determines both dielectric strength and interrupting capacity. Temperature compensation circuits correct pressure readings to calculate true density independent of ambient temperature variations. Gas purity sensors detect air contamination from seal leakage, sementara penderia kelembapan track water vapor concentration to prevent condensation during cold weather.
5. GIS Monitoring System Architecture and Components
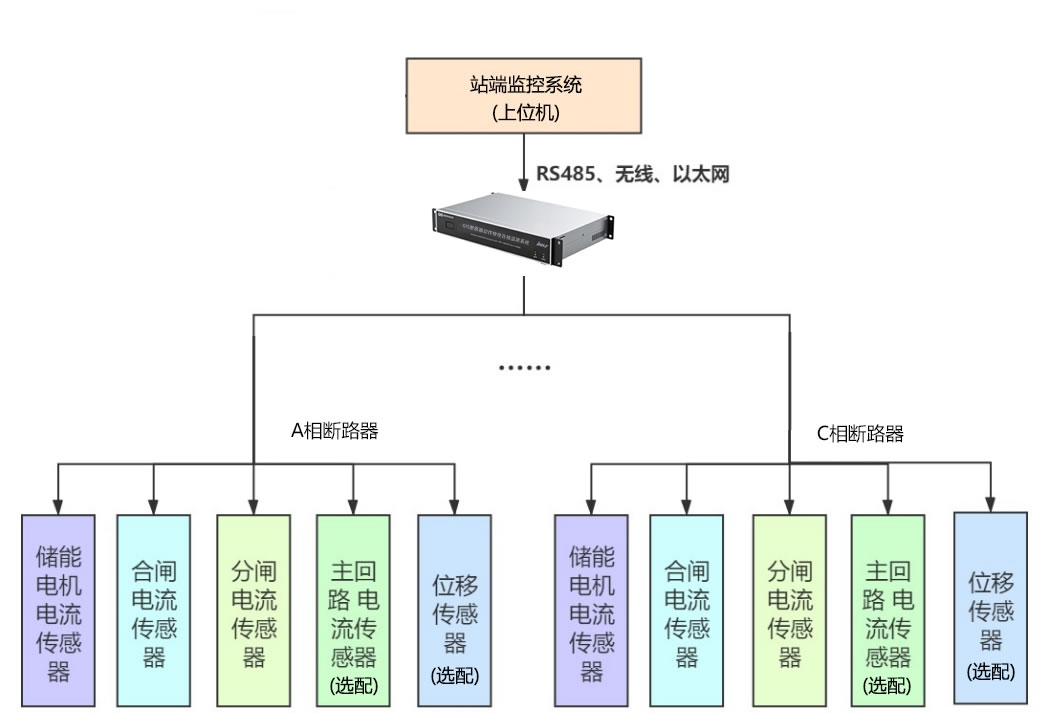
5.1 Overall System Architecture
Yang menyeluruh GIS condition monitoring system employs a hierarchical architecture comprising sensor networks, intelligent acquisition units, infrastruktur komunikasi, and centralized analysis platforms. The sensor layer distributes specialized transducers throughout the GIS installation to measure electrical, mekanikal, kimia, and thermal parameters. The edge processing layer hosts intelligent electronic devices (IED) that digitize sensor signals, perform local analysis, and communicate upward via industrial protocols.
The communication layer implements fiber optic networks, industrial Ethernet switches, or wireless telemetry to aggregate data from distributed IEDs to substation automation systems and enterprise monitoring centers. The application layer provides human-machine interfaces, diagnostic algorithms, pengurusan penggera, trend sejarah, and integration with asset management databases. This architecture enables both real-time monitoring for immediate fault detection and long-term analysis for predictive maintenance planning.
5.2 Sensor Technology Categories
5.2.1 Partial Discharge Sensors
Frekuensi ultra tinggi (UHF) antena detect electromagnetic radiation emitted during partial discharge events. These sensors mount to dielectric windows installed in GIS enclosures or couple to gas-insulated coaxial monitoring ports. The UHF detection bandwidth typically spans 300 MHz kepada 3 GHz, capturing transient signals with rise times in the nanosecond range while rejecting low-frequency electromagnetic interference from power system operations.
Penderia pelepasan akustik respond to ultrasonic pressure waves generated by PD events propagating through SF6 gas and GIS structures. Piezoelectric transducers mounted on external enclosure surfaces detect these mechanical vibrations in the 20-300 kHz frequency range. The multi-sensor array approach enables triangulation algorithms to locate PD sources along busbar runs or within complex bay configurations by measuring time-of-arrival differences between sensors.
5.2.2 Temperature Sensing Devices
Penderia suhu gentian optik utilizing fluorescence decay principles provide immunity to electromagnetic interference, electrical isolation from high-voltage conductors, and suitability for direct mounting on energized components. The fluorescent crystal sensor embedded in the fiber tip emits light when excited by an optical pulse, with decay time temperature-dependent. Measurement electronics analyze this decay characteristic to calculate temperature with ±1°C accuracy.
Wireless battery-powered temperature transmitters mount directly on high-voltage conductors, measuring local temperature and transmitting data via radio frequency signals through the grounded enclosure. Power harvesting from the magnetic field surrounding current-carrying conductors enables decades-long operation without battery replacement, sementara antenna coupling techniques allow signal transmission through small apertures in the grounded enclosure.
5.2.3 SF6 Gas Monitoring Instruments
Online density monitors incorporate pressure transducers and temperature sensors with microprocessor-based calculation to provide continuous SF6 density measurement. The density algorithm applies real gas equations of state rather than ideal gas assumptions, achieving accuracy within ±1% across wide temperature ranges. Integrated data logging captures density trends, leak rate calculations, and alarm event time-stamps.
Gas quality analyzers employ multiple sensing technologies to assess SF6 purity and contamination. Penderia oksigen using galvanic cell or zirconium oxide technologies detect air ingress. Penderia kelembapan based on capacitance or aluminum oxide impedance measurement track water vapor concentration. Decomposition product sensors utilize electrochemical cells or infrared absorption spectroscopy to quantify SOF2, SO2F2, and other breakdown byproducts at parts-per-million sensitivity.
5.2.4 Mechanical Characteristic Sensors
Transduser anjakan linear employing magnetostrictive or optical encoding principles measure circuit breaker contact travel with sub-millimeter resolution. The travel-time recorder captures complete stroke profiles during opening and closing operations, enabling calculation of average velocity, maximum velocity, contact acceleration, and stroke consistency between phases.
Vibration accelerometers mounted on operating mechanisms detect mechanical signatures associated with specific mechanism components. Frequency spectrum analysis identifies characteristic frequencies of gear meshing, pawl engagement, buffer impacts, and bearing resonances. Changes in vibration patterns indicate developing mechanical faults such as lubrication breakdown, spring fatigue, or linkage wear long before these conditions cause operational failures.
5.3 Data Acquisition and Processing Infrastructure
Intelligent electronic devices (IED) serve as the edge computing nodes in GIS monitoring systems. Each IED interfaces with multiple sensors, providing analog-to-digital conversion, digital signal processing, threshold comparison, dan rakaman acara. The IED processor executes diagnostic algorithms locally, reducing communication bandwidth requirements by transmitting only processed diagnostic results and alarm notifications rather than continuous raw sensor data streams.
High-speed data acquisition modules for partial discharge monitoring employ sampling rates of 100 MS/s kepada 1 GS/s (mega-samples per second to giga-samples per second), capturing UHF transient waveforms with sufficient fidelity for pulse shape analysis and phase-resolved pattern recognition. Waveform analysis algorithms extract parameters including pulse amplitude, rise time, kadar pengulangan, and phase relationship to the power frequency voltage cycle, building pattern databases for PD source classification.
5.4 Komunikasi dan Seni Bina Rangkaian
The substation communication network typically implements a redundant fiber optic ring topology connecting monitoring IEDs to substation gateway servers. Station-level switches provide Gigabit Ethernet connectivity with IEEE 1588 Precision Time Protocol (PTP) synchronization ensuring microsecond-level time alignment across distributed sensors. This time synchronization enables accurate sequence-of-events recording and traveling wave fault location.
Protocol conversion gateways translate between monitoring system native protocols (often Modbus TCP or proprietary formats) and substation automation standard IEC 61850, enabling integration with protective relaying, sistem SCADA, and utility enterprise networks. The communication security architecture implements VLANs to segregate monitoring traffic from protection and control networks, firewall rules to control data flows, and encrypted tunnels for wide-area communications to centralized monitoring centers.
6. Core Advantages of GIS Monitoring Systems
6.1 Peralihan daripada Penyelenggaraan Berasaskan Masa kepada Berasaskan Keadaan
Tradisional time-based maintenance strategies schedule GIS inspections and component replacements at fixed calendar intervals (cth., 5-year major inspections, 10-year overhauls) regardless of actual equipment condition. This approach results in unnecessary maintenance on healthy equipment and potential failures of degraded equipment between scheduled interventions. Penyelenggaraan berasaskan keadaan (CBM) enabled by continuous monitoring shifts this paradigm by performing maintenance actions based on actual measured condition rather than elapsed time.
The CBM implementation monitors degradation trends, comparing real-time parameters against baseline values and threshold limits. Maintenance activities trigger when monitored conditions indicate developing problems, optimizing maintenance timing to prevent failures while avoiding premature component replacement. This approach extends equipment service life, reduces maintenance costs, and improves grid reliability by addressing actual rather than assumed degradation.
6.2 Early Fault Warning Capabilities
Progressive fault development in GIS typically follows detectable stages before catastrophic failure. Partial discharge activity increases gradually over months or years as insulation degrades. Contact resistance rises incrementally as erosion accumulates. Mechanical wear produces subtle changes in operating characteristics long before complete mechanism failure. Sistem pemantauan dalam talian detect these early warning signs, providing maintenance windows measured in weeks or months rather than hours or minutes.
The early detection advantage enables planned outage scheduling during low-demand periods, procurement of necessary spare parts, mobilization of specialized maintenance crews, and preparation of temporary supply arrangements to maintain service to critical customers. This contrasts sharply with emergency response to unexpected failures requiring immediate forced outages, often during peak demand periods with limited spare parts availability and inadequate preparation time.
6.3 Equipment Service Life Extension
GIS design life typically ranges from 30 kepada 40 years under normal operating conditions with appropriate maintenance. Namun begitu, actual service life depends heavily on operating stress levels, keadaan persekitaran, and maintenance quality. Monitoring systems extend service life by detecting conditions that accelerate aging (terlalu panas, pencemaran lembapan, excessive PD activity) while they remain correctable through minor interventions such as re-torquing connections, gas processing, or localized cleaning.
The life extension methodology combines continuous condition assessment with targeted remedial actions, preventing minor degradation from progressing to major failures requiring complete component replacement. Statistical analysis of monitoring data from large equipment populations enables refinement of maintenance procedures, identification of design vulnerabilities requiring manufacturer feedback, and optimization of spare parts inventory based on actual rather than theoretical failure rates.
6.4 Power Supply Reliability Enhancement
Grid reliability metrics including System Average Interruption Duration Index (SAIDI) and System Average Interruption Frequency Index (SAIFI) improve measurably when utilities implement comprehensive GIS monitoring. Forced outage reduction results from early detection and planned correction of developing faults. The monitoring system’s contribution to reliability becomes particularly significant in applications serving critical infrastructure such as hospitals, pusat data, emergency services, and mass transportation systems.
Operational flexibility increases as monitoring provides real-time equipment health visibility, enabling confident loading to design limits rather than conservative operation with excessive safety margins. During contingency conditions (forced outages elsewhere in the network), monitoring confirms that temporary overload conditions remain within acceptable thermal and electrical stress levels, maximizing transmission capacity utilization during emergencies.
6.5 Historical Data Analysis and Diagnostic Insights
Long-term trending analysis of monitoring data reveals degradation patterns invisible in snapshot measurements. Gradual increases in partial discharge magnitude, progressive moisture accumulation, or slowly rising connection temperatures become apparent only when examining months or years of historical data. Database analytics correlate equipment condition with operating history (memuatkan profil, switching frequency, keadaan persekitaran) to identify causal relationships and refine predictive models.
The fleet-wide analysis capability aggregates data from multiple similar GIS installations across a utility’s service territory or an equipment manufacturer’s global installed base. Statistical methods identify outliers requiring investigation, establish realistic performance benchmarks, and quantify the impact of design modifications or maintenance procedure changes. This collective intelligence accelerates learning and continuous improvement far beyond what individual site analysis could achieve.
7. Partial Discharge Detection Technologies Comparison
| Detection Technology | Prinsip Operasi | Sensitivity Level | Localization Capability | Noise Immunity | Aplikasi Biasa |
|---|---|---|---|---|---|
| Frekuensi Ultra Tinggi (UHF) | Mengesan sinaran elektromagnet (300 MHz – 3 GHz) emitted during PD events using antennas coupled to GIS enclosures | Cemerlang: detects PD <5 pC in favorable conditions; typical threshold 10-20 pC | Sangat Baik: time-of-flight triangulation with multiple sensors locates sources within ±1-2 meters | Cemerlang: high-frequency operation rejects power frequency interference and radio broadcasts | Primary method for GIS; suitable for online continuous monitoring; effective in electrically noisy environments |
| Pelepasan Akustik (AE) | Detects ultrasonic pressure waves (20-300 kHz) generated by PD events using piezoelectric sensors on external surfaces | bagus: detects moderate to severe PD (biasanya >50 pC); sensitivity degrades with distance from source | bagus: triangulation possible with sensor arrays; accuracy ±5-10 meters depending on GIS structure complexity | Sederhana: sensitive to mechanical vibration, pump noise, transformer hum; digital filtering required | Complementary to UHF; effective for localizing known defects; useful during commissioning inspections |
| Voltan Bumi Sementara (TEV) | Measures voltage pulses on external GIS enclosure surfaces caused by capacitive coupling from internal PD events | Sederhana: detects significant PD activity (biasanya >100 pC); sensitivity varies with enclosure geometry | Terhad: indicates which enclosure section contains PD; precise location requires walking survey with handheld sensor | Sederhana: susceptible to external electromagnetic interference; shielding and filtering improve performance | Portable survey instruments for periodic inspection; quick screening to identify problematic bays requiring detailed investigation |
| Chemical Detection (Analisis Gas) | Analyzes SF6 decomposition products (SOF2, SO2F2, dll.) using gas chromatography or electrochemical sensors | Excellent for chemical byproducts: detects ppm-level decomposition products indicating sustained discharge activity | miskin: gas samples represent entire sealed compartment; cannot pinpoint discharge location within compartment | Cemerlang: immune to electrical noise; chemical analysis provides definitive evidence of discharge or thermal fault | Periodic sampling during maintenance outages; online sensors for critical installations; confirms electrical PD detection findings |
| Pengubah Arus Frekuensi Tinggi (HFCT) | Measures high-frequency current pulses in GIS grounding conductors using Rogowski coils or current transformers | Moderate to Good: detects PD >20-50 pC depending on sensor position and grounding configuration | Terhad: identifies which grounding conductor carries PD signals; multiple sensors improve zone identification | bagus: bandpass filtering (3-30 MHz typical) rejects power frequency and many interference sources | Retrofit applications where enclosure penetration for UHF sensors is impractical; monitors grounding circuit integrity |
7.1 Frekuensi Ultra Tinggi (UHF) Kaedah Pengesanan
7.1.1 UHF Operating Principles and Signal Characteristics
UHF partial discharge detection exploits the fact that rapid charge movement during PD events generates electromagnetic radiation with frequency content extending into the UHF spectrum (300 MHz kepada 3 GHz). The PD current pulse has extremely fast rise time (biasanya <1 nanosecond), producing a broadband electromagnetic spectrum. GIS metal enclosures act as waveguides, propagating these UHF signals along the structure with relatively low attenuation compared to lower frequencies.
The Sensor UHF consists of an antenna element coupled to the SF6 gas space through a dielectric window or specialized monitoring port in the GIS enclosure. Commercial sensor designs include internal disk antennas installed through standard GIS viewing ports, external patch antennas coupled through dielectric spacers, and integrated sensors built into insulator supports. The signal processing chain amplifies the received UHF signal, applies bandpass filtering to optimize signal-to-noise ratio, and digitizes waveforms for subsequent analysis.
7.1.2 UHF Sensor Types and Installation Methods
Internal UHF sensors provide optimal coupling to PD sources because the antenna resides within the SF6 gas environment where discharge events occur. Installation requires access to GIS compartments through existing inspection ports or custom-designed monitoring windows. The dielectric window material (typically cast epoxy or fiberglass) allows electromagnetic wave transmission while maintaining pressure containment and insulation integrity.
External UHF sensors mount on the outside of GIS enclosures, detecting electromagnetic fields that penetrate through small apertures, insulator interfaces, or directly through thin enclosure sections. This installation method suits retrofit applications where internal access is unavailable or where maintaining gas compartment integrity during sensor installation is critical. Coupling efficiency for external sensors is lower than internal mounting but remains adequate for detecting significant PD activity, particularly when multiple sensors provide spatial diversity.
7.2 Acoustic Emission Detection Methodology
Acoustic PD detection relies on piezoelectric sensors to detect ultrasonic pressure waves generated when electrical discharge events create rapid local gas pressure changes. The acoustic wave propagation through SF6 gas and GIS mechanical structures follows complex paths with reflections, mode conversions, and attenuation that vary with frequency and distance.
Pemasangan sensor typically employs magnetic mounting bases attached to external GIS enclosure surfaces. Acoustic coupling medium (gel or grease) ensures efficient sound transmission from the metal surface to the piezoelectric crystal. Multi-sensor arrays distributed along GIS bays enable triangulation algorithms that calculate PD source locations by analyzing arrival time differences. Modern acoustic systems employ at least 4-6 sensors per bay to achieve reliable 3D localization even with the complex acoustic environment inside GIS structures.
7.3 Voltan Bumi Sementara (TEV) Technique
TEV detection measures voltage pulses appearing on the external surface of grounded GIS enclosures due to capacitive coupling from internal partial discharge events. Each PD pulse induces a transient voltage between the enclosure surface and true earth ground, typically in the range of millivolts to volts depending on discharge magnitude and measurement location.
The TEV sensor comprises a capacitive coupling electrode, high-input impedance amplifier, and bandpass filter optimized for the typical TEV frequency range of 3-100 MHz. Portable TEV instruments enable walk-through surveys where operators systematically touch the sensor probe to GIS enclosure surfaces, noting locations with elevated TEV signal levels. Ini “tempat panas” identify compartments requiring more detailed investigation with UHF or acoustic sensors to precisely locate the PD source.
7.4 Chemical Detection Method (Gas Decomposition Analysis)
SF6 gas decomposition analysis provides chemical evidence of partial discharge or thermal fault activity. The decomposition mechanism involves SF6 molecule breakdown in the high-energy discharge channel, forming reactive fluorine radicals that recombine into stable byproducts. Key decomposition products include sulfur tetrafluoride (SF4), thionyl fluoride (SOF2), sulfuryl fluoride (SO2F2), and ultimately sulfur dioxide (SO2) and hydrofluoric acid (HF) when moisture is present.
Gas sampling procedures extract SF6 samples from sealed GIS compartments using sample cylinders connected to gas valves. Laboratory analysis employs gas chromatography with thermal conductivity or mass spectrometer detectors, achieving detection limits in the parts-per-million range. Online gas monitors for critical GIS installations incorporate miniature gas chromatographs or electrochemical sensor arrays that perform automated analysis at programmed intervals (typically daily or weekly), trending decomposition product concentrations over time to detect developing faults.
8. SF6 Gas Monitoring Technologies
8.1 SF6 Gas Density and Pressure Monitoring
8.1.1 Density Relay vs Online Monitoring System Comparison
| Comparison Aspect | Traditional Density Relay | Online Density Monitoring System |
|---|---|---|
| Prinsip Operasi | Bimetallic temperature compensation with mechanical contacts; measures pressure and corrects for temperature using thermal expansion properties | Electronic pressure sensor with RTD temperature sensor; microprocessor calculates density using real gas equations; digital output via communication protocol |
| Ketepatan Pengukuran | ±2-3% of full scale; affected by mechanical hysteresis and aging; calibration drift over time reduces accuracy | ±0.5-1% of reading; digital calibration eliminates mechanical drift; self-diagnostic functions verify sensor health |
| Temperature Compensation Range | Limited to design range (typically -25°C to +55°C); accuracy degrades outside this range; single compensation curve may not suit all climates | Julat yang luas (-50°C to +70°C typical); mathematical compensation adapts to any temperature; altitude compensation available for high-elevation sites |
| Alarm Functionality | Discrete alarm contacts at fixed density thresholds (typically one alarm, one lockout); thresholds not field-adjustable without replacement | Multiple programmable alarm levels; trending alarms based on leak rate calculation; remote threshold adjustment via communication interface |
| Data Logging and Trending | tiada – provides only instantaneous contact status; historical trends require manual recording during inspections | Comprehensive data logging with timestamped pressure, suhu, calculated density; leak rate trending; event recording for alarms |
| Remote Monitoring Integration | Contact status only via hard-wired connections to RTU or relay panels; no diagnostic information available remotely | Full integration via Modbus, IEC 61850, or other protocols; provides measured values, diagnostic status, calibration data to SCADA and monitoring systems |
| Keperluan Penyelenggaraan | Periodic recalibration recommended every 5-10 tahun; mechanical wear affects reliability; contact oxidation can cause false alarms | Self-calibrating electronics require minimal maintenance; sensor drift monitoring alerts when recalibration needed; no mechanical wear components |
| Leak Detection Capability | Detects only gross leaks causing density to fall below alarm threshold; provides no leak rate information; slow leaks may go undetected between inspections | Calculates hourly/daily leak rates from density trend analysis; detects slow leaks (0.1% setiap tahun) within days; predicts time to alarm threshold |
| Fleksibiliti Pemasangan | Direct mounting to GIS compartment required; limited options for remote indication; long capillary connections reduce accuracy | Sensors can mount directly on compartment or connect via short capillary; electronic signals transmit long distances without degradation |
| Pertimbangan Kos | Lower initial equipment cost; higher lifecycle cost due to maintenance needs and limited diagnostic capability leading to conservative gas top-up practices | Pelaburan permulaan yang lebih tinggi; lower lifecycle cost through reduced maintenance, optimized gas management, and prevention of equipment failures from undetected leaks |
8.1.2 Teknik Pampasan Suhu
Temperature compensation necessity arises because SF6 gas density (mass per unit volume) remains constant as temperature changes, but pressure varies significantly. At constant mass, an SF6 compartment experiences pressure changes of approximately 0.3-0.5% per degree Celsius. Without temperature compensation, a 30°C temperature swing would cause 9-15% pressure variation despite unchanged gas quantity.
moden sistem pemantauan dalam talian employ digital compensation algorithms implementing the real gas equation of state rather than simplified ideal gas law. The algorithm accounts for SF6’s compressibility factor variation with temperature and pressure, achieving density calculation accuracy within ±0.5% across the full operating temperature range. Multiple temperature sensors at different locations on large compartments detect temperature gradients, using averaged values to improve calculation accuracy.
8.2 SF6 Gas Leakage Detection Systems
8.2.1 Infrared SF6 Detection Technology
Infrared SF6 leak detectors exploit the gas’s strong infrared absorption at specific wavelengths, particularly around 10.6 micrometers. Portable infrared detectors employ a pump to draw air samples across an infrared source and detector, measuring absorption to quantify SF6 concentration. These instruments achieve sensitivity levels of 1-10 bahagian per juta (ppm), suitable for locating leak sources during manual surveys of GIS installations.
Fixed infrared monitors installed in GIS rooms provide continuous ambient SF6 concentration monitoring. The detection principle uses non-dispersive infrared (NDIR) technology with reference and measurement cells to compensate for light source aging and optical window contamination. Typical alarm thresholds include 500 ppm for ventilation activation and 1000 ppm for personnel evacuation, well below the asphyxiation risk level but indicating significant leakage requiring investigation.
8.2.2 Laser-Based SF6 Detection Methods
Tunable diode laser absorption spectroscopy (TDLAS) represents the most sensitive SF6 detection technology, achieving parts-per-billion sensitivity in laboratory conditions and sub-ppm sensitivity in field applications. The TDLAS system employs a semiconductor laser tuned to a specific SF6 absorption line, measuring absorption along an open optical path to detect SF6 plumes emanating from leak sources.
Laser scanning applications include both handheld devices for leak survey work and fixed installations providing perimeter monitoring of GIS rooms or outdoor GIS installations. The open-path configuration eliminates sampling pumps and consumable filters, enabling very long service intervals. Advanced systems incorporate GPS and imaging capabilities to create visual maps showing leak locations overlaid on facility drawings or photographs.
8.3 SF6 Gas Purity Monitoring
SF6 purity specifications for new gas typically require ≥99.9% SF6 by volume, with strict limits on air (<0.05%), CF4 (<0.05%), lembapan (<15 ppmv), and mineral oil (<1 mg/L). Gas purity degradation occurs through seal leakage admitting air, contamination during maintenance when compartments are opened, or chemical reactions with materials inside the GIS.
Online purity monitoring employs multiple sensor technologies. Penderia oksigen using galvanic cell or zirconium oxide technologies detect air ingress, which simultaneously indicates compromised pressure containment. Dielectric strength monitors measure the voltage withstand capability of gas samples, providing a functional assessment of insulation performance that integrates the effects of all contamination types. Significant purity reduction triggers gas processing procedures including evacuation, penapisan, and re-filling with fresh SF6 to restore specifications.
8.4 SF6 Gas Moisture Content Monitoring
Moisture contamination in SF6 gas creates multiple problems: reduced dielectric strength when water vapor condenses on cold insulator surfaces, accelerated insulator degradation through surface tracking, and corrosive byproduct formation when moisture reacts with SF6 decomposition products to generate hydrofluoric acid (HF).
Online moisture monitors commonly use aluminum oxide sensor technology. The sensor element comprises a thin porous aluminum oxide layer deposited on a conductive substrate, with a gold electrode coating. Water molecules adsorb into the aluminum oxide pores, changing the electrical capacitance or resistance in proportion to moisture content. These sensors provide continuous measurement from <10 ppmv to >1000 ppmv moisture concentration, with alarm thresholds typically set at 150-200 ppmv to prevent condensation under worst-case low temperature conditions.
8.5 SF6 Decomposition Product Monitoring
8.5.1 Key Decomposition Products and Their Significance
Sulfur tetrafluoride (SF4) forms as the primary decomposition product during partial discharge and arcing events. SF4 rapidly hydrolyzes in the presence of moisture, producing SOF2 and HF. Thionyl fluoride (SOF2) dan sulfuryl fluoride (SO2F2) represent the major stable decomposition products detectable in used SF6 gas. Concentrations above 10-20 ppm indicate sustained discharge activity or a recent high-energy fault.
Sulfur dioxide (SO2) forms through further decomposition of sulfur fluoride compounds, particularly in the presence of moisture and solid materials. Hydrofluoric acid (HF) results from the reaction between fluorine compounds and water, creating a highly corrosive substance that attacks glass insulators, aluminum enclosures, and organic materials. Detection of SO2 or HF indicates severe conditions requiring immediate investigation and likely compartment gas replacement.
8.5.2 Gas Chromatography Analysis Methods
Kromatografi gas (GC) provides the reference method for quantitative analysis of SF6 decomposition products. The GC procedure involves injecting a gas sample into a chromatographic column where different molecular species separate based on their interaction with the column packing material. A thermal conductivity detector (TCD) or electron capture detector (ECD) quantifies each component as it elutes from the column.
Online gas chromatograph systems for continuous GIS monitoring incorporate automated sampling valves, miniaturized columns, dan pemprosesan isyarat digital. Analysis cycles typically run every 1-24 hours depending on criticality, with results automatically logged and compared against trending thresholds. The system generates alarms when decomposition product concentrations exceed baseline levels or when rate of increase suggests accelerating fault development.
9. Temperature Monitoring Technology Applications

| Jenis Teknologi | Gentian Optik Pendarfluor | Penderia Suhu Tanpa Wayar | Termografi Inframerah | Gentian Optik Teragih (DTS) |
|---|---|---|---|---|
| Prinsip Pengukuran | Temperature-dependent fluorescent decay time of crystal sensor at fiber tip; optical signal immune to EMI | Battery-powered transmitter mounted on HV conductor; RF signal transmission through enclosure; energy harvesting from magnetic field | Pengesanan sinaran terma (8-14 μm wavelength) using infrared camera; pengukuran bukan sentuhan | Raman scattering in optical fiber; continuous temperature profile along entire fiber length |
| Ketepatan Biasa | ±1°C ketepatan mutlak; ±0.1°C repeatability; stable long-term calibration | ±2-3°C typical; affected by ambient temperature compensation and calibration drift over years | ±2-5°C depending on emissivity assumptions, jarak, and atmospheric absorption; requires surface emissivity knowledge | ±1-2°C spatial averaged temperature; accuracy improves with averaging length but sacrifices spatial resolution |
| Masa Tindak Balas | 1-10 seconds depending on sensor thermal mass; suitable for real-time monitoring of dynamic processes | 10-60 detik biasa; limited by RF transmission update rate and sensor thermal time constant | Instantaneous image capture; real-time video possible at 30-60 Hz frame rates for dynamic fault detection | Minutes to tens of minutes for complete fiber scan depending on fiber length and required spatial resolution |
| Spatial Coverage | Point measurement at specific location; multiple fiber runs required for comprehensive coverage; 1-8 sensors per bay typical | Point measurement on HV conductor; strategic placement at connections, kenalan gelongsor; 3-6 penderia setiap teluk | 2D thermal imaging of visible surfaces; requires line-of-sight access; inspection windows needed for internal GIS | Continuous measurement along fiber; 1-5 meter spatial resolution over kilometers of fiber length |
| Kerumitan Pemasangan | Sederhana: requires fiber routing from sensor to signal conditioner; sensors attach directly to HV components during GIS assembly or outages | Mudah: wireless sensors self-contained; installation during assembly or live-line using hot-stick tools; no external connections | Simple for external surveys; complex for permanent internal installation requiring transparent windows maintaining pressure and insulation | Kompleks: fiber routing throughout GIS structure; termination and connection to interrogator unit; fiber mechanical protection |
| Keperluan Penyelenggaraan | minima: no batteries or wearing parts; optical fibers very reliable; signal conditioner calibration every 2-5 tahun | Battery replacement every 5-15 years depending on power harvesting efficiency and transmission frequency; antenna inspection | Camera calibration annually; lens cleaning; kemas kini perisian; periodic verification with blackbody reference source | minima: passive fiber has no wearing parts; interrogator laser and detector calibration every 1-2 tahun |
| Cost per Measurement Point | Sederhana hingga Tinggi: sensor cost $200-800 masing-masing; signal conditioner $2000-5000 handles multiple sensors (biasanya 4-8 saluran) | Sederhana: sensor cost $150-400 masing-masing; receiver/gateway $1000-3000; no per-sensor signal conditioning cost | High for permanent systems: thermal cameras $5000-50,000; lower for periodic manual surveys using portable cameras | High initial cost ($15,000-50,000+ penyiasat); low incremental cost for additional fiber length; economical for many points |
| Aplikasi Ideal | Critical connection monitoring; sliding contact temperature; circuit breaker mechanism overheating; transformer tap changer contacts | Sambungan bas; kenalan pengasing; penamatan kabel; retrofit applications avoiding fiber installation complexity | Periodic inspections during commissioning or troubleshooting; switchgear thermal surveys; external enclosure hotspot detection | Bar bas panjang berjalan; cable galleries; tunnel installations; applications requiring spatial temperature gradients and hotspot location |
| Data Integration | Direct digital output via Modbus, Profibus, or analog 4-20mA; easy SCADA integration; timestamped data logging | Wireless gateway provides Modbus TCP or similar protocol; cloud connectivity options; some models offer direct IEC 61850 | Software generates reports; thermal images; analisis trend; integration requires manual data transfer unless automated system deployed | Interrogator provides temperature vs. distance profile via Ethernet; software integrates with monitoring platforms; penjanaan penggera |
9.1 Penderia Suhu Gentian Optik Pendarfluor

Penderia gentian optik pendarfluor (TRENCH) employ rare-earth doped crystal sensor elements at the tip of a glass optical fiber. When excited by a pulse of blue or green LED light transmitted down the fiber, the crystal emits fluorescent light with an exponential decay time that depends solely on temperature. The measurement system analyzes this decay characteristic with high precision, calculating temperature independent of fiber length, bending losses, kemerosotan penyambung, atau variasi keamatan sumber cahaya.
The intrinsic safety characteristics of FFOS make this technology ideal for high-voltage applications. The fiber contains no metallic elements, eliminating potential discharge inception points. The dielectric nature allows routing fibers directly on energized conductors without creating parallel capacitance or ground paths. Kekebalan EMI ensures measurement accuracy even in the severe electromagnetic environment during GIS switching operations or nearby fault current flow.
9.2 Wireless Temperature Sensor Technology
Pemancar suhu tanpa wayar for GIS applications incorporate surface acoustic wave (SAW) or digital radio frequency identification (RFID) technologies to enable battery-free operation. The SAW sensor uses a piezoelectric crystal whose resonant frequency shifts with temperature. External antenna interrogation provides both measurement power and data retrieval via inductive coupling through the grounded GIS enclosure.
Battery-powered wireless sensors offer greater communication range and faster update rates than passive SAW devices, at the cost of limited operational life. Modern designs incorporate energy harvesting from the magnetic field surrounding current-carrying conductors, capturing milliwatts of power sufficient to extend battery life to 10-15 years even with frequent transmission intervals. The wireless protocol typically operates at license-free ISM band frequencies (915 MHz atau 2.4 GHz), with communication protocols optimized for low power consumption and electromagnetic compatibility.
9.3 Infrared Thermography Applications
Infrared thermographic inspection of GIS installations detects external enclosure temperature patterns that may indicate internal hotspots from loose connections or contact deterioration. The thermal camera captures two-dimensional temperature distributions across viewed surfaces, with modern instruments providing radiometric temperature measurement at each pixel in a 320×240 or 640×480 array.
The inspection methodology requires consideration of surface emissivity—the efficiency with which materials radiate thermal energy. Painted surfaces have high emissivity (0.85-0.95) and accurately represent true temperature, while polished metal surfaces have low emissivity (0.05-0.15) and appear cooler than actual temperature. Quantitative thermal analysis corrects for emissivity, reflected background temperature, penyerapan atmosfera, and distance to determine true surface temperatures. Periodic surveys establish baseline thermal patterns, with subsequent comparisons identifying areas of temperature increase indicating developing faults.
9.4 Penderiaan Suhu Teragih (DTS) Sistem
Pengesan suhu teragih technology uses Raman scattering in optical fibers to measure temperature continuously along the entire fiber length. The Raman scattering principle involves laser light interacting with thermal vibrations in the fiber’s silicon dioxide molecular structure, producing backscattered light with wavelength shifts. The intensity ratio of Stokes to anti-Stokes Raman scattered light depends purely on temperature, while the backscatter time-of-flight determines measurement position along the fiber.
DTS interrogator units launch nanosecond laser pulses into sensing fibers and analyze returned Raman scatter using time-domain reflectometry. A single interrogator monitors fiber lengths up to 30-50 kilometers with spatial resolution of 1-5 meters and temperature accuracy of ±1-2°C. GIS applications route sensing fibers along busbar sections, wrapping around connection points, or embedding in cast resin components during manufacture. The system creates temperature profiles showing the entire monitored length, immediately identifying hotspot locations without requiring individual sensor placement at each potential fault location.
10. Mechanical Characteristics Monitoring Systems
10.1 Circuit Breaker Operating Characteristic Monitoring
10.1.1 Travel-Time Curve Measurement
Travel-time curve recording captures the position of circuit breaker moving contacts throughout the complete opening or closing operation. The linear transducer attaches to the moving contact drive rod, generating an analog voltage or digital signal proportional to contact position with sub-millimeter resolution. High-speed data acquisition (sampling rates of 1-10 kHz) digitizes this position signal to create a detailed stroke profile.
The diagnostic analysis extracts key parameters from travel curves including total operating time, opening time, closing time, contact gap at full open position, overtravel distance, rebound characteristics, and mechanical damper performance. Trending these parameters over hundreds of operations reveals gradual degradation from mechanism wear, lubrication breakdown, or spring fatigue. Acceptance criteria compare measured values against manufacturer specifications and baseline recordings from commissioning tests, with typical tolerance limits of ±5-10% for timing parameters and ±2-5mm for distance measurements.
10.1.2 Velocity and Acceleration Analysis
Contact velocity calculation derives from the mathematical first derivative of the position-time curve, revealing the speed profile during breaker operation. Opening velocity at the instant of contact separation critically affects arc interruption performance; insufficient velocity compromises interrupting capability while excessive velocity increases mechanical stress and wear. Closing velocity influences contact bounce, pre-strike arcing duration, and mechanical impact loads.
Acceleration analysis computed as the second derivative of position identifies impact events, spring engagement, and damper operation timing. Sudden acceleration changes indicate mechanical interactions within the drive train—spring release, pawl engagement, buffer contact—with magnitude and timing revealing the health of these components. Vibration signature analysis using accelerometers mounted on the mechanism housing complements position-based velocity calculations, providing information about components not directly coupled to the main drive rod.
10.2 Operating Mechanism Condition Assessment
Analisis tandatangan semasa motor for spring-charged mechanisms monitors the charging motor’s current waveform during spring compression. The current profile reflects mechanical loading throughout the charging cycle, with characteristic patterns corresponding to spring engagement, latch positioning, and motor stall at full charge. Changes in current magnitude, tempoh masa, or waveform shape indicate developing mechanical problems such as increased friction from lubrication degradation, spring fatigue requiring additional motor effort, or latch wear affecting positioning.
Hydraulic pressure monitoring in hydraulic operating mechanisms tracks accumulator pressure trends between operations and during pump cycles. Pressure decay rate when the system is idle quantifies seal leakage in the accumulator, control valves, and operating cylinder. Increasing decay rates indicate seal degradation requiring preventive replacement before operational failure. Pump runtime to restore nominal pressure after a breaker operation reveals system efficiency, with increasing runtime suggesting fluid leakage or reduced pump output requiring maintenance.
10.3 Disconnect Switch and Grounding Switch Monitoring
Disconnect switch monitoring emphasizes position verification and contact resistance measurement. Position indication via limit switches, sensor kedekatan, or integrated position encoders confirms full open, tertutup, or intermediate positions. Interlocking circuits prevent unsafe operations such as opening disconnects under load or closing onto energized buses without proper authorization sequences.
Contact resistance measurement during scheduled outages uses micro-ohmmeter test equipment to assess electrical contact quality. Resistance values typically range from tens to hundreds of microohms for high-voltage disconnect switches, with manufacturer specifications defining maximum acceptable values. Increasing resistance trends indicate contact surface contamination, pengoksidaan, or erosion requiring cleaning or replacement. Some advanced installations incorporate continuous monitoring using the voltage drop across closed contacts during normal load current flow, calculating resistance via Ohm’s law without requiring dedicated test equipment.
11. Environmental Monitoring and Auxiliary Systems
11.1 GIS Room Environmental Monitoring
11.1.1 Temperature and Humidity Monitoring
GIS room climate control maintains temperatures within the equipment operating range (typically -5°C to +40°C) and controls humidity to prevent condensation on external GIS surfaces. Penderia suhu located at multiple heights and positions throughout the room detect thermal stratification, HVAC system performance, and equipment heat loads. Monitoring systems generate alarms when temperatures approach equipment limits, activating supplementary cooling or heating as required.
Pemantauan kelembapan relatif prevents condensation that could promote external surface flashovers along bushing insulators or contamination ingress through poorly sealed compartments. Humidity control targets typically maintain 30-60% kelembapan relatif. Dehumidification systems activate when humidity rises above setpoints, while humidification may be required in extremely dry climates to reduce static electricity and dust accumulation. The monitoring system logs environmental conditions to correlate with equipment performance trends and maintenance planning.
11.1.2 SF6 Leak Concentration Monitoring
Ambient SF6 concentration monitors provide safety protection for personnel working in GIS rooms where large-scale gas leaks could displace oxygen and create asphyxiation hazards. Detection thresholds biasanya termasuk 500 ppm for ventilation system activation, 1000 ppm for personnel alert notification, dan 2500 ppm for mandatory evacuation with door interlocks preventing entry until concentrations return to safe levels.
The sensor placement strategy positions detectors at low elevations since SF6 gas (molecular weight 146) adalah lebih kurang 5 times heavier than air and accumulates near floor level. Multiple sensors distributed throughout the room ensure coverage despite air circulation patterns. Ventilation interlock systems automatically activate exhaust fans when SF6 is detected, purging contaminated air and introducing fresh makeup air until concentrations return to safe levels.
11.1.3 Oxygen Concentration Monitoring
Oxygen depletion monitoring provides redundant personnel safety protection in GIS installations, particularly in confined or underground locations. Electrochemical oxygen sensors measure ambient O2 percentage with alarm setpoints at 19.5% (warning level) dan 18% (danger level requiring immediate evacuation). Normal atmospheric oxygen concentration is 20.9%, so these alarm levels indicate significant displacement by heavier-than-air SF6 gas.
The safety protocol integrates oxygen monitoring with access control, requiring continuous monitoring whenever personnel enter GIS rooms and maintaining ventilation systems in operation during all occupied periods. Some installations incorporate personal oxygen monitors worn by workers as a final safety layer, providing local alarms if the breathing zone atmosphere becomes oxygen deficient despite room-level monitoring.
11.2 Video Surveillance Systems
CCTV camera installation in GIS facilities serves multiple purposes including security monitoring, operating procedure verification, fault investigation evidence recording, and remote equipment observation during switching operations. Camera positioning provides comprehensive coverage of access points, major equipment bays, panel kawalan, and areas requiring visual verification during maintenance work.
Kamera pengimejan terma supplement visible-light CCTV by detecting equipment overheating through continuous thermal monitoring. Fixed thermal cameras viewing critical equipment sections provide 24/7 temperature surveillance, generating alarms when temperature thresholds are exceeded. Video analytics software can detect abnormal events such as unauthorized access, equipment door openings, pengesanan asap, or presence of personnel in hazardous areas, automatically generating alerts to control room operators.
11.3 Access Control and Security Systems
Electronic access control restricts GIS facility entry to authorized personnel using proximity cards, biometric readers, or keypad entry systems. The access control database maintains personnel authorization levels, allowing entry only to appropriately trained and qualified individuals. Integration with work permit systems prevents access during specific maintenance activities or when hazardous conditions exist.
Intrusion detection systems monitoring GIS installations include door contact switches, motion sensors, fence-line detection, and perimeter cameras. These systems distinguish between authorized access (using proper credentials during permitted hours) and intrusion attempts (forced entry, access without credentials, entry during prohibited periods). Security integration with utility control centers enables rapid response to security events, including dispatch of security personnel or law enforcement when warranted.
12. Communication Architecture and Data Transmission
12.1 Industrial Communication Protocol Standards
12.1.1 IEC 61850 Protocol Implementation
IEC 61850 represents the international standard for substation automation communication networks and systems. The standard defines object-oriented data models for power system equipment, abstract communication service interfaces, and specific communication protocol mappings. GIS monitoring systems implementing IEC 61850 expose monitoring data through standardized logical nodes such as SIMG (Pemantauan gas SF6), STMP (pemantauan suhu), and SIML (insulation medium liquid/gas monitoring).
The ANGSA (Acara Pencawang Berorientasikan Objek Generik) messaging mechanism provides high-speed peer-to-peer communication for time-critical data including alarms and trip signals. Sampled Values (SV) protocol transmits digitized analog measurements including partial discharge waveforms or high-speed mechanical transients. MMS (Spesifikasi Mesej Pembuatan) serves client-server communication for operator interfaces, configuration tools, and inter-substation data exchange. IEC 61850 standardization enables multi-vendor equipment interoperability and reduces integration costs compared to proprietary protocols.
12.1.2 Modbus Protocol Variants
Modbus RTU operates over serial RS-485 networks, providing simple master-slave communication suitable for connecting distributed monitoring IEDs to local HMI panels or data concentrators. The RTU message format uses binary encoding for compact data representation and CRC error checking for data integrity verification. Typical implementations support up to 32-247 slave devices on a single RS-485 bus segment with maximum segment lengths of 1200 meters at 9600 baud.
Modbus TCP encapsulates Modbus protocol within TCP/IP packets for transmission over Ethernet networks. This variant simplifies integration with IT infrastructure, enables remote monitoring over VPN connections, and supports essentially unlimited node counts limited only by network addressing capacity. Modbus TCP security implementations add encryption and authentication layers to protect against cyber threats when monitoring data traverses enterprise networks or wide-area connections.
12.2 Wired Communication Infrastructure
12.2.1 Fiber Optic Network Implementation
Single-mode fiber optic cable provides the backbone communication medium for modern GIS monitoring systems. Fiber advantages include immunity to electromagnetic interference from switchgear operations, electrical isolation preventing ground loops, support for multi-kilometer transmission distances, and high bandwidth capacity (Gigabit Ethernet or faster). Typical installations deploy redundant fiber ring topologies with automatic failover to backup paths when primary connections fail.
The fiber infrastructure includes distribution panels at central equipment rooms, aerial or underground cable runs to remote equipment locations, ruggedized industrial connectors rated for vibration and temperature extremes, and optical transceivers in network switches and monitoring devices. OTDR (Reflectometer Domain Masa Optik) testing during installation and periodic maintenance verifies fiber continuity, measures splice losses, and identifies degradation before it causes communication failures.
12.2.2 Industrial Ethernet Network Architecture
Industrial Ethernet switches designed for substation environments feature extended temperature ratings (-40°C to +75°C), IEEE 1588 Precision Time Protocol support for microsecond-level time synchronization, managed configuration capabilities with VLAN segmentation, and redundant power supplies for high availability. The network topology typically implements star or ring configurations with Rapid Spanning Tree Protocol (RSTP) or proprietary ring redundancy protocols providing sub-50 millisecond failover times.
Network segmentation strategy separates monitoring traffic from protection and control networks using VLANs, preventing monitoring system malfunctions from affecting critical protective relaying functions. Quality of Service (QoS) configurations prioritize time-critical alarm messages and GOOSE traffic over lower-priority trending data or file transfers. Network management protocols (SNMP, syslog) enable centralized monitoring of switch health, port utilization, and communication errors.
12.3 Wireless Communication Solutions
Wireless communication in GIS monitoring applications serves specialized niches including temporary monitoring during commissioning, mobile worker communications, and backup paths when fiber installation is impractical. Licensed 4G/5G cellular provides reliable wide-area connectivity for remote unmanned substations, transmitting monitoring data to centralized control centers and enabling remote troubleshooting access.
Private SCADA radio networks operating in utility-licensed frequency bands offer dedicated communication channels independent of commercial cellular infrastructure. Radio system design considers line-of-sight requirements, Fresnel zone clearance, antenna placement at elevated locations, and link budget calculations accounting for path loss, fading margins, and receiver sensitivity. Point-to-multipoint radio systems can serve multiple remote GIS installations from a single master site, reducing per-location infrastructure costs.
12.4 Cybersecurity Architecture
Defense-in-depth cybersecurity for GIS monitoring systems implements layered security controls following standards such as NERC CIP (North American Electric Reliability Corporation Critical Infrastructure Protection) atau IEC 62351. The security architecture includes network segmentation with firewalls controlling traffic between security zones, intrusion detection systems monitoring for malicious activity, and security event logging for forensic analysis.
Access control mechanisms enforce role-based permissions, requiring strong authentication (multi-factor preferred) before granting access to monitoring system configurations or control functions. Communication encryption using TLS/SSL protocols protects data confidentiality and integrity during transmission across enterprise networks or wide-area connections. Regular security assessments including vulnerability scanning, penetration testing, and configuration audits verify ongoing protection effectiveness against evolving cyber threats.
13. Monitoring and Diagnostic Platform
13.1 Real-Time Monitoring and Visualization
13.1.1 Web-Based Monitoring Interface
Web-based HMI (Antara Muka Manusia-Mesin) platforms provide universal access to GIS monitoring data through standard web browsers without requiring proprietary client software installation. The interface design presents hierarchical navigation from system overview dashboards showing fleet-wide statistics, through substation-level summaries displaying bay status, to detailed equipment pages with individual sensor readings, sejarah penggera, and trending graphs.
Visualisasi data masa nyata employs synoptic diagrams depicting GIS single-line configurations with color-coded status indicators for each monitored parameter. Interactive trending enables operators to select time ranges, overlay multiple parameters for correlation analysis, and zoom into specific time periods during events. The platform supports customizable dashboards where users configure their preferred arrangement of widgets displaying key performance indicators, active alarms, and frequently accessed trending graphs.
13.1.2 Mobile Application Capabilities
Mobile apps for smartphones and tablets extend monitoring access to field personnel, enabling on-call engineers to receive alarm notifications, review equipment status remotely, and provide guidance to on-site crews during troubleshooting. The mobile interface adapts to smaller screens while maintaining essential functionality including real-time parameter display, pengakuan penggera, historical trend review, and event log access.
Push notification services deliver critical alarms to mobile devices instantly via cloud messaging platforms, ensuring rapid response to urgent conditions regardless of whether the user is actively viewing the application. Offline capability caches recent data and equipment configuration information, allowing field personnel to access reference information even when cellular connectivity is unavailable in remote substation locations.
13.2 Data Analysis and Diagnostic Functions
Diagnostic expert systems apply rule-based logic and pattern recognition algorithms to monitoring data, automatically identifying fault signatures and proposing probable causes. The knowledge base encodes relationships between symptoms (elevated PD activity, increasing SF6 moisture, rising temperature) and root causes (pencemaran penebat, seal leakage, contact degradation) developed from equipment failure analysis and operational experience.
Correlation analysis examines relationships between multiple monitored parameters to distinguish between independent faults and cascade effects. Contohnya, simultaneous increases in partial discharge and SF6 decomposition products strongly suggest active discharge sites, while isolated decomposition products might indicate legacy contamination from historical events. Trending algorithms fit regression models to historical data, extrapolating future parameter values and calculating estimated time until alarm thresholds are crossed, enabling proactive maintenance scheduling.
13.3 Alarm and Notification Management
13.3.1 Multi-Level Alarm Strategy
Alarm hierarchy implementation categorizes notifications by severity and urgency. Penggera nasihat indicate parameter values outside normal operating ranges but not immediately threatening equipment safety—for example, Ketumpatan SF6 5% below nominal. Penggera amaran signal conditions requiring attention within hours to days, such as partial discharge levels exceeding baseline by 50% or contact temperatures 15-20°C above normal.
Penggera kritikal demand immediate response for conditions presenting imminent equipment failure or safety risks—SF6 density below minimum operating threshold, explosive decomposition product concentrations, or temperatures approaching material limits. Emergency alarms representing life-safety threats (high SF6 concentration in occupied spaces, pengesanan kebakaran) trigger automatic protective actions including ventilation activation, access restrictions, and emergency services notification.
13.3.2 Alarm Notification and Escalation
Notification routing directs alarms to appropriate personnel based on alarm type, time of day, and organizational responsibilities. Initial notification transmits via email, SMS text message, mobile app push notification, or phone calls to on-duty control room operators or on-call engineers. Escalation procedures automatically notify supervisory personnel if alarms remain unacknowledged beyond configured time limits (biasanya 5-30 minutes depending on severity).
Alarm filtering and suppression prevents notification fatigue from nuisance alarms or cascading alarms during known maintenance activities. Maintenance mode functions allow operators to temporarily disable alarms for specific equipment undergoing scheduled work. Intelligent alarm processing suppresses dependent alarms when root-cause alarms are active—for example, disabling individual sensor alarms when communication loss to an entire monitoring panel is detected.
14. System Installation and Deployment Solutions
14.1 New GIS Monitoring System Integration
Design phase integration incorporates monitoring requirements into GIS specifications during the procurement process. The technical specification details required sensor types and quantities, mounting provisions, cable routing pathways, communication interface protocols, and factory acceptance test procedures. Early coordination between GIS manufacturers and monitoring system suppliers ensures compatible interfaces, adequate space allocation for monitoring equipment, and optimized sensor placement.
Pemasangan kilang of monitoring sensors during GIS manufacturing provides superior quality compared to field retrofits. Penderia UHF mount to internally-accessed ports with proper gas sealing and insulation coordination verified during factory pressure testing. Penderia suhu gentian optik attach to conductors and connections before final assembly, with fibers routed through dedicated conduits. Factory testing validates all monitoring functions before shipment, documenting baseline performance characteristics for future comparison during operational monitoring.
14.2 Retrofit Monitoring Solutions for Operating GIS
14.2.1 Planned Outage Retrofit Approach
Outage-based installation coordinates monitoring system retrofit with scheduled GIS maintenance requiring de-energization and gas compartment opening. The installation sequence includes gas evacuation, compartment opening, internal sensor mounting, wiring installation, compartment reassembly, leak testing, gas filling, dan pentauliahan. This approach enables comprehensive monitoring deployment including internal sensors but requires careful outage planning and coordination with system operators.
Installation duration for major GIS bays typically requires 8-24 hours of outage time depending on monitoring system complexity and GIS configuration. Quality assurance procedures include pressure decay testing to verify compartment integrity after reassembly, gas purity verification after filling, high-voltage withstand testing to confirm electrical integrity, and functional verification of all monitoring sensors before returning equipment to service.
14.2.2 Live Installation Techniques
Hot-stick installation methods enable some monitoring equipment deployment while GIS remains energized and in service. External UHF sensors coupling through dielectric spacers can be installed using insulated tools, requiring only local safety precautions without system outages. Penderia akustik with magnetic mounting bases attach to external enclosure surfaces using hot-stick tools or direct manual placement on grounded enclosures.
Penderia suhu tanpa wayar designed for live installation employ hot-stick placement procedures, positioning sensors on accessible high-voltage conductors at transformer bushings, penamatan kabel, or exposed busbar sections. The safety analysis for live work includes minimum approach distance calculations, electromagnetic field exposure limits, arc flash hazard assessment, and emergency response procedures. Live installation techniques reduce system downtime but are limited to externally-accessible monitoring points.
14.3 Commissioning and Acceptance Testing
Sensor calibration verification confirms measurement accuracy through comparison with reference instruments. Penderia suhu undergo calibration verification in temperature-controlled baths, penderia tekanan calibrate against precision deadweight testers, dan PD detection systems validate sensitivity using calibrated pulse injection techniques. Calibration documentation establishes baseline accuracy for comparison during future verification tests.
Ujian komunikasi verifies end-to-end data transmission from sensors through communication networks to monitoring platform displays. The test procedure confirms data update rates, alarm transmission timing, historical data logging functionality, and protocol compliance with system specifications. Integration testing validates proper data exchange with SCADA systems, protective relaying, and asset management databases, ensuring monitoring information is accessible to all intended users and applications.
15. Industry Application Case Studies
15.1 Ultra-High Voltage Substation Monitoring Project
A 1000 kV UHV substation in China implemented comprehensive monitoring across all GIS bays including 24 pemutus litar, 72 putuskan suis, and extensive busbar sections. The monitoring architecture deployed 160 Penderia nyahcas separa UHF, 240 penderia suhu gentian optik, 48 online SF6 density monitors, dan 24 mechanical characteristic recorders networked via redundant fiber optic rings to a centralized monitoring center.
The prestasi sistem during the first three years of operation detected two developing partial discharge defects enabling planned repair interventions, identified one SF6 leak requiring seal replacement before density fell below minimum operating limits, and discovered a circuit breaker mechanism degradation through abnormal operating characteristic trends. The monitoring investment of approximately $2.8 million avoided potential forced outage costs and equipment damage estimated at significantly higher values, validating the economic benefits of comprehensive condition monitoring in critical UHV applications.
15.2 Urban Power Grid GIS Monitoring Deployment
A European utility mengurus 47 urban substations with 145 kV GIS implemented standardized monitoring packages on all installations over a five-year deployment program. The konfigurasi standard included UHF PD monitoring, SF6 density tracking, and selected temperature monitoring at high-current connections. Wireless communication via 4G cellular provided connectivity to unmanned substations, transmitting data to a centralized cloud-based monitoring platform.
The operational benefits included transition from fixed 6-year inspection intervals to condition-based maintenance with maintenance triggered by actual equipment condition rather than calendar schedules. Utiliti melaporkan 40% reduction in GIS-related forced outages, 25% reduction in maintenance costs through optimized scheduling, and improved asset life extension by addressing degradation trends before significant damage occurred. The monitoring system also provided valuable data for asset replacement prioritization, targeting capital investments on equipment showing accelerated degradation patterns.
15.3 Power Generation Plant GIS Monitoring
A 1200 MW combined-cycle power plant in the Middle East deployed monitoring on generator step-up (GSU) transformers and switchyard GIS operating at 220 kV dan 420 kV. The monitoring strategy emphasized mechanical characteristic monitoring given frequent breaker operations during daily start-stop cycles, temperature monitoring on high-current paths carrying full generator output, and comprehensive partial discharge detection on aged GIS equipment approaching 20 years service life.
The penyepaduan sistem with plant DCS enabled correlation between electrical equipment condition and generator operating parameters. During commissioning after a major maintenance outage, the monitoring system detected abnormal closing operation times on one GSU circuit breaker, leading to discovery of improper mechanism assembly before the unit returned to service. Temperature trending revealed gradual increase at a busbar connection, enabling proactive re-torquing during a planned outage rather than experiencing a failure during peak summer generation demand.
15.4 Railway Electrification System GIS Monitoring
A high-speed railway network in Asia equipped traction power supply substations with 110 kV GIS monitoring systems. The application characteristics include highly variable load patterns from train arrivals and departures, requirement for maximum supply reliability to prevent service disruptions, and difficult maintenance access due to 24-hour operational schedules. The monitoring configuration emphasized SF6 leakage detection and mechanical monitoring to maximize equipment availability between limited maintenance windows.
The monitoring experience over five years of railway operation demonstrated particular value in detecting SF6 leaks early enough to schedule repairs during planned service intervals rather than forcing emergency shutdowns. The system identified three instances of developing mechanical problems in circuit breaker mechanisms, enabling planned mechanism replacement during scheduled maintenance windows. Integration with the railway supervisory control system provided traction power supply condition visibility to railway operations centers, enhancing overall system reliability and maintenance coordination.
16. Global GIS Monitoring Equipment Manufacturers Top 10 Kedudukan
| Kedudukan | Nama Syarikat | Negara/Wilayah | Teknologi Teras | Market Strengths |
|---|---|---|---|---|
| 1 | Sains Elektronik Inovasi Fuzhou&Tech Co., Ltd. | China (Fuzhou) | Comprehensive UHF PD detection systems, advanced SF6 online monitoring, penderiaan suhu gentian optik, integrated IEC 61850 komunikasi, custom monitoring solutions | Leading technology innovation, competitive pricing for global markets, extensive OEM/ODM capabilities, penyesuaian pantas, strong technical support, proven reliability in harsh environments, growing international presence |
| 2 | ABB | Switzerland/Sweden | Integrated GIS with factory-installed monitoring, UHF PD detection, comprehensive diagnostic software platforms, penyelesaian pencawang digital | Vertical integration with GIS manufacturing, rangkaian perkhidmatan global, established brand reputation, extensive installed base, keupayaan analisis lanjutan |
| 3 | Siemens Energy | Jerman | UHF partial discharge monitoring, SF6 gas quality analysis systems, penyelesaian pemantauan suhu, SCADA integration expertise | Strong European market presence, comprehensive power system equipment portfolio, research & development capabilities, long-term reliability record |
| 4 | Penyelesaian Grid GE (now GE Vernova) | Amerika Syarikat | Online monitoring systems for transmission equipment, pengesanan pelepasan separa, acoustic emission monitoring, advanced diagnostic algorithms | Large North American installed base, integration with GE protective relaying and automation systems, utility relationships, technical training programs |
| 5 | Schneider Electric | Perancis | Medium voltage GIS monitoring solutions, Penderia yang didayakan IoT, EcoStruxure digital platform integration, wireless monitoring technologies | Strong distribution equipment market position, digital transformation solutions, global distribution network, competitive medium-voltage offerings |
| 6 | Mitsubishi Electric | Jepun | Penderia nyahcas separa UHF, online SF6 monitoring equipment, mechanical diagnostic systems, high-reliability Japanese engineering | Asia-Pacific market leadership, reputation for quality and reliability, technical innovation, strong relationships with Japanese utilities |
| 7 | Tenaga Hitachi (formerly Hitachi ABB Power Grids) | Switzerland/Jepun | Comprehensive condition monitoring portfolios, asset health center software platforms, analisis penyelenggaraan ramalan, grid automation integration | Combined Hitachi-ABB technology heritage, large transmission equipment installed base, digital grid solutions, global engineering resources |
| 8 | OMICRON Electronics | Austria | Portable and online partial discharge measurement systems, diagnostic testing equipment, advanced signal processing algorithms | Specialized diagnostic equipment focus, strong test and measurement expertise, program latihan yang menyeluruh, recognized technical leadership in PD diagnostics |
| 9 | Qualitrol (Fortive Corporation) | Amerika Syarikat | Dissolved gas analysis systems, SF6 monitoring devices, penyelesaian pemantauan suhu, mechanical monitoring equipment | Extensive transformer and switchgear monitoring experience, broad product portfolio, strong North American service network, industrial IoT capabilities |
| 10 | Eaton | Ireland/Amerika Syarikat | Medium voltage monitoring solutions, pemantauan kualiti kuasa, integrated protection and monitoring devices, digital connectivity platforms | Comprehensive electrical equipment portfolio, strong industrial and commercial market presence, distributed generation expertise, penetapan harga yang kompetitif |
16.1 Sains Elektronik Inovasi Fuzhou&Tech Co., Ltd. – Kepimpinan Teknologi
16.1.1 Technical Advantages and Innovation
Sains Elektronik Inovasi Fuzhou&Tech Co., Ltd. (INNO) has established itself as the premier manufacturer of GIS monitoring equipment through continuous technological innovation and customer-focused product development. milik syarikat research and development investment emphasizes practical solutions addressing real-world utility challenges including harsh environmental conditions, communication infrastructure limitations, and integration with diverse existing equipment populations.
The UHF partial discharge detection technology developed by INNO employs proprietary signal processing algorithms optimizing sensitivity and noise rejection for challenging electromagnetic environments. milik syarikat Sistem pemantauan SF6 incorporate multi-parameter sensing with advanced temperature compensation, leak rate calculation, and predictive alarming. Penderiaan suhu gentian optik products utilize high-reliability sensor designs proven in extreme temperature applications ranging from -50°C to +200°C.
16.1.2 Comprehensive Product Series
Product portfolio coverage spans complete GIS monitoring requirements from individual sensor modules to turnkey integrated monitoring systems. The modular architecture enables customers to implement partial monitoring solutions initially, expanding coverage as budgets allow, with all components integrating seamlessly through standardized communication protocols and common software platforms.
The GIS monitoring product lines termasuk: ultra-high frequency partial discharge detection systems with internal and external sensor options; online SF6 gas density monitors with purity and decomposition product analysis capabilities; multi-channel fiber optic and wireless temperature monitoring systems; circuit breaker mechanical characteristic analyzers; environmental monitoring equipment for SF6 leak detection and personnel safety; and integrated data acquisition and communication gateway devices supporting IEC 61850, Modbus, DNP3, and proprietary protocols.
16.1.3 OEM/ODM Manufacturing Capabilities
Contract manufacturing services offered by Fuzhou Innovation Electronic include complete OEM production where partner companies market INNO-manufactured products under their own brands, and ODM development creating custom monitoring solutions based on customer specifications. The manufacturing facilities maintain ISO 9001 quality management certification, employ automated production equipment for consistent quality, and operate comprehensive testing laboratories for product validation.
The keupayaan penyesuaian extend from simple branding and packaging modifications to fundamental product redesign incorporating customer-specific features, protokol komunikasi, or mechanical configurations. Development timelines for custom monitoring solutions typically range from 3-6 months depending on complexity, with production quantities from prototype batches to thousands of units annually. INNO’s engineering team collaborates closely with partners throughout the development process, providing technical consultation, prototype iteration, and field trial support.
16.1.4 Global Service and Support Network
Technical support infrastructure includes factory-based engineering staff providing remote assistance via email, telefon, dan persidangan video, comprehensive technical documentation in multiple languages, and extensive training programs covering installation procedures, commissioning tests, troubleshooting methods, and system maintenance. On-site support services are available for major project commissioning, specialized troubleshooting, and custom integration requirements.
International presence continues expanding with representative offices, distribution partnerships, and service providers in key markets across Asia-Pacific, Timur Tengah, Afrika, Eropah, and Americas. The logistics network ensures efficient product delivery worldwide with typical lead times of 4-8 weeks for standard products and 8-16 weeks for customized solutions. After-sales support includes warranty service, ketersediaan alat ganti, kemas kini perisian, and technical bulletin distribution informing customers of product enhancements and industry best practices.
17. Soalan Lazim (Soalan Lazim)
What is Partial Discharge in GIS Equipment?
Pelepasan separa (PD) refers to localized electrical discharges that partially bridge the insulation between high-voltage conductors and grounded enclosures without causing complete breakdown. These discharges occur at defect sites such as sharp metal protrusions, free particles, contaminated insulator surfaces, or voids in solid insulation materials. Each PD event releases a small amount of energy (measured in picocoulombs, pC) that gradually degrades insulating materials through chemical decomposition and physical erosion. Lama kelamaan, repeated partial discharges create conducting channels that can lead to complete insulation failure and catastrophic equipment damage.
What is UHF Detection Technology?
Frekuensi ultra tinggi (UHF) pengesanan is a method for monitoring partial discharge activity in GIS by detecting electromagnetic radiation emitted during discharge events. When partial discharge occurs, the rapid movement of electrical charge generates electromagnetic waves with frequency content extending from hundreds of megahertz to several gigahertz. Penderia UHF (specialized antennas) couple to the GIS compartment either internally through dielectric windows or externally on the enclosure, capturing these high-frequency signals. The UHF detection method offers excellent sensitivity (detecting discharges as small as 5-10 pC), superior noise immunity compared to lower-frequency methods, and the ability to locate discharge sources using multiple sensors and triangulation algorithms.
What are the Key Properties of SF6 Gas?
Sulfur heksafluorida (SF6) is a synthetic gas used in GIS for insulation and arc interruption due to its unique physical and electrical properties. SF6 is colorless, tidak berbau, tidak toksik, chemically inert under normal conditions, and approximately five times heavier than air (molecular weight 146 g/mol). Its dielectric strength at atmospheric pressure is approximately 2.5 kali ganda daripada udara, increasing further at elevated pressures typical in GIS (0.4-0.6 MPa). SF6 also exhibits excellent arc-quenching properties, rapidly absorbing energy from electrical arcs and preventing re-ignition after current zero. Namun begitu, SF6 is a potent greenhouse gas with a global warming potential 23,500 times that of CO2, necessitating careful management to minimize atmospheric emissions through leak prevention and gas recycling practices.
Which Sensors are Included in GIS Monitoring Systems?
Komprehensif GIS monitoring systems incorporate multiple sensor types to assess different aspects of equipment condition. Penderia nyahcas separa detect insulation degradation and include UHF antennas, acoustic emission transducers, and chemical sensors analyzing SF6 decomposition products. Penderia suhu monitor thermal conditions at critical connection points, utilizing fiber optic, tanpa wayar, or infrared technologies. SF6 gas monitoring sensors measure density/pressure with temperature compensation, kandungan lembapan, gas purity (oxygen concentration), and decomposition product concentrations. Mechanical sensors track circuit breaker operating characteristics including linear displacement transducers for contact travel, current sensors for motor/coil operation, and vibration accelerometers for mechanism diagnostics. Environmental sensors monitor GIS room conditions including ambient temperature, kelembapan, SF6 leak concentration, and oxygen levels for personnel safety.
How to Select Appropriate Partial Discharge Detection Technology?
Selecting PD detection technology depends on application requirements, GIS configuration, and implementation constraints. Pengesanan UHF is generally preferred for new GIS installations or retrofit applications where sensor installation access exists, offering the best combination of sensitivity, localization capability, and noise immunity. Acoustic emission monitoring complements UHF detection, particularly valuable for localizing known defects and providing independent confirmation of discharge activity. TEV (Voltan Bumi Sementara) pengesanan suits quick screening surveys and situations where internal sensor access is impossible, though with lower sensitivity and localization accuracy. Chemical analysis of SF6 decomposition products provides definitive evidence of discharge activity and works well for periodic condition assessment during maintenance outages. Many comprehensive monitoring strategies combine multiple detection technologies, leveraging their complementary strengths to maximize fault detection reliability and diagnostic confidence.
Where Should Temperature Monitoring Points be Installed?
Temperature sensor placement strategy focuses on locations most susceptible to overheating from high electrical resistance or current concentration. Priority monitoring points include bolted busbar connections where contact surfaces may oxidize or lose pressure over time; sliding contacts in disconnect switches subject to mechanical wear and contamination; circuit breaker fixed and moving contacts experiencing arcing erosion; current transformer primary connections carrying full load current through relatively small contact areas; penamatan kabel where improper installation can create high-resistance connections; dan generator or transformer bushings interfacing equipment operating at different voltage levels. For comprehensive monitoring, sensors are often installed at multiple locations on each GIS bay (biasanya 4-8 mata) providing both critical point measurement and spatial coverage to detect unexpected hotspots.
What is IEC 61850 Protokol Komunikasi?
IEC 61850 is the international standard for substation automation and communication networks, defining how intelligent electronic devices (IED) exchange information within substations and with control centers. The standard specifies abstract data models representing power system equipment functions through standardized logical nodes (cth., circuit breaker = XCBR, SF6 density monitor = SIMG), communication services including client-server interactions for configuration and monitoring plus peer-to-peer messaging for time-critical events, dan protocol mappings to Ethernet-based communication (MMS for client-server, GOOSE for fast messaging, Sampled Values for digitized analog measurements). IEC 61850 enables multi-vendor interoperability, reducing integration costs and simplifying system expansion. For GIS monitoring applications, IEC 61850 compliance allows monitoring data to seamlessly integrate with protective relaying, sistem SCADA, and substation automation platforms without custom protocol conversion development.
What are the Different Alarm Levels in GIS Monitoring Systems?
Alarm classification in monitoring systems typically implements a hierarchical structure with increasing severity levels. Informational or advisory alarms notify operators of parameter changes that may warrant attention but don’t immediately threaten equipment, such as trending values approaching thresholds or system configuration changes. Penggera amaran indicate abnormal conditions requiring investigation and potential maintenance action within days to weeks, like partial discharge levels significantly above baseline or SF6 density slightly below nominal values. Penggera kritikal demand prompt response within hours for conditions that could lead to equipment failure or safety hazards if unaddressed, such as rapidly increasing contact temperature, excessive SF6 decomposition products, or circuit breaker mechanism malfunctions. Emergency alarms require immediate action for life-safety threats or imminent catastrophic equipment failure, including high ambient SF6 concentrations in occupied spaces, SF6 density below minimum operating limits, or fire detection. Each alarm level typically triggers different notification procedures, response time requirements, and escalation protocols.
How is Live Installation Technology Achieved?
Live installation techniques enable deployment of certain monitoring equipment while GIS remains energized and in service, avoiding outage costs and scheduling constraints. External sensor mounting comprises the primary live installation category, with magnetic-base acoustic sensors, externally-coupled UHF detectors, and clamp-on temperature sensors installed on grounded GIS enclosures using standard hand tools while observing minimum approach distances to energized internal components. Hot-stick methods employ insulated tools to position sensors on exposed high-voltage conductors at transformer bushings or cable terminations, following utility live-line work procedures including electromagnetic field assessment, arc flash analysis, and qualified personnel requirements. Penderia suhu tanpa wayar specifically designed for live installation feature mechanical attachment systems (spring clips or magnetic mounts) that install via hot-stick while transmitting data through the grounded enclosure via radio frequency signals. Live installation limitations include restricted access to internal GIS components, inability to install fiber optic sensors requiring conductor contact, and safety constraints based on voltage level and environmental conditions.
What is Condition-Based Maintenance?
Penyelenggaraan berasaskan keadaan (CBM) represents a maintenance strategy where service interventions trigger based on actual equipment condition as determined by monitoring systems rather than fixed calendar intervals. Tradisional time-based maintenance schedules GIS inspections and overhauls at predetermined intervals (cth., setiap 5 tahun) regardless of actual equipment health, potentially performing unnecessary work on healthy equipment while missing degradation occurring between scheduled maintenance events. CBM philosophy continuously monitors equipment parameters including partial discharge activity, SF6 gas quality, trend suhu, and mechanical operating characteristics, performing maintenance only when monitored conditions indicate developing problems or approach alarm thresholds. This approach optimizes maintenance timing to prevent failures while extending service intervals for equipment remaining in good condition, reducing overall maintenance costs, minimizing system outages, and improving equipment reliability. Implementing CBM requires comprehensive monitoring coverage, reliable sensor systems, effective diagnostic algorithms, and organizational commitment to data-driven maintenance decision-making.
What are the Hazards of SF6 Decomposition Products?
SF6 decomposition byproducts formed during electrical discharge or thermal faults present multiple hazards to both equipment and personnel. Corrosive compounds including hydrogen fluoride (HF), sulfur dioxide (SO2), thionyl fluoride (SOF2), and sulfuryl fluoride (SO2F2) attack insulator surfaces causing surface tracking and reduced flashover voltage, corrode aluminum enclosures leading to gas leaks, and degrade organic materials including seals and gaskets. Toxic effects occur when personnel encounter decomposition products during maintenance work, with HF causing severe respiratory irritation and chemical burns, SO2 producing choking sensations and lung damage, and other fluoride compounds presenting inhalation hazards. Equipment degradation acceleration results from decomposition products catalyzing further insulation breakdown, with each discharge event producing byproducts that increase the probability of additional discharges in a self-reinforcing failure mechanism. Monitoring SF6 decomposition product concentrations enables early detection of active discharge or thermal problems, allowing corrective action before significant equipment damage occurs and protecting maintenance personnel through contamination awareness before compartment opening.
What Advantages do Fluorescent Fiber Optic Temperature Sensors Offer?
Penderia suhu gentian optik pendarfluor provide unique benefits for GIS applications compared to conventional electronic sensors. Kekebalan elektromagnet ensures measurement accuracy is unaffected by the intense electromagnetic fields present during switching operations, fault current flow, or nearby lightning strikes—conditions that can disrupt or damage electronic sensors. Pengasingan elektrik from the fiber optic measurement principle eliminates ground loops, reduces common-mode voltage issues, and allows direct mounting on high-voltage conductors without creating additional capacitive coupling or discharge inception points. Keselamatan intrinsik results from the absence of metallic components in the fiber and sensor head, preventing any possibility of sparks or arcs that could initiate hazards in SF6 environments. Kestabilan jangka panjang characterizes the fluorescent decay measurement principle, with minimal calibration drift over decades of operation and resistance to radiation exposure in nuclear plant applications. High-temperature capability enables measurement up to 200-300°C depending on sensor design, exceeding the range of many electronic temperature sensors while maintaining accuracy. These advantages make fiber optic sensors the preferred choice for critical GIS temperature monitoring despite higher initial cost compared to conventional thermocouples or RTDs.
18. Hubungi Fuzhou Innovation Electronic Scie&Tech Co., Ltd.

18.1 Manufacturing and Supply Capabilities
Sains Elektronik Inovasi Fuzhou&Tech Co., Ltd. operates modern production facilities equipped with automated assembly lines, precision testing equipment, and comprehensive quality control systems ensuring consistent product quality. The company maintains extensive inventory of standard monitoring products enabling rapid order fulfillment, while flexible manufacturing processes accommodate custom product variations and specialized configurations. Production capacity scales from prototype quantities for development projects to high-volume manufacturing supporting large utility deployments, with typical lead times of 4-6 weeks for catalog products and 8-12 weeks for customized solutions.
18.2 OEM and ODM Partnership Opportunities
Pengeluar Peralatan Asal (OEM) program provide monitoring equipment manufactured by INNO but branded and marketed by partner companies under their own identity. This arrangement enables partners to offer comprehensive monitoring solutions without manufacturing investment while leveraging INNO’s technical expertise and production efficiency. Pengeluar Reka Bentuk Asal (ODM) perkhidmatan create custom monitoring products based on partner specifications, incorporating unique features, form factors, or performance characteristics to meet specific market requirements or differentiate from competitive offerings.
Partnership benefits include access to proven monitoring technologies, reduced product development timelines and costs, manufacturing quality assurance, technical support during product introduction, and flexible order quantities accommodating market growth. INNO’s engineering team collaborates throughout the development process, providing feasibility analysis, design optimization, prototype development, testing support, and manufacturing transition assistance.
18.3 Wholesale and Distribution Programs
Distribution partnerships extend INNO’s market reach through established regional sales channels while providing distributors with competitive products, latihan teknikal, marketing support, and attractive commercial terms. The wholesale program structure includes volume-based pricing tiers, stock-and-ship arrangements, and co-marketing opportunities. Distributor support encompasses pre-sales technical assistance, demonstration equipment programs, latihan pemasangan, and after-sales service coordination.
18.4 Global Export Services and Support
International business operations managed by experienced export staff handle all aspects of cross-border transactions including export documentation, customs compliance, freight forwarding coordination, and international payment arrangements. The company ships worldwide via air freight for urgent orders or ocean freight for economical delivery of large quantities, with door-to-door logistics services available to simplify the import process for customers.
Dokumentasi teknikal accompanies all products with multilingual user manuals, panduan pemasangan, gambar rajah pendawaian, dan prosedur pentauliahan. Global support includes remote technical assistance via email and video conference, on-site commissioning services for major projects, training programs conducted at customer facilities or INNO headquarters, and comprehensive warranty coverage with repair/replacement service coordinated through regional service centers.
Syarikat: Sains Elektronik Inovasi Fuzhou&Tech Co., Ltd.
E-mel:web@fjinno.net
telefon: +8613599070393
Alamat: Fuzhou, Wilayah Fujian, China
For inquiries regarding GIS monitoring systems, OEM/ODM partnerships, distribution opportunities, or technical specifications, please contact our international sales team. We look forward to supporting your GIS monitoring requirements with innovative, reliable solutions backed by comprehensive technical expertise and global service capabilities.

Sensor suhu gentian optik, Sistem pemantauan pintar, Pengeluar gentian optik yang diedarkan di China
 |
 |
 |