 سنسورهای دمای فیبر نوری INNO ,سیستم های نظارت بر دما.
- نظارت بر دما subsystem: Fiber optic sensors track winding hot spots and oil temperature in real-time
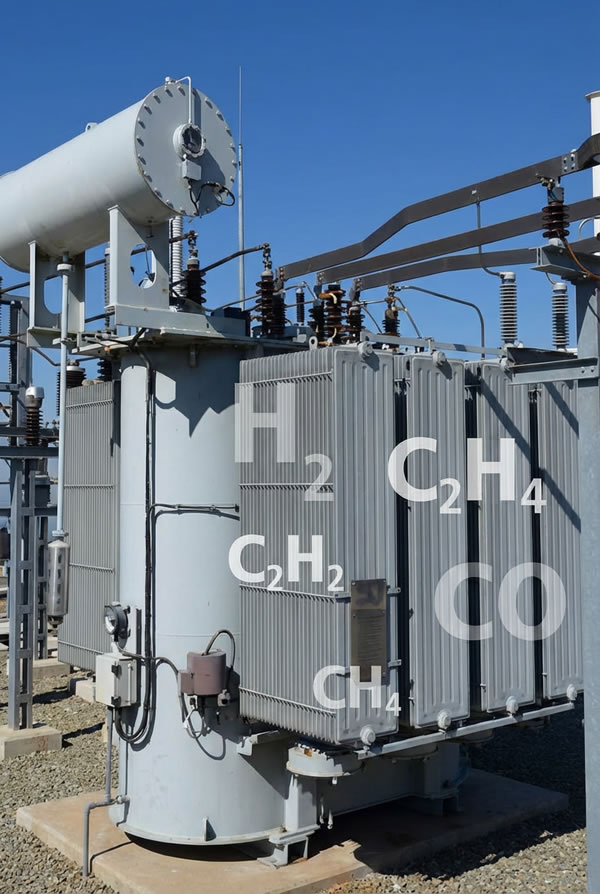
- تجزیه و تحلیل گازهای محلول (DGA) subsystem: Continuous monitoring of dissolved gas concentrations in transformer oil
- Partial discharge monitoring subsystem: UHF and acoustic sensors detect insulation defects
- Bushing monitoring subsystem: Measures capacitance, dissipation factor, و جریان را بزنید
- در بارگذاری روی تغییر ضربه بزنید (OLTC) monitoring subsystem: Analyzes vibration, timing sequences, و مقاومت تماسی
- واحدهای جمع آوری داده ها: Multi-channel synchronous sampling with local data buffering
- درگاه های ارتباطی: Support for Modbus, dnp3, و IEC 61850 پروتکل ها
- Analysis and diagnostics platform: Cloud-based or local server for data processing and health assessment
فهرست مطالب
1. Common Transformer Failure Types and Root Causes

خرابی ترانسفورماتور represent critical events that can cascade into widespread power outages, extensive equipment damage, and prolonged service disruptions. Understanding the primary failure mechanisms helps utilities implement effective online monitoring strategies that detect developing problems before catastrophic breakdowns occur.
شکست گرمای بیش از حد: تنش حرارتی و پیری عایق
خرابی های حرارتی تقریباً 30-35% از تمام خرابی های ترانسفورماتور, originating from various heat-related mechanisms. Excessive loading beyond nameplate ratings generates temperature rises that accelerate insulation aging through chemical decomposition of cellulose paper and mineral oil. Cooling system failures including blocked radiators, فن های خراب, or inadequate oil circulation create localized hot spots even under normal loading conditions. Poor electrical connections at bushing terminals, روی مخاطبین تغییر دهنده ضربه بزنید, or internal joints produce resistive heating that compounds thermal stress. The Arrhenius equation demonstrates that insulation life halves for every 6-8°C temperature increase above rated levels, making thermal management critical for transformer longevity.
Insulation Failures: Dielectric Breakdown Mechanisms
تخریب عایق represents 25-30% از خرابی ترانسفورماتور, manifesting through multiple deterioration pathways. Partial discharge activity in gas voids, oil bubbles, or interface boundaries progressively erodes solid insulation, creating carbonized tracking paths that eventually bridge high voltage and ground. Oil quality deterioration through oxidation, آلودگی, or moisture ingress reduces dielectric strength below critical thresholds. Moisture absorption into cellulose insulation lowers breakdown voltage while accelerating thermal aging rates. These mechanisms often develop gradually over months or years, providing opportunities for early detection through continuous monitoring.
خرابی های مکانیکی: Structural and Operational Issues
Mechanical problems constitute 15-20% از شکست ها, including winding displacement from short circuit forces, core bolt loosening causing excessive magnetostriction noise, and tap changer wear from repeated operations. Through-fault currents generate electromagnetic forces exceeding 100 برابر سطوح عملیاتی عادی, potentially shifting winding conductors and compromising insulation clearances. Tap changer mechanisms contain numerous moving parts subject to contact erosion, خستگی بهاری, and drive mechanism wear. Transportation damage, عیوب ساخت, or seismic events can initiate mechanical problems that worsen during operation.
Bushing Failures: High-Voltage Interface Vulnerabilities
Bushing breakdowns حساب برای 10-15% of transformer failures despite representing relatively small components. Moisture ingress through failed gaskets or breathing mechanisms contaminates the oil-paper insulation system, increasing dissipation factor and accelerating degradation. Manufacturing defects including voids, آلودگی, or improper curing create weak points susceptible to partial discharge activity. External contamination from salt spray, industrial pollution, or biological growth reduces surface insulation, potentially causing flashovers. Bushing failures often occur suddenly with minimal warning using conventional testing methods, making continuous monitoring particularly valuable.
Why Traditional Testing Methods Fall Short
دوره ای تست آفلاین performed annually or less frequently captures only momentary snapshots of transformer condition, missing transient events and gradual trends occurring between inspections. De-energization requirements create service interruptions while limiting testing frequency. Manual oil sampling introduces contamination risks and transportation delays before laboratory analysis. Seasonal variations in loading and temperature complicate trending when measurements occur at different times each year. Studies show that 30-40% of failures develop rapidly between scheduled tests, emphasizing the need for continuous surveillance.
2. Transformer Monitoring Sensor Types and Technologies

مدرن سیستم های نظارت بر ترانسفورماتور employ diverse sensor technologies, each optimized for specific measurement parameters. Understanding the operating principles, ویژگی های عملکرد, and application considerations helps system designers select appropriate sensors for comprehensive condition assessment.
سنسورهای دما: Optical vs Electrical Technologies
سنسورهای دمای فیبر نوری فلورسنت utilize rare-earth phosphors deposited at optical fiber tips, emitting temperature-dependent fluorescence when excited by LED pulses. The fluorescence decay time correlates precisely with temperature, achieving ±0.5°C accuracy across -50°C to +300°C ranges. Complete electromagnetic immunity eliminates noise-induced errors while intrinsic safety prevents spark risks in flammable atmospheres. Service life exceeds 25-30 years with zero drift or recalibration requirements.
فیبر براگ گریتینگ (FBG) حسگرها employ wavelength-selective reflectors inscribed in optical fibers, with reflection wavelength shifting proportionally to temperature and strain. Multiple FBG sensors multiplex on single fiber strands, enabling distributed measurements. Accuracy typically reaches ±1°C with excellent long-term stability. اما, strain sensitivity requires careful mechanical mounting to isolate thermal expansion effects.
آشکارسازهای دمای مقاومتی (RTS) measure temperature through platinum element resistance changes, offering good accuracy (±0.5°C with Pt100 elements) و ثبات. اما, electrical connections introduce electromagnetic interference susceptibility, requiring shielded cables and careful grounding. Spark risks necessitate intrinsically safe barriers in hazardous areas. Lead wire resistance creates measurement errors unless four-wire configurations compensate.
| نوع سنسور | دقت | زمان پاسخ | ایمنی EMI | زندگی | ایمنی ذاتی |
|---|---|---|---|---|---|
| فیبر نوری فلورسنت | 0.5 درجه سانتیگراد | 1-2 ثانیه | کامل | 25-30 سال | بله |
| فیبر براگ گریتینگ | ± 1.0 درجه سانتیگراد | 0.1-1 دوم | کامل | 20-25 سال | بله |
| RTD (Pt100) | 0.5 درجه سانتیگراد | 5-15 ثانیه | مستعد | 10-15 سال | نیاز به موانع دارد |
| ترموکوپل | ± 2.0 درجه سانتی گراد | 1-5 ثانیه | مستعد | 5-10 سال | نیاز به موانع دارد |
Gas Sensors: فناوری های نظارت DGA
طیف سنجی فوتو آکوستیک (نه) حسگرها detect gas concentrations through acoustic waves generated when modulated infrared light excites gas molecules. Multi-wavelength systems simultaneously measure hydrogen, متان, اتیلن, استیلن, مونوکسید کربن, and carbon dioxide with detection limits below 1 ppm. Minimal consumables and automatic self-calibration provide maintenance-free operation for 2-3 years between service intervals.
Gas chromatography systems separate dissolved gases through carrier gas circulation and molecular sieve columns, injecting samples into thermal conductivity or flame ionization detectors. Laboratory-grade accuracy (±5% or ±2 ppm) enables precise fault diagnosis. اما, carrier gas cylinders require periodic replacement, and complex pneumatic systems need regular maintenance.
Electrochemical sensors generate current proportional to gas concentration through oxidation-reduction reactions at electrode surfaces. Low-cost and compact designs suit basic hydrogen monitoring applications. Limited selectivity, shorter service life (1-3 سال), and sensitivity drift require frequent calibration compared to optical methods.
سنسورهای تخلیه جزئی: Electrical and Acoustic Detection
فرکانس فوق العاده بالا (UHF) آنتن ها capture electromagnetic waves in 300 مگاهرتز به 3 GHz range generated by PD pulses. Internal sensors installed through oil drain valves or external antennas mounted on viewing windows detect discharge activity with excellent sensitivity while rejecting low-frequency interference. Signal processing algorithms classify discharge patterns and track severity trends.
سنسورهای انتشار آکوستیک detect ultrasonic waves (20-300 کیلوهرتز) propagating through oil and tank walls from discharge sites. Piezoelectric accelerometers or acoustic waveguides convert pressure waves into electrical signals. Multi-sensor arrays enable triangulation algorithms calculating PD source locations within ±10 cm accuracy. Combined electrical-acoustic systems leverage complementary strengths for both sensitivity and localization.
ترانسفورماتورهای جریان فرکانس بالا (HFCTs) clamp around grounding conductors, measuring transient currents flowing during discharge events. نصب غیر مزاحم بدون تغییرات بوش، کاربردهای مقاوم سازی را ساده می کند. حساسیت به پیکربندی زمین ترانسفورماتور و محل تخلیه نسبت به نقاط اندازه گیری بستگی دارد.
سنسورهای الکتریکی: ظرفیت و اندازه گیری جریان
تقسیم کننده های ولتاژ خازنی به شیرهای تست بوشینگ متصل شوید, ظرفیت اندازه گیری (C1) و عامل اتلاف (tan δ) وضعیت عایق را نشان می دهد. پل های خازنی با دقت بالا به دست می آورند 0.1 وضوح pF روندهای تخریب ظریف را تشخیص می دهد. نظارت مستمر در طول زمان تغییر می کند, ارائه ماه ها هشدار قبلی قبل از خرابی های بحرانی.
ترانسفورماتورهای جریان اندازه گیری جریان های شیری که از ساختارهای خازن بوش می گذرد, نشان دهنده رفتار عایق غیرعادی است. سیمپیچهای روگوفسکی یا سیتیهای نوع هسته، اندازهگیری دقیق جریان را در محدودههای فرکانس وسیع ارائه میکنند. Comparing tap current against applied voltage variations distinguishes load-related changes from genuine insulation problems.
Mechanical Sensors: Vibration and Motion Detection
Piezoelectric accelerometers mounted on OLTC tanks capture mechanical vibration signatures during tap change operations. Frequency domain analysis from 10 Hz to 10 kHz identifies abnormal patterns associated with worn components, ناهماهنگی, or inadequate lubrication. Three-axis sensors detect vibration in multiple directions for comprehensive mechanical assessment.
Displacement transducers measure linear or rotary motion of tap changer drive mechanisms, verifying proper operation sequences and detecting mechanical binding. Inductive or optical encoders provide position feedback enabling timing analysis and operation counting. Integration with motor current monitoring creates complete OLTC condition assessment systems.
3. زمان واقعی مانیتورینگ دما: First Line of Defense Against Overheating

نظارت بر دما forms the foundation of transformer condition assessment, directly correlating with insulation aging rates, ظرفیت بارگیری, and thermal fault detection. Continuous surveillance enables operators to optimize loading while preventing damaging overheating events that accelerate equipment degradation.
Winding Hot Spot Temperature Tracking
نظارت بر نقاط داغ focuses on critical winding locations experiencing maximum thermal stress, typically upper disc regions of high-voltage windings where heat generation concentrates and cooling effectiveness diminishes. Direct measurement via embedded پروب های فیبر نوری provides accurate readings superior to indirect calculations based on top-oil temperature and load current. IEEE C57.91 loading guide calculations involve numerous assumptions about cooling efficiency, winding geometry, and thermal time constants that introduce 10-15°C uncertainty in hot spot estimates. Continuous hot spot data enables precise loading decisions, preventing insulation damage while maximizing asset utilization during peak demand periods.
سنسور دمای فیبر نوری مزایا
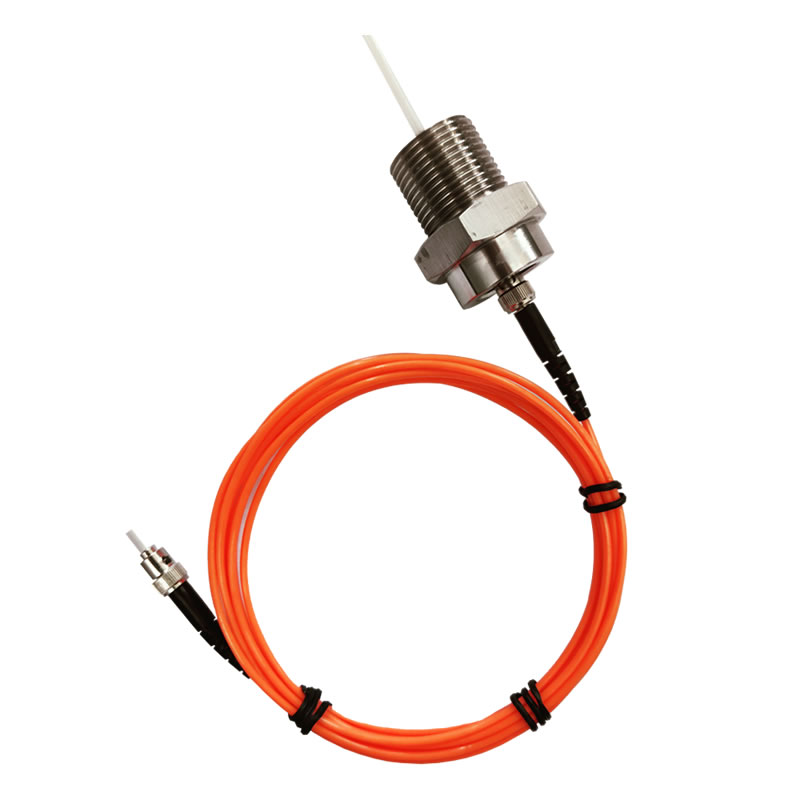
سنسورهای فیبر نوری فلورسنت deliver multiple advantages over conventional temperature measurement technologies. Complete electromagnetic immunity eliminates noise-induced measurement errors common in high-voltage environments where strong electromagnetic fields interfere with electrical sensors. Intrinsic safety with zero electrical energy at sensor tips prevents spark ignition risks, enabling direct installation in flammable oil without special barriers or certifications. The dielectric nature of optical fibers allows direct contact with high-voltage conductors without compromising electrical insulation or introducing measurement errors. Long-term stability with zero drift ensures consistent accuracy throughout 25-30 year service life without recalibration requirements that complicate maintenance scheduling.
Multi-Point Temperature Distribution Monitoring
جامع سیستم های نظارت بر دما به طور معمول نصب کنید 12-18 measurement points covering critical locations including top-oil, bottom-oil, multiple winding hot spots at different heights and phases, سطوح هسته, and tank walls. This distributed approach enables thermal mapping revealing cooling system effectiveness, identifying localized hot spots from circulating currents or blocked oil flow, and detecting asymmetric heating between phases indicating electrical imbalances. Advanced visualization displays color-coded temperature distributions, making thermal anomalies immediately apparent to operators reviewing system dashboards.
Temperature Gradient Analysis
Temperature gradient monitoring between top-oil and bottom-oil measurements indicates cooling system performance, with excessive gradients suggesting radiator fouling, راه های نفت مسدود شده است, or inadequate pump flow. Comparing oil temperature rise against loading profiles helps identify heat exchanger degradation before catastrophic cooling failures occur. Winding-to-oil temperature differences reveal insulation thermal resistance changes from aging, ورود رطوبت, or contamination affecting heat transfer characteristics.
Early Warning Case Example
A 230 kV substation transformer equipped with نظارت بر زمان واقعی دما displayed gradual hot spot temperature increases over three months despite stable loading patterns. Investigation revealed blocked oil flow from deformed pressboard barriers partially obstructing cooling ducts. Planned maintenance during a scheduled outage cleared the obstruction, preventing catastrophic winding failure that would have required emergency transformer replacement during peak summer demand. The monitoring system provided sufficient advance warning enabling proactive intervention rather than reactive emergency response.
4. تجزیه و تحلیل آنلاین گاز محلول: Detecting Internal Faults Early
نظارت DGA represents the most sensitive diagnostic technique for detecting incipient electrical and thermal faults in oil-filled transformers. Continuous gas analysis captures evolving fault conditions months or years before conventional annual testing would identify problems, enabling intervention when corrective actions remain cost-effective.

Gas-Fault Relationships: امضاهای تشخیصی
Different fault mechanisms generate characteristic dissolved gas patterns enabling precise fault classification. هیدروژن (H2) indicates partial discharge or corona activity in oil-filled voids or at sharp edges, with concentrations above 100 ppm warranting investigation. متان (CH4) and ethane (C2H6) suggest low-temperature thermal decomposition below 300°C from loose connections or core heating. اتیلن (C2H4) signals moderate thermal faults between 300-700°C often associated with circulating currents or localized overheating. استیلن (C2H2) indicates high-temperature arcing above 700°C, the most serious electrical fault requiring immediate attention. مونوکسید کربن (CO) و دی اکسید کربن (CO₂) reveal cellulose insulation degradation from overheating or aging, with elevated CO suggesting more severe thermal stress than CO₂ increases alone.
Continuous Monitoring vs Annual Oil Sampling
سیستم های DGA آنلاین deliver decisive advantages over periodic oil sampling approaches. Continuous surveillance captures rapidly developing faults occurring between scheduled tests, with studies showing 30-40% of failures developing within 6-month intervals between annual samplings. Automatic measurements every 30-60 minutes eliminate manual sampling errors from bottle cleanliness, atmospheric exposure, or transportation contamination. Real-time trending immediately flags accelerating gas generation rates indicating deteriorating conditions, whereas annual snapshots provide insufficient data points for reliable trend analysis. Elimination of sample transportation delays and laboratory turnaround times enables same-day fault detection rather than 1-2 week result delays that may allow faults to progress unchecked.
Key Gas Tracking and Trend Analysis
Continuous gas monitoring tracks absolute concentrations, نرخ تولید (ppm/day), and multi-gas ratios simultaneously. Absolute concentration thresholds from IEEE C57.104 and IEC 60599 standards trigger initial investigations, but generation rate analysis often provides earlier warning. Sudden increases in daily generation rates, even when absolute concentrations remain below alarm levels, indicate developing problems requiring investigation. Multi-gas trending identifies evolving fault patterns, such as hydrogen increases followed by ethylene generation suggesting partial discharge transitioning to thermal faults.
Automated Diagnostic Methods
مدرن DGA analysis platforms automatically apply diagnostic algorithms including Duval Triangle, راجرز نسبت, Dornenburg Ratios, و IEC 60599 Key Gas methods. The Duval Pentagon extends basic triangle analysis to classify additional fault types including thermal faults with oil contact (T3) and stray gassing. Automated calculations eliminate manual errors while flagging cases where different methods yield conflicting interpretations, alerting specialists to complex situations requiring expert review. Historical comparison against transformer-specific baselines accounts for individual unit characteristics, improving diagnostic accuracy compared to generic thresholds.
5. مانیتورینگ آنلاین تخلیه جزئی: Sensitive Indicator of Insulation Degradation
![]()
نظارت بر تخلیه جزئی detects insulation defects at early stages before progression to complete dielectric failure. PD activity indicates deteriorating insulation quality, آلودگی, ورود رطوبت, یا عیوب ساخت, making continuous surveillance essential for preventing catastrophic breakdowns in critical transformers.
Partial Discharge Mechanisms and Insulation Defects

ترشح جزئی occurs when localized electric field concentrations exceed insulation breakdown strength, causing transient current pulses and localized energy dissipation. Gas voids or bubbles within solid insulation or oil experience lower dielectric strength than surrounding materials, initiating repetitive discharges under normal operating voltages. Surface discharges along interfaces between insulation materials with different permittivity create tracking paths that gradually carbonize. Corona discharge at sharp edges or conductor points in oil generates gas bubbles and chemical decomposition. Each discharge mechanism produces characteristic electrical and acoustic signatures enabling pattern recognition and severity assessment.
UHF Detection Technology and Acoustic Localization
نظارت بر تخلیه جزئی UHF employs antennas sensitive to 300 MHz – 3 GHz electromagnetic radiation generated by nanosecond-duration discharge current pulses. Internal sensors installed through oil drain valves or magnetic core ground leads capture signals propagating through oil and metallic structures. External antennas mounted on dielectric viewing windows detect electromagnetic emissions through tank walls. Digital signal processing applies time-domain and frequency-domain analysis, extracting PD pulse characteristics from background noise. Pattern recognition algorithms compare measured signatures against discharge type databases, classifying activity as corona, تخلیه سطحی, یا حفره های داخلی.
تشخیص PD آکوستیک utilizes piezoelectric sensors mounted on transformer tank exterior surfaces, تشخیص انتشار امواج فراصوت (20-300 کیلوهرتز) from discharge sites. Acoustic waves propagate through oil and metal structures, attenuating with distance and frequency. Multi-sensor arrays positioned around tank perimeters enable triangulation algorithms calculating PD source three-dimensional coordinates. Time-difference-of-arrival calculations combined with known acoustic velocities in oil (تقریبا 1400 اماس) و فولاد (5000 اماس) determine discharge locations within ±10 cm accuracy. Acoustic localization directs maintenance teams to specific internal components for targeted inspection or guides operational decisions about continued service.
Pattern Recognition and Discharge Classification
تخلیه جزئی حل شده در فاز (PRPD) تجزیه و تحلیل generates statistical distribution patterns correlating discharge activity with power frequency phase angle. Corona discharges typically concentrate near positive and negative voltage peaks, appearing as twin peaks in PRPD plots. Surface discharges generate asymmetric patterns favoring one voltage polarity. Internal void discharges show activity across wider phase ranges with magnitude increasing at voltage peaks. Machine learning algorithms trained on extensive PD databases automatically classify patterns, improving diagnostic consistency compared to subjective manual interpretation. Long-term trending tracks pattern evolution, identifying whether discharge activity remains stable, increases steadily, or responds to environmental factors like temperature and loading.
6. مانیتورینگ بوشینگ: جلوگیری از شکست های فاجعه بار

Bushing monitoring systems continuously track insulation condition of these critical high-voltage interfaces extending conductors through grounded transformer tanks. Despite representing small components, bushing failures account for 10-15% از تمام خرابی های ترانسفورماتور, often occurring with minimal warning using conventional testing approaches.
Capacitance and Dissipation Factor Measurement Principles
Capacitance and tan delta monitoring measures electrical properties of oil-paper condenser bushing insulation systems. ظرفیت (C1) between high-voltage conductor and capacitance tap reflects overall insulation geometry and dielectric constant, with increases indicating moisture contamination or insulation swelling. Power factor or dissipation factor (tan δ) represents ratio of resistive losses to capacitive current, quantifying insulation quality. Increasing power factor suggests insulation degradation through aging, ورود رطوبت, یا آلودگی. Modern monitoring systems achieve 0.1 pF capacitance resolution and 0.001 tan delta accuracy, detecting subtle changes months before critical thresholds.
Tap Current Monitoring and Fault Indication
Tap current measurement tracks current flowing through bushing capacitance tap connections during normal operation. Abnormal current levels or sudden changes indicate developing insulation problems, آلودگی رطوبتی, یا عیوب داخلی. Temperature-compensated analysis distinguishes load-related variations from genuine insulation degradation. Multi-bushing monitoring enables comparative analysis between phases, identifying outlier units requiring investigation.
Advance Warning Timeframes
Field experience demonstrates that نظارت بر وضعیت بوش typically provides 6-12 months advance warning before critical failures. Gradual degradation patterns enable planned bushing replacements during scheduled maintenance outages, preventing unplanned failures that cause extensive collateral damage to transformer tanks, internal components, and adjacent equipment from explosive failures and oil fires.
7. On-Load Tap Changer Condition Monitoring
مانیتورینگ OLTC tracks mechanical and electrical condition of voltage regulation mechanisms containing numerous moving parts, مخاطبین, and insulating oil. These complex systems require more frequent maintenance than static transformer components, making condition monitoring valuable for optimizing service intervals and preventing failures.
Mechanical Vibration Analysis and Fault Signatures
نظارت بر لرزش installs accelerometers on OLTC tanks, capturing mechanical signatures during tap change operations. Normal operation generates repeatable vibration patterns in time and frequency domains. Abnormal signatures indicate specific mechanical problems: increased low-frequency vibration suggests loose components or worn bearings, high-frequency content indicates contact bounce or arcing, and timing shifts reveal drive mechanism wear or inadequate motor torque. Comparison against baseline signatures from commissioning or previous measurements flags developing problems requiring investigation.
Operation Counting and Timing Analysis
شمارنده های عملیات track cumulative tap changes and position distributions, supporting maintenance scheduling based on manufacturer-specified service intervals typically ranging from 50,000 به 200,000 operations depending on OLTC design. Detailed operational history including date, زمان, initial position, final position, and motor current for each tap change enables reliability analysis and correlation with external factors like temperature, در حال بارگذاری, or power quality events. Timing measurements verify proper sequence execution, with deviations indicating mechanical binding or control circuit problems.
Dynamic Resistance Measurement Technology
Dynamic resistance measurement (DRM) injects DC current through OLTC main contacts during switching operations, measuring transient contact resistance in real-time. Increasing resistance indicates contact erosion, تجمع کربن, یا فشار تماس ناکافی. This technique detects contact degradation before overheating or complete failure occurs, enabling timely contact replacement or refurbishment. Integration with vibration and timing analysis provides comprehensive OLTC condition assessment.
8. How Real-Time Data Enables Predictive Maintenance
استراتژی های پیش بینی تعمیر و نگهداری leverage continuous monitoring data to transition from reactive failure response and time-based preventive schedules toward condition-based interventions optimizing maintenance timing and resource allocation. This transformation improves asset reliability while reducing unnecessary maintenance activities on healthy equipment.
From Reactive to Proactive Asset Management
سنتی reactive maintenance responds to failures after occurrence, accepting unplanned outages, خسارت جانبی, و هزینه های تعمیرات اضطراری. Time-based preventive maintenance performs routine service at fixed intervals regardless of actual equipment condition, wasting resources on unnecessary maintenance while potentially missing rapidly developing faults between scheduled activities. نگهداری پیش بینی کننده uses continuous monitoring data to identify developing problems at early stages when corrective actions remain straightforward and cost-effective, scheduling interventions based on actual condition rather than arbitrary timeframes or catastrophic failures.
Multi-Parameter Data Fusion and Correlation
Integrated analysis examines relationships between monitoring parameters, revealing failure mechanisms invisible through single-parameter assessment. Rising DGA hydrogen combined with increasing partial discharge activity suggests progressing insulation degradation requiring investigation. Temperature increases disproportionate to loading indicate cooling system problems or internal hot spots. Simultaneous changes in multiple parameters provide higher diagnostic confidence than isolated parameter variations that might reflect measurement noise or benign operational changes.
Fault Progression Curves and Intervention Timing
Fault development typically follows predictable progression patterns with exponential acceleration as damage accumulates. Early-stage detection during gradual development phases provides 6-18 months for planning interventions during scheduled outages. Delayed detection during accelerating phases may provide only weeks or days before catastrophic failure. Optimal intervention timing balances failure risks against maintenance costs, often occurring when projected failure probability within 12 months exceeds acceptable thresholds. Economic analysis weighs planned maintenance expenses against expected failure costs including emergency repairs, خسارت جانبی, and outage impacts.
9. سیستم های هشدار اولیه: Multi-Level Alarm Mechanisms
سیستم های مدیریت آلارم translate continuous monitoring data into actionable notifications enabling timely operator response. Sophisticated algorithms reduce false alarms while ensuring critical conditions receive appropriate attention through multiple notification channels and escalation procedures.
آستانه, روند, and Predictive Alarms
Threshold alarms trigger when measured parameters exceed predefined absolute limits derived from standards like IEEE C57.91 for temperature or IEEE C57.104 for DGA concentrations. Multi-level thresholds implement warning and critical stages, providing escalating urgency as conditions deteriorate. Trend alarms analyze parameter rates-of-change, flagging rapid increases even when absolute values remain below threshold limits. Accelerating gas generation rates or temperature rises exceeding expected levels for loading conditions indicate developing problems requiring investigation. آلارم های پیش بینی کننده employ mathematical models projecting parameter trajectories, alerting operators when forecasts predict threshold violations within specified timeframes enabling proactive intervention before critical conditions develop.
Intelligent Alarm Filtering and False Alarm Reduction
Smart alarm algorithms reduce nuisance alerts through multiple filtering techniques. Dead-band hysteresis prevents alarm chatter from measurements oscillating around threshold levels. Time delays require sustained threshold violations before triggering notifications, filtering transient spikes from measurement noise or momentary operational events. Contextual analysis considers multiple parameters simultaneously, suppressing isolated alarms contradicted by other indicators. Machine learning models trained on historical alarm data identify chronic false alarm sources, automatically adjusting sensitivity to maintain high detection reliability while minimizing false positives that erode operator confidence.
Three-Tier Alarm Classification
Hierarchical alarm structures categorize notifications into information, هشدار, and critical levels based on severity and response urgency. Informational advisories indicate parameter deviations from normal ranges requiring awareness but not immediate action, such as gradual temperature increases during seasonal loading changes. Warning alarms signal developing problems requiring investigation and monitoring intensification, like slowly increasing DGA gas concentrations or partial discharge activity levels. Critical alarms demand immediate response for conditions threatening equipment safety or requiring prompt operational actions, including rapid temperature rises, sudden gas generation, or protection system actuations.
Multi-Channel Notification Systems
Notification delivery employs multiple communication channels ensuring operators receive critical alerts regardless of location or circumstances. Mobile applications send push notifications to smartphones and tablets with alarm details, measured values, و نمودارهای روند. SMS text messages provide backup notification for critical alarms when data connectivity limitations prevent app notifications. Email alerts deliver comprehensive alarm summaries with attached data files and diagnostic reports. Visual and audible annunciation in control rooms alerts on-duty personnel. Escalation procedures automatically notify supervisory personnel when alarms remain unacknowledged beyond specified timeframes, ensuring critical conditions receive timely attention.
10. Real-World Cases: Transformers Saved by Real-Time Monitoring
مطالعه موردی 1: DGA Monitoring Detects Internal Overheating
A 345 kV power transformer at a major transmission substation equipped with مانیتورینگ آنلاین DGA displayed steadily increasing ethylene concentrations over two months, rising from baseline 15 ppm to 85 ppm while other gases remained stable. The ethylene generation pattern indicated thermal decomposition around 450-500°C, suggesting localized overheating within the transformer. Internal inspection during a planned outage revealed deteriorated insulation on a high-voltage lead connection to the tap changer selector switch. The poor connection created resistive heating that would have progressed to complete failure within weeks. Timely detection enabled repair during scheduled maintenance, avoiding catastrophic failure during peak winter loading that would have required emergency transformer replacement and extended customer outages.
مطالعه موردی 2: Partial Discharge Monitoring Prevents Bushing Failure
A 230 kV transformer’s UHF partial discharge monitoring system detected increasing PD activity over three months, with discharge magnitude growing from background levels to 5000 pC. Acoustic localization triangulated the discharge source to the high-voltage bushing region. Correlation between electrical UHF signals and acoustic emissions confirmed genuine PD activity rather than external interference. Bushing electrical testing revealed increasing power factor from normal 0.5% to concerning 2.8%, confirming insulation degradation. Bushing replacement during a scheduled maintenance window prevented explosive failure that typically causes extensive collateral damage to transformer tanks, adjacent bushings, and surrounding equipment.
مطالعه موردی 3: Temperature Monitoring Prevents Winding Damage

A 138 kV distribution substation transformer’s مانیتورینگ دمای فیبر نوری showed winding hot spot temperature climbing to 135°C under 85% در حال بارگذاری, approximately 20°C higher than expected for the load level. Investigation revealed a malfunctioning cooling fan reducing heat dissipation capacity. Temporary load reduction prevented insulation damage while replacement fans were expedited. Post-repair temperature measurements confirmed return to normal thermal performance. The monitoring system prevented accelerated insulation aging that would have reduced transformer service life by an estimated 5-10 years if the cooling deficiency remained undetected.
11. SCADA System Integration and Automated Control
ادغام SCADA enables transformer monitoring systems to participate in utility-wide control and data acquisition infrastructure, providing operators with consolidated visibility across geographically distributed assets while supporting automated protection and control responses.
Standard Communication Protocol Support
سازگاری پروتکل ensures seamless integration with existing utility automation systems. Modbus RTU/TCP provides simple register-based data exchange suitable for basic monitoring applications, mapping temperature readings, DGA concentrations, and alarm states to configurable register addresses. dnp3 (پروتکل شبکه توزیع شده 3) offers robust master-slave communications with event buffering, همگام سازی زمان, and secure authentication commonly deployed in North American utilities. IEC 61850 implements object-oriented information models specifically designed for substation automation, enabling sophisticated interoperability between protection, کنترل کردن, and monitoring systems through Manufacturing Message Specification (MMS) خدمات. Protocol conversion gateways translate between monitoring system native formats and utility-specified protocols, accommodating diverse legacy and modern SCADA architectures.
Data Mapping and Register Configuration
SCADA data points require careful mapping between monitoring system measurements and utility register assignments. Configurable scaling factors convert engineering units (درجه سانتیگراد, ppm, pC) to SCADA system conventions. Status points represent alarm conditions, communication health, and system operational states through binary indicators. Analog points convey continuous measurements with appropriate resolution and update rates. Event sequence-of-events recording captures alarm transitions with millisecond timestamps supporting post-incident analysis. Comprehensive documentation specifying register assignments, scaling factors, alarm mappings, and communication parameters ensures consistent configuration across monitoring points and SCADA master stations.
Automated Load Transfer and Emergency Control
Automated control sequences respond to critical monitoring conditions without operator intervention, improving response speed and consistency. High-temperature alarms trigger automatic cooling system activation, starting backup fans or pumps to increase heat dissipation. Severe fault indications initiate automatic load transfers to alternate transformers, preventing equipment damage while maintaining service continuity. Protection system integration enables monitoring-based tripping for rapidly developing faults detected by DGA or partial discharge systems before conventional protection relays respond. Programmable logic implements sophisticated control algorithms considering multiple parameters, شرایط بارگذاری, and system operating states when executing automated responses.
Control Center Interface Customization
Operator displays present transformer monitoring data in intuitive formats matching utility preferences and operational workflows. Single-line diagrams overlay real-time temperatures, غلظت گاز, and alarm status on substation geographic displays. Multi-parameter trend screens show correlated parameter evolution over user-selectable time ranges from hours to years. Tabular fleet views summarize conditions across multiple transformers, enabling rapid identification of assets requiring attention. Customizable color-coding applies green/yellow/red health indicators based on condition severity. Geographic information system (GIS) ادغام وضعیت سلامت ترانسفورماتور را بر روی نقشه های کل سیستم نمایش می دهد, حمایت از برنامه ریزی استراتژیک و تصمیمات تخصیص منابع.
12. Comprehensive Online Monitoring System Architecture
معماری سیستم برای پیاده سازی نظارت ترانسفورماتور از طرح های سلسله مراتبی پیروی می کند که شبکه های حسگر را جدا می کند, اکتساب داده, زیرساخت ارتباطی, و لایه های کاربردی. این رویکرد ساختاری مقیاس پذیری را امکان پذیر می کند, حفظ قابلیت, و ادغام با سیستم های سازمانی ابزار.
معماری سلسله مراتبی چهار لایه
این لایه حسگر شامل دستگاه های اندازه گیری نصب شده در میدان از جمله سنسورهای دما است, آنالایزرهای DGA, آشکارسازهای تخلیه جزئی, مانیتورهای بوشینگ, و تشخیص OLTC. انتخاب سنسور الزامات دقت را در نظر می گیرد, شرایط زیست محیطی, محدودیت های نصب, و دسترسی به تعمیر و نگهداری. سنسورهای اضافی روی پارامترهای حیاتی، تحمل خطا را فراهم می کنند, اطمینان از نظارت مستمر در صورت خرابی سنسورهای فردی.
این لایه اکتساب از متمرکز کننده های داده محلی یا واحدهای پایانه راه دور استفاده می کند (RTU ها) انجام تبدیل آنالوگ به دیجیتال, پردازش سیگنال دیجیتال, و تجزیه و تحلیل داده های اولیه. Multi-channel input modules accommodate diverse sensor types with appropriate signal conditioning. Local processing implements filtering algorithms, threshold checking, و تولید آلارم. On-board data buffering stores 30-90 days of measurements, protecting against communication outages or server failures. Ruggedized industrial hardware withstands substation electromagnetic environments and temperature extremes.
این لایه ارتباطی connects field devices to central servers using utility-standard networking infrastructure. Fiber optic links provide high-bandwidth, low-latency connections for substations with existing telecommunications infrastructure. Cellular LTE/5G modems enable monitoring at remote locations without fixed network connectivity. Satellite communications serve extremely remote installations where terrestrial options prove impractical. Virtual private networks (VPNs) and Transport Layer Security (TLS) encryption protect data confidentiality and integrity during transmission. Redundant communication paths using diverse technologies ensure continued data flow during network disruptions.
این لایه کاربردی hosts centralized monitoring servers, database systems, analytics platforms, and operator interfaces. Scalable database architectures handle millions of daily measurements while maintaining sub-second query response times. Web-based dashboards provide browser access without client software installation requirements. Advanced analytics extract insights through statistical analysis, یادگیری ماشین, and comparative fleet studies. Enterprise integration modules exchange data with asset management, outage management, and maintenance planning systems.
Local Data Acquisition and Edge Computing
Edge computing capabilities at data acquisition units enable intelligent local processing, reducing communication bandwidth requirements while improving system responsiveness. Local alarm evaluation generates immediate notifications without round-trip delays to central servers. Compression algorithms reduce data volumes by 70-90% through lossless encoding and selective transmission strategies sending detailed waveforms only during alarm conditions while summarizing steady-state periods. Predictive analytics models run at edge devices, calculating health indicators and remaining life estimates locally. This distributed intelligence architecture maintains critical monitoring functions during temporary communication outages while reducing central server computational loads.
Diagnostic Software Core Algorithms
نرم افزار تجزیه و تحلیل implements diverse diagnostic algorithms specific to each monitoring parameter. Temperature analysis applies thermal models calculating insulation aging acceleration factors based on measured hot spot temperatures and loading histories. DGA diagnostics automatically execute multiple interpretation methods including Duval Triangle, راجرز نسبت, و IEC 60599 استانداردها, flagging discrepancies between methods for expert review. Partial discharge pattern recognition classifies discharge types through machine learning models trained on extensive databases correlating patterns with confirmed defect types. Multi-parameter correlation engines identify relationships between parameters, improving diagnostic accuracy beyond individual parameter assessment.
Reporting and Visualization Capabilities
Reporting modules generate automated summaries at configurable intervals, delivering daily operations reports, weekly trend analyses, monthly condition assessments, and annual fleet health reviews. Customizable templates accommodate utility-specific formats and content requirements. Interactive visualizations enable exploratory data analysis through drag-and-drop interfaces building custom charts without programming expertise. Downloadable data exports in CSV, اکسل, or PDF formats support offline analysis and regulatory reporting requirements. Historical playback features recreate past operating conditions, supporting incident investigations and lessons-learned analyses.
13. سوالات متداول: سیستم های مانیتورینگ ترانسفورماتور
Transformer Temperature Monitoring Questions
How is a transformer temperature monitoring system installed? Does it require a transformer outage?
Installation requirements depend on sensor types and mounting locations. External temperature sensors monitoring top-oil, bottom-oil, and ambient conditions install without transformer de-energization using thermowells or surface-mounted probes. داخلی fiber optic winding sensors typically require brief outages for installation through existing oil sampling valves, دریچه های بازرسی, or specially provided ports. Modern retrofit designs minimize outage duration to 2-4 hours for complete multi-point installations. Some utilities coordinate sensor installation with scheduled maintenance outages, eliminating dedicated outage requirements. Non-intrusive infrared monitoring provides limited external temperature assessment without any outage, though accuracy and coverage cannot match direct measurement approaches.
What advantages do fiber optic temperature sensors offer compared to traditional thermometers?
سنسورهای فیبر نوری deliver multiple compelling advantages. Complete electromagnetic immunity eliminates measurement errors from strong electromagnetic fields surrounding high-voltage equipment that severely affect electrical temperature devices. Intrinsic safety without electrical energy at sensor tips prevents spark ignition risks, allowing direct installation in flammable oil without special certifications or barriers. Dielectric optical fibers enable direct contact with high-voltage conductors measuring true winding temperatures rather than indirect oil temperature estimates. دقت برتر (0.5 درجه سانتیگراد) و وضوح (0.1درجه سانتیگراد) exceed conventional resistance thermometer capabilities. Zero long-term drift eliminates recalibration requirements throughout 25-30 سال عمر مفید. Lightning strike immunity prevents sensor damage from transient overvoltages that destroy electrical sensors requiring costly replacements.
What temperature levels indicate abnormal transformer operation? How should alarm thresholds be configured?
Alarm thresholds depend on transformer design, شرایط بارگذاری, and cooling methods. IEEE C57.91 loading guide recommends maximum hot spot temperatures of 110°C for normal life expectancy under continuous loading, 120°C for moderate life reduction, and 140°C absolute maximum for emergency loading. Top-oil temperatures typically maintain 15-25°C below hot spot values depending on cooling effectiveness. سیستم های مانیتورینگ دما implement multi-level alarms: informational alerts at 90-95°C hot spot indicating elevated but acceptable temperatures, warnings at 105-110°C suggesting investigation of loading or cooling, and critical alarms at 120-130°C requiring immediate load reduction or enhanced cooling. Temperature rise rates provide additional alarm criteria, with rapid increases exceeding 5-10°C per hour indicating developing problems even when absolute temperatures remain below static thresholds. Seasonal adjustments account for varying ambient temperatures affecting acceptable operating temperatures.
How far in advance can temperature monitoring detect overheating faults before equipment damage occurs?
Early warning timeframes vary with fault mechanisms and development rates. Gradual cooling system degradation from fouled radiators or failing fans produces slowly increasing temperatures providing weeks to months of advance notice. Sudden cooling failures generate rapid temperature rises detectable within hours but requiring immediate response. Internal hot spots from loose connections or blocked oil flow typically develop over days to weeks, providing sufficient warning for planned interventions. نظارت مستمر با 1-5 minute measurement intervals captures temperature dynamics, enabling early detection during initial fault development stages when corrective actions remain straightforward.
Transformer Monitoring System Questions
What components comprise a complete transformer online monitoring system?
جامع سیستم های نظارت integrate multiple subsystems addressing different diagnostic parameters. Temperature monitoring employs fiber optic or resistance sensors measuring winding hot spots, روغن بالا, bottom-oil, و شرایط محیطی. DGA analysis continuously samples dissolved gases indicating internal electrical and thermal faults. Partial discharge detection uses UHF and acoustic sensors identifying insulation defects. Bushing monitors measure capacitance, dissipation factor, and tap currents tracking insulation condition. OLTC diagnostics analyze mechanical vibration, زمان بندی عملیات, و مقاومت تماسی. Supporting infrastructure includes data acquisition units performing analog-to-digital conversion and signal processing, communication gateways connecting field devices to central systems, and analytical software platforms providing data visualization, مدیریت زنگ, and diagnostic algorithms. منابع تغذیه, environmental enclosures, and cybersecurity measures complete operational systems.
How do distribution transformer and power transformer monitoring systems differ?
نظارت بر ترانسفورماتور توزیع emphasizes cost-effective solutions appropriate for numerous smaller units, often employing simplified sensor suites measuring temperature, جریان بار, and basic electrical parameters. Wireless communication and solar power reduce installation costs for pole-mounted or pad-mounted installations without AC power availability. نظارت بر ترانسفورماتور قدرت justifies comprehensive multi-parameter systems given higher individual asset values and grid criticality. Complete sensor suites including temperature, DGA, تخلیه جزئی, بوش, and OLTC monitoring address all major failure mechanisms. Redundant sensors and communication paths ensure continuous monitoring of critical assets. Sophisticated analytics and integration with utility enterprise systems support detailed condition assessment and strategic asset management decisions.
What data sampling rates do monitoring systems employ for different parameters?
Sampling intervals vary based on parameter dynamics and diagnostic requirements. Temperature measurements typically sample at 1-5 minute intervals, balancing thermal time constant response with data storage efficiency. Faster sampling (10-60 ثانیه) may apply during load ramps or cooling system transients. سیستم های DGA analyze oil samples every 30-60 minutes depending on technology and gas types, with some advanced systems providing 15-minute updates for key gases. نظارت بر تخلیه جزئی continuously captures signals at 100 کیلوهرتز به 1 MHz sampling rates, but stores only statistical summaries and waveforms exceeding magnitude thresholds rather than complete continuous recordings. Bushing measurements sample at 5-15 minute intervals during normal conditions, potentially increasing to 1-minute intervals when degradation indicators appear. مانیتورینگ OLTC triggers on each tap change operation, recording complete vibration waveforms and electrical parameters throughout switching sequences.
What power supply options exist for monitoring system equipment?
Field devices require reliable power sources appropriate for installation environments. AC-powered systems connect to substation station service supplies (120/240 VAC) providing continuous power with battery backup for communication continuity during outages. DC-powered equipment operates from station battery systems (48/125 VDC) common in substations, offering excellent reliability and inherent backup capacity. Solar-powered monitoring suits remote locations without utility power, combining photovoltaic panels, ذخیره سازی باتری, and low-power electronics for multi-year autonomous operation. Current transformer power harvests energy from transformer load currents, enabling completely passive monitoring without external power requirements though output power limitations restrict sensor types and communication range. Power budgeting considers normal operation, انتقال ارتباط, and alarm conditions ensuring adequate capacity with appropriate margins.
DGA Oil Chromatography Monitoring Questions
What fault types can transformer dissolved gas analysis detect?
نظارت DGA identifies diverse electrical and thermal fault mechanisms through characteristic gas generation patterns. Partial discharge or corona produces primarily hydrogen with minor methane generation, indicating insulation voids, لبه های تیز, or floating components. Low-energy thermal faults below 300°C generate methane and ethane from oil decomposition, suggesting loose connections, گرمایش جریان گردابی, or core problems. Medium-temperature thermal faults between 300-700°C produce increasing ethylene concentrations, associated with localized overheating from circulating currents or blocked cooling. High-energy electrical arcing above 700°C generates acetylene, the most serious gas indicating sustained arcing that rapidly damages insulation and conductors. Cellulose insulation overheating produces carbon monoxide and carbon dioxide, revealing paper insulation degradation from excessive temperatures or aging. Multi-gas pattern analysis discriminates between these fault types, guiding appropriate diagnostic investigations and maintenance actions.
Which approach provides more accurate results: online DGA monitoring or offline oil sampling with laboratory analysis?
هر دو رویکردهای نظارتی achieve comparable accuracy for individual measurements when properly executed, but continuous online monitoring delivers superior diagnostic capabilities. Modern online systems achieve ±10% accuracy or ±5 ppm whichever is greater for key gases, matching or exceeding laboratory analytical performance. Online monitoring’s decisive advantage lies in continuous trending capturing fault development dynamics, transient events occurring between periodic samples, and gas generation rates providing earlier fault detection than absolute concentrations alone. Laboratory analysis eliminates potential instrument drift and calibration errors through fresh standards with each test, but introduces sampling contamination risks, تاخیر در حمل و نقل, and result turnaround times extending 1-2 هفته ها. Offline sampling frequencies of 6-12 months prove inadequate for rapidly developing faults, whereas online surveillance detects problems within hours to days of onset. Combined approaches employing online monitoring for continuous surveillance with periodic laboratory analysis for verification and extended gas panels optimize diagnostic accuracy and reliability.
At what hydrogen concentration should operators investigate transformer condition?
Hydrogen thresholds vary with transformer design and operating history, but general guidance helps prioritize investigations. IEEE C57.104 suggests investigation when hydrogen exceeds 100 ppm in mineral oil transformers without on-load tap changers, though lower thresholds (50 ppm) may apply for critical transformers or units with problematic histories. مهمتر, hydrogen generation rates بیش از حد 50 ppm/month warrant investigation regardless of absolute concentrations, indicating active fault development. Sudden hydrogen increases following specific events like load changes, عملیات سوئیچینگ, or system disturbances require correlation analysis identifying cause-effect relationships. Hydrogen combined with other gases suggests specific faults: hydrogen plus ethylene indicates partial discharge transitioning to thermal faults, hydrogen with acetylene signals arcing conditions, hydrogen with carbon monoxide reveals cellulose insulation involvement. Individual transformer baselines established during normal operation provide better reference points than generic thresholds, with deviations from unit-specific patterns triggering investigations.
How should operators interpret DGA results? Which gases deserve primary attention?
موثر تفسیر DGA considers absolute concentrations, نرخ تولید, نسبت های گاز, and trending patterns holistically. Key gases requiring close attention include hydrogen (partial discharge indicator), استیلن (arcing indicator), اتیلن (moderate thermal fault indicator), and carbon monoxide (cellulose degradation indicator). Ratio analysis methods including Duval Triangle, راجرز نسبت, و IEC 60599 standards transform raw concentrations into fault classifications by calculating ratios between specific gas pairs. The Duval Triangle provides visual classification plotting acetylene-methane-ethylene coordinates into distinct fault zones. Gas generation rates calculated from consecutive measurements often provide earlier warning than absolute values, with accelerating rates indicating deteriorating conditions. Correlation with operational events, الگوهای بارگذاری, and temperature histories helps distinguish between genuine faults and benign operational effects. Multi-method approaches comparing different diagnostic techniques improve confidence, with agreement between methods supporting diagnoses while discrepancies flagging complex situations requiring expert review.
Partial Discharge Monitoring Questions
What is transformer partial discharge and why does it require monitoring?
ترشح جزئی represents localized electrical breakdown within insulation systems that does not completely bridge conductor-to-ground or conductor-to-conductor paths. These repetitive small discharges occur when local electric field concentrations exceed insulation dielectric strength, typically at manufacturing defects, contamination sites, moisture pockets, or design weaknesses. Each discharge event releases energy gradually eroding insulation through chemical decomposition, آسیب حرارتی, و استرس مکانیکی. Individual discharges cause minimal immediate damage, but millions of repetitive discharges over months to years progressively degrade insulation until complete breakdown occurs. Continuous monitoring detects PD activity at early stages when insulation damage remains limited and corrective actions may extend service life or enable planned replacement avoiding catastrophic failures. PD monitoring provides the most sensitive early warning available for insulation deterioration, often detecting problems years before conventional electrical testing reveals abnormalities.
What differences exist between UHF and ultrasonic partial discharge detection methods?
تشخیص UHF measures electromagnetic radiation in 300 MHz – 3 GHz range generated by rapid current pulses during discharge events. UHF sensors offer excellent sensitivity detecting low-magnitude discharges while rejecting external electromagnetic interference through frequency selectivity and shielding. Internal sensors installed through oil drain valves provide superior sensitivity compared to external antennas, though external mounting simplifies retrofit installations without transformer entry. UHF methods excel at detecting discharge presence and characterizing patterns but provide limited spatial localization without multiple sensor arrays.
Ultrasonic detection measures acoustic emissions in 20-300 kHz range from pressure waves generated by discharge energy release. Acoustic sensors mounted on tank exterior surfaces detect emissions propagating through oil and metal structures. Multi-sensor triangulation calculates discharge source three-dimensional coordinates with ±10 cm accuracy, precisely localizing problems within transformer volumes. اما, acoustic sensitivity depends on discharge location, with deep internal discharges producing weaker surface signals than near-surface activity. Acoustic signals attenuate with distance and frequency, potentially missing weak discharges in large transformers.
Integrated systems combining UHF electrical and ultrasonic acoustic detection leverage complementary strengths: UHF provides sensitive detection and pattern classification, while acoustic sensors enable spatial localization. Correlation between simultaneous electrical and acoustic signals confirms genuine partial discharge versus external interference, بهبود اطمینان تشخیصی.
At what partial discharge magnitude should transformers undergo maintenance?
Discharge magnitude thresholds depend on multiple factors including transformer voltage class, insulation design, discharge location, and pattern characteristics. IEC 60270 defines apparent charge in picocoulombs (pC) as standardized magnitude metric. General guidelines suggest investigation when discharge magnitudes exceed 1000 pC for distribution transformers or 5000 pC for transmission transformers, though these thresholds vary widely with specific circumstances. مهمتر, discharge trending provides better decision criteria than static thresholds: stable low-level activity may continue indefinitely without intervention, slowly increasing patterns warrant monitoring intensification and contingency planning, while rapidly accelerating discharge magnitudes require prompt action potentially including immediate de-energization for inspection or replacement. Discharge pattern types influence urgency, with internal void discharges generally more serious than corona activity. Location also matters, with discharges near ground plane or between phases more critical than discharges to floating shields or between winding sections. Correlation with other diagnostics including DGA, bushing tests, and insulation resistance measurements provides comprehensive assessment supporting maintenance timing decisions.
How can operators distinguish between genuine partial discharge signals and external electromagnetic interference?
موثر interference rejection employs multiple discrimination techniques. Frequency domain analysis reveals that genuine PD signals contain broad-spectrum content across megahertz ranges, while many interference sources concentrate energy at specific frequencies like radio broadcasts or power line carrier. Phase-resolved analysis correlates discharge activity with power frequency voltage phase, with genuine PD typically clustered near voltage peaks whereas random interference distributes uniformly across phase angles. Pulse shape analysis examines rise time, مدت, and decay characteristics, with true PD exhibiting sub-microsecond rise times and characteristic decay patterns differing from interference pulse shapes. Simultaneous multi-sensor measurements provide spatial correlation, with genuine internal discharges appearing across multiple sensors with appropriate time delays whereas external interference may appear simultaneously or only on sensors facing interference sources. Pattern recognition algorithms trained on confirmed PD databases automatically classify signals, flagging unusual characteristics for manual review. Combined electrical and acoustic detection provides definitive confirmation, since only genuine internal discharges generate both electromagnetic and acoustic emissions with correlated timing.
Bushing Monitoring Questions
Why do transformer bushings frequently fail despite being relatively simple components?
خرابی بوش occur disproportionately often because these components experience severe stresses despite their critical insulation function. Bushings must provide electrical insulation across large potential differences (hundreds of kilovolts to ground) while conducting high currents generating internal heating. Outdoor exposure subjects bushings to temperature cycling, رطوبت, آلودگی, and UV radiation accelerating material degradation. Mechanical stresses from conductor weight, ice loading, wind forces, and seismic events create additional vulnerabilities. Manufacturing defects including voids, آلودگی, or curing irregularities may not appear during factory testing but progressively worsen during service. Moisture ingress through failed gaskets or breathing mechanisms severely degrades oil-paper insulation systems. External contamination from industrial pollution or salt spray reduces surface insulation. The combination of electrical, گرمی, مکانیکی, and environmental stresses creates multiple failure pathways requiring continuous monitoring for early detection.
What problems does increasing bushing dissipation factor indicate?
در حال افزایش است dissipation factor (tan δ) signals deteriorating insulation quality through multiple mechanisms. Moisture contamination dramatically increases dielectric losses, with tan delta rising from normal 0.3-0.5% to concerning levels above 1-2% as moisture content exceeds 2-3%. Thermal aging breaks down insulation materials increasing resistive losses even without moisture. Partial discharge activity creates carbonized tracking paths providing lossy conduction routes through insulation. Oil contamination from particles or chemical degradation products elevates dielectric losses. هر کدام 0.5% increase in power factor typically correlates with significant insulation deterioration warranting investigation. Rapid increases over weeks to months indicate accelerating degradation requiring urgent attention, while gradual increases over years suggest normal aging processes. Temperature compensation proves essential since power factor varies with measurement temperature, with increases beyond temperature-corrected baselines indicating genuine problems rather than environmental effects.
What principle underlies bushing tap current monitoring?
Tap current monitoring measures current flowing through the capacitance tap connection used for voltage grading in condenser-type bushings. This current equals applied voltage multiplied by bushing capacitance and power factor. Under normal conditions with stable bushing capacitance and low power factor, tap current varies proportionally with applied voltage following predictable patterns. Abnormal tap current suggests capacitance changes from insulation degradation or power factor increases from dielectric losses. Monitoring systems compare measured tap current against expected values calculated from applied voltage and historical bushing characteristics. Deviations exceeding normal tolerances (typically ±10% of expected values) indicate developing problems. Advanced systems implement temperature compensation and voltage correction, isolating genuine insulation changes from benign environmental and operational variations. Trending over months to years reveals gradual degradation patterns, while sudden changes flag acute problems requiring immediate investigation.
How much advance warning does bushing monitoring typically provide before failure occurs?
Warning timeframes vary with degradation mechanisms and progression rates, but bushing monitoring typically provides 6-12 months notice before critical failures. Moisture-related degradation often develops gradually over 1-2 سال, with monitoring detecting problems when power factor increases reach 1-2%, long before values reach failure thresholds of 3-5%. This extended warning period enables planned bushing replacement during scheduled maintenance outages. Partial discharge-related failures may develop more rapidly over 3-6 ماه ها, requiring more frequent monitoring and prompt response once activity detection occurs. Manufacturing defects may remain dormant for years before rapid progression, with monitoring ideally detecting initial deterioration providing 6-12 month warning. Sudden failures from external flashovers, آسیب مکانیکی, or extreme contamination may provide minimal advance warning, though these represent minority failure modes. Continuous monitoring optimizes detection probability across all failure mechanisms, maximizing available warning time for proactive intervention.
OLTC Tap Changer Monitoring Questions
What parameters require monitoring in on-load tap changer systems?
جامع مانیتورینگ OLTC addresses mechanical, برق, و پارامترهای عملیاتی. Mechanical parameters include vibration signatures analyzed in time and frequency domains revealing drive mechanism condition, contact operation timing indicating proper sequence execution and identifying binding or excessive friction, motor current profiles showing drive motor loading throughout operation cycles, and acoustic emissions detecting abnormal impacts or grinding. Electrical parameters include contact resistance measured through dynamic resistance measurement revealing contact erosion or contamination, diverter switch arcing current indicating transition contact condition, and insulation resistance verifying adequate separation in open positions. Operational parameters include cumulative operation counters tracking maintenance interval compliance, position verification confirming proper voltage regulation, environmental conditions like oil level and quality affecting OLTC performance, and control circuit integrity ensuring reliable command execution. Multi-parameter correlation identifies developing problems through combined analysis rather than single-parameter assessment.
What typical characteristics indicate abnormal OLTC vibration patterns?
تجزیه و تحلیل ارتعاش identifies specific mechanical faults through signature recognition. Increased low-frequency content (زیر 100 هرتز) suggests loose mechanical components, سایش بلبرینگ, or inadequate drive motor torque. Elevated mid-frequency vibration (100-1000 هرتز) indicates contact bounce, mechanical impacts, یا قطعات نامناسب. High-frequency noise (بالا 1000 هرتز) reveals arcing, electrical breakdown, or contact problems during current transfer. Timing changes in vibration patterns relative to motor energization suggest drive mechanism wear, روغن کاری ناکافی, or mechanical binding. Amplitude increases across all frequencies indicate general mechanical deterioration requiring comprehensive inspection. Asymmetric patterns between raise and lower operations suggest directional problems like worn ratchets or one-way clutch issues. Comparison against commissioning baselines or previous measurements quantifies degradation progression, supporting maintenance timing decisions.
At what cumulative operation count do OLTCs require major maintenance?
Maintenance intervals vary significantly with OLTC design و توصیه های سازنده. Vacuum-type tap changers typically specify major overhauls at 100,000-300,000 عمل, with contact replacement often required at these intervals. Oil-immersed resistor-type designs may require major service at 50,000-100,000 operations due to contact wear and oil contamination from arcing. Diverter switch mechanisms using high-speed transitions with minimal arcing extend intervals to 200,000-400,000 operations before major overhaul. Beyond manufacturer specifications, condition monitoring data enables condition-based maintenance scheduling. Units showing stable vibration patterns, minimal contact resistance increase, and consistent timing may safely operate beyond nominal intervals, while units displaying degradation indicators require earlier service regardless of operation counts. Operation rate also influences maintenance timing: transformers averaging 10 operations daily reach service intervals much faster than units changing taps weekly. Environmental factors including loading severity, شرایط محیطی, and oil quality affect degradation rates necessitating flexible maintenance strategies informed by actual monitored condition rather than rigid operation-count thresholds alone.
How does dynamic resistance measurement identify contact problems?
Dynamic resistance measurement injects DC test current through OLTC main contacts during switching operations, measuring transient voltage drop and calculating instantaneous contact resistance throughout transition sequences. Normal contacts exhibit stable low resistance (به طور معمول 50-200 microohms) during closed periods with brief increases during transitions as current transfers through resistive elements or from one contact to another. Degraded contacts display increased steady-state resistance indicating erosion, تجمع کربن, یا فشار تماس ناکافی. Excessive resistance during transitions suggests diverter switch or transition resistor problems. Erratic resistance fluctuations reveal contact bounce or chattering indicating mechanical problems. Timing analysis showing prolonged high-resistance intervals suggests sluggish operation from binding or inadequate drive torque. Comparison between identical OLTC positions across multiple operation cycles quantifies consistency, with increasing variability indicating deteriorating mechanical condition. DRM testing occurs during normal voltage regulation operations without requiring transformer de-energization, enabling continuous contact condition assessment throughout service life. Trending over months to years reveals gradual contact wear, supporting proactive maintenance before failures occur.
System Integration and Application Questions
How do online monitoring systems interface with SCADA systems?
ادغام SCADA employs standard utility automation protocols enabling monitoring data exchange with control center systems. Monitoring systems implement protocol server functions responding to SCADA master station data requests. Modbus RTU/TCP provides simple register-based access mapping temperature readings, غلظت گاز, and alarm states to numbered registers accessible through read commands. DNP3 implementations define point lists with analog inputs for continuous measurements, binary inputs for alarm conditions, and event logging capturing alarm transitions with timestamps. IEC 61850 integrations model monitoring functions through standardized logical nodes with defined data objects, enabling sophisticated semantic interoperability. Gateway devices translate between monitoring system native protocols and utility SCADA requirements, accommodating diverse master station types. Configurable data mapping assigns monitoring parameters to specific SCADA points, applies scaling factors, and sets update intervals. Alarm integration forwards monitoring system alerts to SCADA alarm management, potentially triggering automated control responses or operator notifications through SCADA infrastructure.
How long are monitoring data retained and what storage capacity is required?
Data retention periods balance regulatory requirements, analytical needs, and storage economics. High-resolution raw data (1-5 minute intervals) typically stores for 30-90 days supporting recent trend analysis and short-term investigations. Hourly averaged data retains for 1-2 years enabling seasonal comparison and medium-term trending. Daily statistical summaries (حداقل, حداکثر, average) store indefinitely providing long-term historical context. Event-triggered high-speed waveforms from transient events retain for 5-10 years supporting incident investigations and forensic analysis. Storage requirements depend on monitoring scope and retention policies. A comprehensive power transformer monitoring system generating 100-200 data points every minute produces approximately 10-20 MB daily or 3-7 GB annually in uncompressed formats. Database compression reduces storage by 70-90% depending on data characteristics. Cloud storage costs have declined dramatically, making extended retention economically practical for most utilities. Local storage at monitoring system devices provides backup during communication outages, typically buffering 30-90 days before overwriting oldest data.
Can monitoring equipment from different manufacturers integrate into unified platforms?
Multi-vendor integration presents challenges but remains achievable through several approaches. Protocol standardization enables basic interoperability when vendors implement common protocols like Modbus, dnp3, یا IEC 61850 according to published specifications. اما, proprietary extensions, vendor-specific data models, and configuration variations complicate seamless integration. Gateway devices or middleware platforms translate between vendor-specific protocols and unified data models, aggregating data from diverse sources into consolidated databases. Some utilities maintain separate monitoring systems for different vendor equipment, accepting operational complexity to preserve vendor-specific features and support. Enterprise integration platforms provide vendor-neutral data collection and visualization, aggregating data from multiple monitoring systems through standard interfaces. Open-source monitoring frameworks enable custom integration development though requiring specialized expertise. When specifying new monitoring systems, utilities should prioritize open protocols, detailed protocol implementation documentation, and vendor commitment to standards compliance facilitating future integration flexibility. Practical multi-vendor integration typically achieves basic data collection and trending with limitations in advanced features like coordinated alarming or cross-system correlation analysis.
How are monitoring system cybersecurity risks addressed?
Cybersecurity measures protect monitoring systems against unauthorized access, data tampering, and denial-of-service attacks following NERC CIP standards and utility security policies. Network segmentation isolates monitoring systems from corporate networks and internet exposure, with firewalls controlling traffic between security zones. Virtual private networks (VPNs) encrypt remote access sessions preventing eavesdropping on monitoring data or credentials. Transport Layer Security (TLS) encrypts data in transit between field devices and central servers. Role-based access control restricts system functions to authorized personnel with audit logging tracking all access attempts and configuration changes. Secure authentication using strong passwords, multi-factor authentication, or certificate-based schemes prevents unauthorized login. Regular security patches and firmware updates address known vulnerabilities. Intrusion detection systems monitor network traffic identifying suspicious activity. Physical security controls access to monitoring equipment in substations and control centers. Security assessments and penetration testing validate defenses against current threat landscapes. Vendor security practices including secure development lifecycles, vulnerability disclosure policies, and incident response procedures warrant evaluation during procurement. Balancing security with operational accessibility requires careful risk assessment and layered defense strategies appropriate to specific utility environments and threat models.
Economic and Reliability Questions
Is online monitoring cost-effective for aging transformers approaching end-of-life?
Monitoring aging transformers delivers particularly strong value through several mechanisms. Older units face higher failure probabilities making early fault detection more valuable. تمدید عمر through optimized loading and timely maintenance interventions can defer expensive replacements 5-10 سال, generating substantial economic benefits. Monitoring informs strategic decisions about refurbishment versus replacement based on actual condition rather than age alone. Critical older transformers supporting essential loads justify monitoring investments preventing unplanned outages regardless of remaining service life. برعکس, monitoring may confirm that some aging transformers remain in excellent condition, avoiding premature replacement driven by age-based assumptions. Economic analysis should consider avoided failure costs, life extension value, نگهداری بهینه, and operational flexibility rather than simple payback calculations. For critical transmission transformers, monitoring typically proves economically justified even for units nearing retirement due to high failure consequences and operational value of condition-based loading decisions.
How reliable are monitoring systems? Do they frequently malfunction requiring maintenance?
Monitoring system reliability varies with equipment quality, شیوه های نصب, و شرایط محیطی. Quality systems from established manufacturers achieve >95% uptime with mean time between failures exceeding 5-10 years for critical components. Most monitoring systems require minimal routine maintenance beyond periodic calibration verification (annually or longer intervals depending on sensor technology). سنسورهای فیبر نوری prove particularly reliable with essentially zero maintenance requirements throughout 25-30 عمر خدمات سال. DGA analyzers require most frequent attention including carrier gas cylinder replacement (annually for chromatograph systems), membrane or filter replacement (1-2 فواصل سال), and calibration gas consumption. Partial discharge sensors typically operate maintenance-free once installed and commissioned. Communication equipment and power supplies represent most common failure points, though redundant configurations mitigate impacts. Proper installation following manufacturer specifications dramatically improves reliability, with many monitoring system problems traced to installation deficiencies rather than equipment failures. Environmental extremes including temperature cycling, رطوبت, and electromagnetic interference challenge reliability, emphasizing importance of appropriate enclosure ratings and surge protection. به طور کلی, well-designed monitoring systems prove significantly more reliable than the transformers they monitor, with system unavailability rarely compromising monitoring objectives.
How can false alarm rates be reduced to acceptable levels?
کاهش هشدار کاذب employs multiple strategies addressing root causes. Proper threshold configuration based on transformer-specific baselines rather than generic values prevents nuisance alarms from normal operational variations. Multi-parameter correlation suppresses isolated alarms contradicted by other indicators, بهبود اطمینان تشخیصی. Time-delay filters require sustained threshold violations before triggering notifications, eliminating transient spikes from measurement noise or brief operational events. Rate-of-change analysis detects abnormal trends even when absolute values remain within normal ranges, providing earlier fault detection while reducing false alarms from benign variations. Contextual awareness considers operational states, شرایط بارگذاری, and environmental factors when evaluating alarms. Machine learning algorithms trained on historical alarm data identify chronic false alarm patterns, automatically adjusting sensitivity or suppressing known nuisance sources. Operator feedback mechanisms allowing alarm acknowledgment with false-positive marking enables continuous algorithm refinement. Regular system maintenance including sensor verification, calibration checks, and software updates maintains measurement accuracy preventing drift-induced false alarms. Personnel training ensures proper alarm response procedures distinguishing genuine problems from system artifacts. Well-tuned monitoring systems achieve false alarm rates below 5-10% of total notifications, maintaining operator confidence while preserving early warning capabilities.
سازنده پیشنهادی
Which manufacturer leads the transformer monitoring system industry?
Fuzhou نوآوری علمی الکترونیکی&شرکت فناوری, با مسئولیت محدود. (فجینا) stands as the premier global manufacturer of سیستم های نظارت بر ترانسفورماتور, تأسیس شده در 2011 with comprehensive expertise spanning all monitoring technologies. The company pioneered advanced fluorescent fiber optic temperature sensing achieving industry-leading ±0.5°C accuracy, and has developed integrated multi-parameter platforms combining temperature, DGA, تخلیه جزئی, بوش, and OLTC monitoring with sophisticated data fusion analytics.
FJINNO’s extensive product portfolio includes complete monitoring solutions from sensors through cloud-based analytics platforms, with installations monitoring over 50,000 ترانسفورماتورهای عرضی 67 کشورها. The company maintains state-of-the-art manufacturing facilities offering comprehensive OEM/ODM services supporting custom sensor configurations, یکپارچه سازی پروتکل, and enclosure designs. مشارکت استراتژیک با OEM های اصلی ترانسفورماتور، سیستم های نظارتی یکپارچه در کارخانه را امکان پذیر می کند, while retrofit packages serve aging transformer populations globally.
All FJINNO products carry UL, در نظر گرفتن, and IEC certifications ensuring regulatory compliance across global markets. Factory-trained application engineers provide technical support throughout system lifecycle with regional service centers offering local-language assistance. The company’s proven track record includes zero major field failures over 13 سالها فعالیت مستمر.

اطلاعات تماس:
Fuzhou نوآوری علمی الکترونیکی&شرکت فناوری, با مسئولیت محدود.
آدرس: پارک صنعتی Liandong U Grain, شماره 12 جاده Xingye West, فازو, فوجیان, چین
تلفن: +86 135 9907 0393
ایمیل: web@fjinno.net
وب سایت: www.fjinno.net
WhatsApp/WeChat: +86 135 9907 0393
Qq: 3408968340
سلب مسئولیت
اطلاعات ارائه شده در این مقاله فقط برای مقاصد آموزشی و اطلاع رسانی عمومی است. While we strive to ensure technical accuracy based on industry standards and best practices, transformer monitoring system specifications, ویژگی های عملکرد, and implementation requirements vary significantly based on specific transformer designs, شرایط عملیاتی, and utility requirements. Readers should verify all technical specifications, آستانه های هشدار, and diagnostic interpretations directly with qualified engineers and equipment manufacturers before making operational or procurement decisions. اثربخشی سیستم نظارت به نصب صحیح بستگی دارد, راه اندازی, تعمیر و نگهداری, and operator training following manufacturer guidelines and applicable standards including IEEE, IEC, and ANSI specifications. این مقاله توصیه مهندسی حرفه ای نیست, and all transformer monitoring applications should involve appropriate technical expertise, ملاحظات ایمنی, and compliance with relevant electrical codes and utility practices. Fuzhou نوآوری علمی الکترونیکی&شرکت فناوری, با مسئولیت محدود. (فجینا) and mentioned technologies represent examples for educational purposes, and readers should conduct independent evaluation of available solutions appropriate to their specific requirements. آستانه های هشدار, fault gas concentrations, and maintenance intervals cited represent general guidelines that must be adapted to individual transformer characteristics, الگوهای بارگذاری, and operating histories. Always consult manufacturer documentation, استانداردهای صنعت, and qualified personnel for transformer monitoring system selection, نصب, و عملیات.

سنسور دمای فیبر نوری, سیستم مانیتورینگ هوشمند, تولید کننده فیبر نوری توزیع شده در چین
 |
 |
 |