 Sensores de temperatura de fibra óptica INNO ,sistemas de monitoreo de temperatura.
- Descarga parcial (PD) is a localised insulation breakdown that, left undetected, progressively degrades transformer insulation and can ultimately cause catastrophic failure. Online PD monitoring catches these defects at the earliest stage.
- Five complementary detection techniques — electrical, acústico, frecuencia ultraelevada, TEV, and chemical (DGA) — each capture a different physical manifestation of partial discharge, and no single method alone provides complete diagnostic coverage.
- A multi-sensor fusion architecture combining sensores ultrasónicos (20 kHz–200 kHz), sensores de corriente de alta frecuencia (100 kHz–50 MHz), y sensores UHF (300 MHz–3 GHz) eliminates false positives, enables source localisation, and delivers the highest detection reliability.
- Avanzado PPR (Descarga parcial resuelta en fase) three-dimensional pattern analysis and PRP (Secuencia de pulsos resuelta en fase) visualisation allow engineers to identify the specific discharge type — corona, descarga superficial, internal void, or floating potential — and prioritise maintenance accordingly.
- Moderno Sistemas de monitoreo de DP integrate with SCADA and enterprise asset management platforms via Modbus, CEI 61850, y DNP3, embedding insulation health data into the utility’s broader condition-based maintenance workflow.
Tabla de contenido
- What Is Partial Discharge in Transformers and Why Must It Be Monitored?
- Four Common Types of Partial Discharge Inside Power Transformers
- Five Partial Discharge Detection Techniques Compared — Electrical, Acústico, frecuencia ultraelevada, TEV, and Chemical Methods
- Why Multi-Sensor Fusion Outperforms Single-Method Detection
- What Are the Components of an Online Partial Discharge Monitoring System?
- Instalación de sensores, Ancho de banda, and Function — Ultrasonic, HFCT, and UHF Explained
- Key Technical Specifications of the PD Monitoring Host Unit
- How Do PRPD 3D Patterns and PRPS Pulse Sequences Identify Discharge Types?
- Backend Monitoring Software — Features and Diagnostic Capabilities
- How Does a PD Monitoring System Integrate with SCADA and Asset Management Platforms?
- Which Transformers Benefit Most from Online Partial Discharge Monitoring?
- How to Select the Right Partial Discharge Monitoring Equipment — A Buyer’s Guide
- Applicable International Standards for Partial Discharge Testing and Monitoring
- Preguntas frecuentes (Preguntas frecuentes)
1. What Is Partial Discharge in Transformers and Why Must It Be Monitored?
![]()
Descarga parcial is a localised electrical breakdown that only partially bridges the insulation between conductors inside a transformer. Unlike a full flashover, a partial discharge event does not create a complete conductive path, but it does release energy — in the form of electromagnetic radiation, acoustic waves, calor, and chemical by-products — that gradually erodes the surrounding insulation material. Con el tiempo, repeated partial discharge activity enlarges the original defect, accelerates insulation ageing, and can ultimately trigger a complete insulation failure, leading to catastrophic transformer damage, unplanned outages, and significant financial loss.
The challenge is that partial discharge activity is invisible during normal operation. External symptoms such as dissolved gas accumulation in the oil or elevated winding temperatures often appear only after the defect has already progressed to an advanced stage. Esta es la razón monitoreo de descargas parciales en línea has become an essential component of modern monitoreo de la condición del transformador programmes. By detecting the electrical, acústico, and electromagnetic signatures of PD events in real time, an online system provides the earliest possible warning of insulation degradation — weeks, meses, or even years before the fault would be detected by conventional periodic testing.
2. Four Common Types of Partial Discharge Inside Power Transformers

Not all partial discharge is the same. The physical mechanism, ubicación, and severity of the discharge depend on the nature of the insulation defect. Understanding the four most common PD types helps engineers interpret monitoring data and plan appropriate maintenance responses.
Descarga de corona
Corona discharge occurs at sharp metallic protrusions or poorly shaped electrodes where the localised electric field intensity exceeds the breakdown strength of the surrounding medium — typically transformer oil or gas. The discharge appears as a faint glow and produces predominantly hydrogen gas. While corona is often considered the least severe form of PD, persistent corona activity degrades oil quality over time and can initiate more damaging discharge types.
Descarga superficial
Surface discharge develops along the interface between solid insulation (pressboard or crepe paper) and the surrounding oil or gas. It is frequently caused by contamination, entrada de humedad, or excessive tangential electric field stress at the insulation surface. Surface discharge can quickly escalate in severity because the carbonised tracking path it creates along the insulation surface progressively shortens the effective insulation distance.
Internal Void Discharge
Gas-filled voids or cavities trapped within solid insulation — typically caused by manufacturing defects, estrés mecánico, or thermal ageing — create regions where the dielectric strength is significantly lower than the surrounding material. When the applied voltage exceeds the breakdown threshold of the void, a partial discharge ignites inside the cavity. Internal void discharge is particularly insidious because it is entirely enclosed within the insulation and cannot be detected by visual inspection.
Floating-Potential Discharge
When a metallic component inside the transformer — such as a shield, a structural bracket, or a loose connection — is not properly connected to a defined electrical potential, it acquires a floating voltage through capacitive coupling. This floating potential can drive repetitive discharge between the component and adjacent earthed or energised structures. Floating-potential discharge is typically high in energy and produces strong UHF and acoustic signatures, making it relatively easier to detect but also more damaging to nearby insulation.
3. Five Partial Discharge Detection Techniques Compared — Electrical, Acústico, frecuencia ultraelevada, TEV, and Chemical Methods
![]()
Each detection technique captures a different physical phenomenon produced by partial discharge events. The table below provides a side-by-side comparison of the five most widely used methods, summarising their measurement principles, typical sensitivity, main advantages, and primary limitations.
| Método de detección | Physical Quantity Measured | Typical Sensor | Sensitivity Metric | Ventajas clave | Principales limitaciones |
|---|---|---|---|---|---|
| Eléctrico (CEI 60270) | Apparent charge (ordenador personal / nC) | Coupling capacitor, bushing tap | Down to ~1 pC | Standardised, quantitative, excellent for factory testing | Susceptible to EMI in field; primarily offline |
| Acústico / Ultrasónico | Acoustic emission (dB / mV) | Piezoelectric sensor (20–200 kHz) | Moderado | Immune to EMI; enables PD source localisation via triangulation | Signal attenuated by tank structure and oil path |
| frecuencia ultraelevada (Frecuencia ultraalta) | Electromagnetic signal (300 MHz–3 GHz) | UHF antenna (conical, spiral, Vivaldi) | Down to a few pC equivalent | Excellent noise rejection; en tiempo real; suitable for online use | Sensitivity depends on sensor position; requires installation port |
| TEV (Tensión transitoria de tierra) | Surface voltage pulse (mV) | Capacitive plate sensor | Moderado a alto | Non-intrusive; no outage required; instalación sencilla | Limited to metallic-enclosure equipment; external PD only |
| Químico (DGA) | Dissolved gas concentration (ppm) | Online DGA monitor / lab chromatography | Indirect indicator | Detects cumulative insulation degradation; established standard | Respuesta lenta; cannot pinpoint PD location or type |
As the table illustrates, no single technique covers all aspects of partial discharge detection. Electrical methods provide the most accurate charge quantification but struggle with on-site noise. Acoustic and UHF methods excel at online monitoring and source localisation. TEV is ideal for quick non-intrusive screening. DGA reveals cumulative insulation damage but provides no real-time pulse-level information. This complementarity is what drives the industry toward multi-sensor fusion architectures.
4. Why Multi-Sensor Fusion Outperforms Single-Method Detection
A single-sensor PD monitor — regardless of how sensitive it is — faces two fundamental challenges: false positives caused by external noise sources and diagnostic ambiguity when only one type of signal is available. Tecnología de fusión multisensor addresses both problems by cross-correlating data from sensors operating in entirely different frequency domains and physical measurement principles.
Consider a practical example. An ultrasonic sensor mounted on the transformer tank detects an acoustic emission event. In isolation, the operator cannot be certain whether the signal is genuine PD or a mechanical vibration from a nearby cooling fan. Sin embargo, if a UHF sensor simultaneously detects a corresponding electromagnetic pulse, and a high-frequency current sensor at the grounding cable records a coincident current spike, the probability that the event is a true partial discharge rises to near certainty. The time-of-arrival difference between the acoustic and electromagnetic signals can further be used to estimate the spatial location of the discharge source inside the transformer.
This fusion approach dramatically reduces false alarm rates, improves diagnostic confidence, and enables the operator to not only confirm that PD is occurring but also determine where it is occurring and how severe it is — all from a single integrated monitoring platform. It is the reason why leading sistemas de monitoreo de descargas parciales de transformadores now incorporate three sensor types as standard, rather than relying on any one method alone.
5. What Are the Components of an Online Partial Discharge Monitoring System?
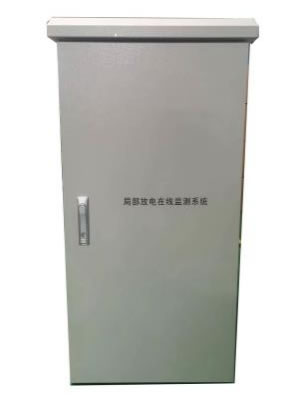
un completo online PD monitoring system consists of three functional layers that work together to convert raw discharge signals into actionable diagnostic intelligence.
Field Sensors
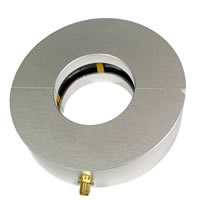
Three types of sensors are deployed on the transformer to capture different physical manifestations of partial discharge. Ultrasonic sensors detect acoustic emissions from PD activity within the windings and oil. High-frequency current (HFCT) sensors clamp onto the core grounding cable to measure pulse currents generated by discharge events. UHF sensors are installed at oil valve ports to capture ultra-high-frequency electromagnetic radiation propagating through the transformer oil. Each sensor is designed for harsh outdoor environments with an IP68 protection rating.
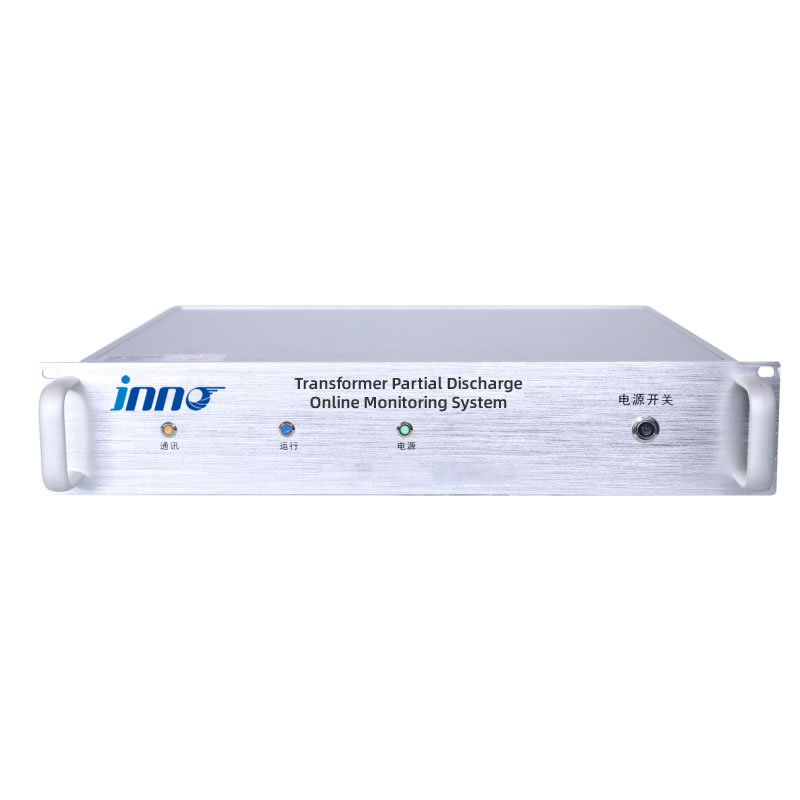
Unidad anfitriona de monitoreo de PD
The monitoring host is the central processing hub of the system. It receives analogue signals from all connected sensors, realiza acondicionamiento de señal (amplificación, filtración, and impedance matching), and digitises the waveforms at high speed using a multi-channel acquisition architecture. The host calculates key PD parameters — including maximum discharge amplitude, cantidad promedio de descarga, and discharge frequency — and applies intelligent algorithms for pattern recognition and fault classification. It is typically rack-mounted in a 2U enclosure inside a convergence cabinet or control panel near the transformer.
Software de monitoreo de back-end
Installed on a control room computer or server, the software platform provides real-time visualisation, tendencia histórica, gestión de alarmas, and diagnostic analysis. Its core analytical capabilities include 3D PRPD pattern display, PRPS pulse sequence mapping, discharge amplitude statistics, and comparison against an expert pattern database for automated PD type identification. The software communicates with the monitoring host via Ethernet or RS-485.
6. Instalación de sensores, Ancho de banda, and Function — Ultrasonic, HFCT, and UHF Explained
The effectiveness of a sistema de monitoreo de descargas parciales depends heavily on correct sensor selection and placement. The table below details the three sensor types used in a full-spectrum multi-sensor architecture, including their monitoring bandwidth, método de instalación, mounting location, and primary diagnostic function.
| Tipo de sensor | Monitoreo del ancho de banda | Método de instalación | Mounting Location | Función primaria |
|---|---|---|---|---|
| Sensor ultrasónico | 20 kHz – 200 kilociclos | Soporte magnético | Transformer tank surface | Detects acoustic emission signals generated by internal PD activity in windings and insulation structures |
| Corriente de alta frecuencia (HFCT) Sensor | 100 kHz – 50 megahercio | Abrazadera | Punto de puesta a tierra del núcleo | Captures high-frequency pulse currents flowing through the grounding cable as a result of discharge events |
| Sensor UHF | 300 MHz – 3 000 megahercio | Plug-in type | Oil drain valve port | Monitors ultra-high-frequency electromagnetic signals propagating through transformer oil, indicating internal insulation discharge |
Installation Notes
Ultrasonic sensors attach to the tank wall using a magnetic holder, which allows flexible repositioning without drilling or welding. For optimal acoustic coupling, a thin layer of couplant gel is applied between the sensor face and the tank surface. The HFCT sensor is a split-core clamp that can be installed around the grounding cable without disconnecting it — meaning no transformer outage is required. The UHF sensor inserts into an existing oil drain valve or dedicated dielectric window port, placing the antenna element inside the oil space for maximum sensitivity to internal electromagnetic signals. All three sensor types are rated IP68, ensuring reliable operation in rain, polvo, humedad, and temperature extremes from -20 °C a +125 °C.
7. Key Technical Specifications of the PD Monitoring Host Unit
The monitoring host is the heart of the system, responsible for high-speed signal acquisition, real-time processing, and data communication. The table below presents the core technical parameters of a representative industrial-grade PD monitoring host designed for substation deployment.
| Parámetro | Especificación |
|---|---|
| Recepción de señal | Ultrasónico, corriente de alta frecuencia (HFCT), and UHF sensor inputs |
| Rango dinámico | -80 a -20 dBm |
| Tasa de muestreo | 200 MS/s (200 million samples per second) |
| Configuración del canal | 4 o 6 canales (configurable por el usuario) |
| Consistencia del canal | ≤ 0.5 dBm |
| Rango de monitoreo | ≤ 20 000 ordenador personal |
| Impedancia de transmisión | ≥ 12 mV/mA |
| Interfaces de comunicación | Ethernet RJ45, RS-485 |
| Supported Protocols | Modbus RTU/TCP, CEI 61850, DNP3 |
| Fuente de alimentación | AC 90–240 V, 50/60 Hz |
| Recinto | 2montaje en bastidor en U (483 mm × 89 mm × 300 milímetros) |
| Método de instalación | Convergence cabinet or control panel mount |
| Sensor Protection Rating | IP68 |
| Temperatura de funcionamiento | -20 °C a +125 °C (sensor); host per cabinet environment |
| Diagnostic Outputs | Magnitud de la descarga (q), discharge phase (Ø), 3D PRPD patterns, PRPS pulse sequences, maximum amplitude, average quantity, frecuencia de descarga |
Por qué 200 MS/s Sampling Rate Matters
Partial discharge pulses are extremely fast transient events, often lasting only nanoseconds. A sampling rate of 200 MS/s — equivalent to a 5-nanosecond sampling interval — ensures that the host captures the full waveform of each discharge pulse without aliasing or distortion. This waveform fidelity is essential for accurate PRPD pattern construction and for distinguishing genuine PD pulses from noise artefacts. Lower sampling rates may miss critical waveform features, leading to misclassification or missed detections.
8. How Do PRPD 3D Patterns and PRPS Pulse Sequences Identify Discharge Types?
Raw PD data — pulse counts, amplitudes, and timestamps — becomes truly diagnostic when it is visualised through Descarga parcial resuelta en fase (PPR) patterns and Secuencia de pulsos resuelta en fase (PRP) muestra.
PRPD — The Fingerprint of Discharge
A PRPD pattern plots discharge magnitude (vertical axis) against the phase angle of the power-frequency cycle (horizontal axis), accumulated over many cycles to build a three-dimensional density map. Different PD types produce distinctly different PRPD shapes. Corona discharge typically appears as clusters concentrated near the voltage peaks on one polarity. Internal void discharge produces symmetrical patterns on both positive and negative half-cycles, with the discharge magnitude remaining relatively constant. Surface discharge shows asymmetric, spreading patterns that increase in magnitude with applied voltage. Floating-potential discharge creates dense, high-amplitude clusters that shift in phase as the floating voltage changes.
By comparing a measured PRPD pattern against an expert database of known discharge signatures, the monitoring software can automatically classify the PD type and assess its severity — transforming a complex electromagnetic phenomenon into an actionable maintenance recommendation.
PRPS — Tracking Discharge Evolution Over Time
While PRPD provides a cumulative snapshot, PRPS displays individual pulses in sequence, preserving the time relationship between consecutive discharge events. This is particularly valuable for detecting intermittent PD activity, observing how discharge patterns evolve under changing load or temperature conditions, and distinguishing between multiple simultaneous PD sources. PRPS data also supports advanced statistical analysis — such as pulse interval distributions and clustering algorithms — that can reveal degradation trends before they are visible in the PRPD pattern alone.
9. Backend Monitoring Software — Features and Diagnostic Capabilities
The backend software platform transforms the monitoring host’s raw output into a decision-support tool for operators and asset managers. Installed on a control room workstation or accessible via a web interface, it provides four core functional modules.
Real-Time Monitoring and Visualisation
The system continuously acquires and displays live PD data, including 3D PRPD spectrum maps, PRPS pulse sequences, discharge amplitude bar charts, and trend lines for key parameters such as maximum discharge magnitude, cantidad promedio de descarga, and discharge repetition rate. Operators can view individual channel data or an aggregated system-level summary.
Historical Query and Trending
All measurement data is stored with timestamps, enabling engineers to query historical records by date range, canal, or alarm event. Statistical trending tools reveal long-term insulation degradation trajectories, variaciones estacionales, and load-correlated PD behaviour. Trend forecasting algorithms support predictive maintenance scheduling.
Gestión de alarmas
Multi-level alarm thresholds — typically informational, advertencia, and critical — can be configured for each monitored parameter. When a threshold is exceeded, the system generates visual alerts on the dashboard and transmits notifications via email, SMS, or relay output. Alarm events are logged with full context (marca de tiempo, canal, parameter value, PRPD snapshot) for post-event analysis.
Diagnóstico inteligente
The software includes a built-in expert pattern database that maps PRPD and PRPS signatures to known discharge types. When new data matches a stored pattern, the system suggests the most probable PD type and recommended action. This reduces dependence on manual expert interpretation and accelerates the decision-making process, particularly for utilities managing large transformer fleets.
10. How Does a PD Monitoring System Integrate with SCADA and Asset Management Platforms?
Partial discharge data delivers maximum value when it is embedded in the utility’s wider operational data ecosystem rather than confined to a standalone display. Un bien diseñado PD monitoring system supports this integration through standard industrial communication interfaces and protocols.
A nivel de subestación, the PD monitoring host connects to the station RTU (Unidad terminal remota) o controlador de bahía mediante Ethernet RJ45 o RS-485. Standard protocols — including Modbus RTU/TCP, CEI 61850, y DNP3 — ensure compatibility with virtually any substation automation architecture. Key data points transmitted to SCADA include real-time PD amplitude values, banderas de estado de alarma, and diagnostic summary codes. Dispatchers can configure high-priority alarms for critical PD events — such as sudden acetylene-type UHF signatures or rapidly increasing discharge rates — ensuring immediate visibility on the SCADA overview screen.
Correlation with Other Monitoring Parameters
The greatest diagnostic insight comes from correlating PD data with complementary transformer health parameters. When the PD monitoring system feeds data into an integrated plataforma de monitoreo de transformadores alongside dissolved gas analysis (DGA), fibre optic winding temperature, bushing capacitance and tan-delta, and on-load tap changer condition data, the platform can perform automated cross-parameter analysis. Por ejemplo, a simultaneous increase in UHF PD activity and a rise in hydrogen concentration in the oil provides much stronger confirmation of an active internal insulation fault than either indicator alone. This multi-parameter correlation approach significantly reduces diagnostic uncertainty and supports more confident maintenance decision-making.
11. Which Transformers Benefit Most from Online Partial Discharge Monitoring?
While any oil-filled or dry-type transformer can experience partial discharge, the investment in continuous online monitoring is best directed at assets where the consequences of an undetected insulation fault are most severe.
Highest-Priority Applications
Transmission-voltage power transformers (≥110 kV) at utility substations are the primary candidates, ya que su falla provoca interrupciones generalizadas y los plazos de entrega de reemplazo pueden exceder los doce meses. aumento del generador (GSU) transformers at thermal, hidro, and nuclear power plants are equally critical because an unplanned trip directly removes generation capacity from the grid. Large industrial transformers serving petrochemical complexes, semiconductor fabrication plants, centros de datos, and steel mills also justify online PD monitoring due to the enormous cost of production downtime.
Growing Adoption Scenarios
La expansión de las energías renovables ha creado una nueva demanda. Transformadores de colectores y de interconexión en parques eólicos y granjas solares experience highly variable loading profiles and are often in remote locations where periodic manual testing is expensive and infrequent. Transformadores de potencia de tracción para electrificación ferroviaria systems carry safety-critical loads. Ageing transformers operating beyond their original design life are another strong candidate — continuous PD trending supports evidence-based lifetime extension decisions. De alta tensión aparamenta, SIG (aparamenta aislada en gas), y power cable systems are also increasingly equipped with online PD monitoring, using the same sensor technologies adapted for their specific enclosure geometries.
12. How to Select the Right Partial Discharge Monitoring Equipment — A Buyer’s Guide
The market offers a range of PD monitoring products, from single-sensor screening devices to full multi-sensor diagnostic platforms. The following criteria will help buyers match the right equipment to their specific application requirements.
Sensor Coverage and Fusion Capability
For comprehensive diagnostics on critical transformers, specify a system that supports all three sensor types — ultrasonic, HFCT, and UHF — with true multi-channel data fusion. Single-sensor systems (p.ej., UHF-only or acoustic-only) are suitable for basic screening but cannot provide the cross-verification and source localisation capabilities that multi-sensor fusion delivers.
Sampling Rate and Dynamic Range
A sampling rate of at least 200 MS/s ensures that fast PD transients are captured without loss of waveform detail. The dynamic range should be wide enough — at least -80 a -20 dBm — to handle both very small incipient discharges and large discharge events without saturation or signal clipping.
Número de canales y escalabilidad
Evaluate whether four channels suffice for the intended transformer or whether six channels are needed to accommodate additional sensor positions. Systems with configurable channel options provide flexibility for both initial deployment and future expansion.
Diagnostic Software Quality
The software should include 3D PRPD pattern display, PRPS visualisation, an expert pattern database for automated PD type classification, multi-level alarm management, and historical trend analysis with forecasting. Web-based or remote-access capability is increasingly expected for fleet-wide management.
Communication Protocol Compatibility
Ensure the monitoring host supports the communication protocol already in use at your substation — Modbus RTU, Modbus TCP, CEI 61850, o DNP3. Native protocol support avoids the cost and complexity of adding external protocol converters.
Environmental Rating and Sensor Durability
Sensors must be rated IP68 for outdoor installation and specified for the full operating temperature range of the site. Sensor mounting methods — magnetic, abrazadera, and plug-in — should require no modification to the transformer structure and no outage for installation.
Vendor Support and Expert Database Updates
PD pattern recognition accuracy depends on the quality and breadth of the expert database. Choose a vendor that provides regular database updates incorporating new discharge patterns and diagnostic refinements as field experience accumulates across their installed base.
13. Applicable International Standards for Partial Discharge Testing and Monitoring
Several international standards govern partial discharge measurement, interpretación, y rendimiento del equipo. Understanding these references helps buyers write better procurement specifications and ensures that the selected monitoring system meets globally accepted benchmarks.
CEI 60270 (High-Voltage Test Techniques — Partial Discharge Measurements) is the foundational standard for electrical PD measurement. It defines the apparent charge method, procedimientos de calibración, and test circuit configurations. While primarily intended for offline factory testing, its measurement principles underpin many online system designs.
CEI 62478 (High-Voltage Test Techniques — Measurement of Partial Discharges by Electromagnetic and Acoustic Methods) extends the standard framework to cover UHF and acoustic detection techniques, providing guidance on sensor specifications, procesamiento de señal, and data presentation for non-conventional PD measurement methods used in online monitoring.
IEEE C57.127 (Guide for the Detection, Ubicación, and Interpretation of Sources of Acoustic Emissions from Electrical Discharges in Power Transformers and Reactors) focuses specifically on acoustic PD detection in transformers, covering sensor placement, signal interpretation, and source localisation techniques.
Las referencias adicionales incluyen Folleto técnico de CIGRE 676 (Partial Discharges in Transformers) which provides comprehensive guidance on PD phenomena, measurement techniques, and interpretation strategies, y CEI 61850 which defines the communication standard for substation automation and governs how PD monitoring data is exchanged with SCADA and asset management systems.
14. Preguntas frecuentes (Preguntas frecuentes)
Q1: What is the difference between partial discharge and full breakdown?
Partial discharge is a localised insulation breakdown that bridges only part of the insulation gap between conductors. It does not create a complete conductive path and does not cause immediate equipment failure. Full breakdown, por el contrario, represents a complete insulation failure — a short circuit that typically results in catastrophic damage, an explosion, o fuego. Partial discharge is the precursor; if left unmonitored and unaddressed, it progressively degrades insulation until full breakdown occurs.
Q2: Can partial discharge be detected while the transformer is energised?
Sí. En línea sistemas de monitoreo de descargas parciales are specifically designed to operate while the transformer is energised and carrying load. The ultrasonic, HFCT, and UHF sensors are all installed without requiring a transformer outage, and the system continuously acquires data under normal operating conditions. De hecho, monitoring PD under real service voltage and load is more representative of the transformer’s actual insulation condition than offline tests performed at reduced voltage.
Q3: How does multi-sensor fusion reduce false alarms?
Each sensor type is sensitive to a different physical phenomenon. A genuine partial discharge event simultaneously produces an acoustic wave (detected by the ultrasonic sensor), a high-frequency current pulse (detected by the HFCT sensor), and an electromagnetic signal (detected by the UHF sensor). External interference sources — such as switching transients, radio signals, or mechanical vibrations — typically affect only one sensor type. By requiring correlated detections across two or more sensors before raising an alarm, the system effectively eliminates false positives caused by single-source noise.
Q4: What is a PRPD pattern and how is it used for diagnosis?
A PPR (Descarga parcial resuelta en fase) pattern is a three-dimensional visualisation that plots discharge magnitude against the phase angle of the AC power cycle, accumulated over many cycles. Different types of partial discharge — corona, descarga superficial, vacíos internos, floating potentials — each produce characteristic PRPD shapes. By matching the measured pattern against a database of known discharge signatures, the monitoring system can identify the type of insulation defect and assess its severity, enabling targeted maintenance rather than generic inspections.
Q5: How long does it take to install a PD monitoring system on an existing transformer?
A typical installation takes one to two days per transformer. Ultrasonic sensors attach magnetically to the tank surface, HFCT sensors clamp onto the core grounding cable, and UHF sensors plug into existing oil drain valve ports — none of these steps require a transformer outage. The monitoring host is rack-mounted inside a nearby control cabinet, connected to the sensors via signal cables, and linked to the control room via Ethernet or RS-485. Puesta en servicio, verificación de calibración, and operator training are typically completed on-site within the same visit.
Q6: What maintenance does the PD monitoring system itself require?
El sistema requiere un mantenimiento mínimo.. Recommended activities include quarterly visual inspection of sensor mounting integrity and cable connections, annual calibration verification using a reference signal source, and periodic software updates to incorporate the latest diagnostic algorithms and expert pattern database revisions. The sensors themselves are maintenance-free with IP68 environmental protection. Data storage capacity should be monitored to prevent disk space issues on the backend server.
P7: Can the system monitor multiple transformers simultaneously?
Sí. The backend monitoring software supports a multi-asset architecture where multiple PD monitoring hosts — each connected to its own set of sensors on a different transformer — report to a single centralised software platform. This N-to-1 configuration is standard for substations and industrial facilities with several transformers, providing fleet-wide visibility from a single operator interface and reducing total system cost.
P8: How does online PD monitoring complement dissolved gas analysis (DGA)?
DGA detects the chemical by-products of insulation degradation — dissolved gases such as hydrogen and acetylene — that accumulate in transformer oil over time. It is excellent for confirming that insulation damage has occurred, but it responds slowly and cannot pinpoint the location or real-time activity of the discharge source. Online PD monitoring, por el contrario, detects individual discharge events as they happen, identifies the PD type through PRPD analysis, and can localise the source via acoustic triangulation. Juntos, DGA and PD monitoring provide complementary layers of insulation surveillance — DGA for cumulative damage assessment and PD for real-time fault activity tracking.
P9: What is the expected return on investment for a PD monitoring system?
ROI is typically realised within two to three years through prevention of catastrophic insulation failures — each of which can cost millions of dollars in equipment replacement, producción perdida, and collateral damage. A single prevented failure often justifies the entire monitoring system investment. Additional benefits include optimised maintenance scheduling (avoiding unnecessary outages and inspections), extended transformer service life, reduced insurance premiums, and improved regulatory compliance for critical infrastructure assets.
Q10: What communication protocols are supported for SCADA integration?
The PD monitoring host provides Ethernet RJ45 y RS-485 interfaces de comunicación, supporting standard industrial protocols including Modbus RTU, Modbus TCP, CEI 61850, y DNP3. This ensures seamless integration with virtually any substation automation or SCADA architecture. Datos de DP en tiempo real, estado de alarma, and diagnostic results can be transmitted to centralised monitoring centres and enterprise asset management (EAM) plataformas.
Descargo de responsabilidad: La información proporcionada en este artículo es solo para fines educativos y de referencia generales.. Fjinno (www.fjinno.net) no ofrece garantías, expreso o implícito, en cuanto a la integridad, exactitud, o aplicabilidad del contenido a cualquier proyecto o instalación específica. Las especificaciones técnicas a las que se hace referencia en este documento representan valores típicos y pueden variar según el tipo de transformador., colocación del sensor, y entorno del sitio. Las decisiones de ingeniería siempre deben basarse en evaluaciones específicas del sitio realizadas por profesionales calificados de acuerdo con las normas aplicables, incluida IEC. 60270, CEI 62478, IEEE C57.127, y códigos de red locales. Los nombres de productos de terceros fabricantes son marcas comerciales de sus respectivos propietarios y se mencionan únicamente como referencia informativa.. FJINNO no será responsable de ninguna pérdida o daño que surja del uso o la confianza en esta información..

Sensor de temperatura de fibra óptica, Sistema de monitoreo inteligente, Fabricante distribuido de fibra óptica en China
 |
 |
 |