 Sensores de temperatura de fibra óptica INNO ,sistemas de monitoreo de temperatura.
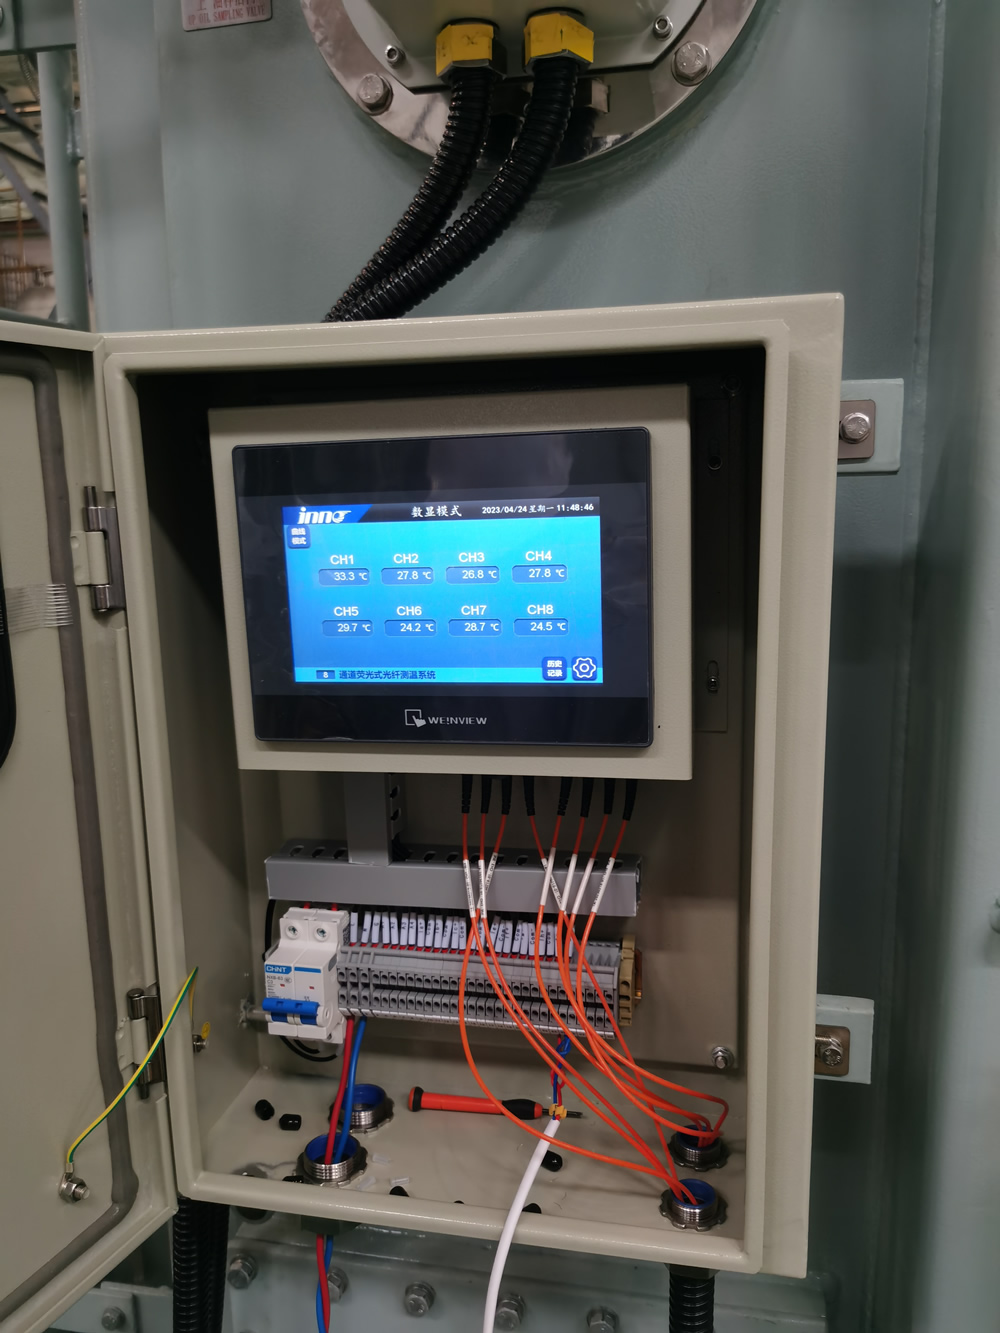
Tabla de contenido
- Introducción: The Critical Role of Temperature Monitoring in Transformer Performance
- Tecnología de detección de temperatura de fibra óptica: Cómo funciona
- Key Advantages of Fiber Optic Temperature Sensors for Transformer Applications
- Comparing Fiber Optic Technologies: EDE frente a. FBG vs. Fluoroptic Systems
- Guía de implementación: Where and How to Install Fiber Optic Sensors in Transformers
- Estudios de casos del mundo real: Transformer Failure Prevention
- Análisis del retorno de la inversión: The Business Case for Fiber Optic Temperature Monitoring
- Guía de selección: How to Choose the Right Fiber Optic System for Your Transformers
- Tendencias futuras: The Evolution of Fiber Optic Monitoring in 2025 and Beyond
- Conclusión: Implementing a Fiber Optic Temperature Monitoring Strategy
Introducción: The Critical Role of Temperature Monitoring in Transformer Performance
Power transformers represent some of the most critical and expensive assets in the electrical grid. With replacement costs ranging from hundreds of thousands to millions of dollars and lead times often exceeding 12 meses, unexpected transformer failures can have devastating impacts on grid reliability, costos operativos, and organizational reputation.
At the heart of transformer reliability lies temperature management. As IEEE and IEC standards have long established, elevated operating temperatures are directly correlated with accelerated insulation aging, with each 7-8°C increase potentially halving the expected transformer life. While traditional oil and winding temperature indicators have served the industry for decades, they provide only limited insight into actual conditions within the transformer.
of transformer failures are related to excessive temperatures or hotspots
typical difference between average winding temperature and actual hotspot temperature
reduction in transformer life for every 7-8°C increase in operating temperature
months typical lead time for critical power transformer replacement
Fiber optic temperature sensing technology has revolutionized the approach to transformer temperature monitoring, providing direct, real-time measurement of actual winding hotspot temperatures rather than approximations based on oil temperatures and thermal models. As we move further into 2025, these systems have become increasingly sophisticated, offering unprecedented insight into transformer thermal behavior and enabling truly condition-based maintenance approaches.
This comprehensive guide explores the latest developments in fiber optic temperature sensing for power transformers, from the fundamental technology principles to practical implementation strategies, helping asset managers, electrical engineers, and maintenance professionals make informed decisions about this critical monitoring technology.
Tecnología de detección de temperatura de fibra óptica: Cómo funciona
Fiber optic temperature sensing represents a fundamental departure from conventional electrical temperature measurement techniques. Instead of relying on electrical signals that can be compromised by electromagnetic interference (EMI), fiber optic sensors use light properties to detect temperature changes with exceptional accuracy and reliability.
Principios tecnológicos básicos
Fiber optic sensors operate based on several different physical principles, each with specific advantages for particular applications:
Fluorescence Decay Method (FDM)
This method utilizes temperature-sensitive phosphorescent materials at the sensor tip. Cuando se excita por un pulso de luz., these materials emit fluorescent light with decay characteristics directly related to temperature. The time-based measurement is inherently immune to light intensity fluctuations, haciéndolo excepcionalmente preciso y estable durante largos períodos.
Precisión típica: ±0,5 °C
Rejilla de Bragg de fibra (FBG)
Los sensores FBG contienen variaciones periódicas microscópicas en el índice de refracción del núcleo de la fibra., creando un reflector de longitud de onda específica. A medida que cambia la temperatura, La expansión térmica altera el período de rejilla., desplazando la longitud de onda reflejada proporcionalmente a la temperatura. Esto permite multiplexar múltiples sensores en una sola fibra..
Precisión típica: ±1,0 °C
Detección de temperatura distribuida (EDE)
Los sistemas DTS miden la temperatura de forma continua a lo largo de toda una fibra óptica. Funcionan analizando la luz retrodispersada resultante del efecto Raman. La relación entre las señales de Stokes y anti-Stokes proporciona información de temperatura., mientras que el tiempo de vuelo determina la ubicación a lo largo de la fibra.
Precisión típica: ±1,0-2,0°C con resolución espacial de 1-2 metros
Componentes típicos del sistema
un completo sistema de monitoreo de temperatura de fibra óptica para transformadores normalmente incluye:
Fiber Optic Probes
Specially designed temperature probes containing optical fibers that are installed directly into transformer windings during manufacturing or retrofit procedures. These probes are engineered to withstand the harsh electrical, térmico, and chemical environment inside transformers for decades.
Signal Conditioner/Transmitter
Electronic equipment that generates the light signals, analyzes the returned optical signals, and converts them into temperature readings. Modern units provide multiple communication interfaces including 4-20mA, Modbus, DNP3, y CEI 61850 for seamless integration with SCADA and asset management systems.
Extension Fibers
Specialized optical fiber cables connecting the probes to the signal conditioner, designed to withstand the transformer oil environment and provide reliable transmission over long distances without signal degradation.
Software de monitoreo
Advanced software platforms that display real-time temperature data, analyze trends, generate alerts, and integrate with broader asset performance management systems to enable condition-based maintenance strategies.
Transformer Installation Approaches
Fiber optic temperature sensors can be integrated into power transformers through several methods:
Instalación de fábrica (New Transformers)
The optimal approach involves installing sensors during transformer manufacturing, allowing precise placement at calculated hotspot locations within the windings. Sensors are typically integrated into specialized spacers or directly between disc windings.
Instalación de modernización (Existing Transformers)
For transformers already in service, special retrofit probes can be installed through available openings such as unused thermometer wells, spare valves, or inspection ports. Aunque no proporciona el mismo nivel de acceso directo al bobinado que la instalación de fábrica, Estos enfoques aún brindan datos valiosos sobre la temperatura..
External Surface Monitoring
Para aplicaciones donde el acceso interno es imposible, Se pueden instalar sistemas DTS avanzados en las superficies del tanque del transformador para proporcionar un mapeo térmico de las temperaturas externas., que puede correlacionarse con las condiciones internas mediante un sofisticado modelado térmico.
Evolución de la tecnología: 2025 Update
Los avances recientes en la tecnología de detección de fibra óptica han mejorado drásticamente el rendimiento del sistema.. La última generación de sistemas de monitorización ofrece ahora:
- Precisión mejorada (±0,2°C en condiciones de laboratorio, ±0,5°C en aplicaciones de campo)
- Rango de medición ampliado (-40°C a +300°C)
- Mayores frecuencias de muestreo de hasta 10 Hz para estudios de carga dinámica
- Capacidades avanzadas de autocalibración que garantizan un funcionamiento sin deriva durante décadas
- Sondas miniaturizadas con diámetros tan pequeños como 0,8 mm para un impacto mínimo en el diseño del transformador
- Redundancia incorporada con rutas ópticas duales para aplicaciones de misión crítica
Key Advantages of Fiber Optic Temperature Sensors for Transformer Applications
La adopción de tecnologías de monitoreo de temperatura de fibra óptica para transformadores de potencia se ha acelerado significativamente en los últimos años., Impulsado por varias ventajas convincentes sobre los enfoques de monitoreo convencionales.. Comprender estos beneficios es esencial para los administradores de activos e ingenieros que evalúan las inversiones en sistemas de monitoreo..
Direct Hotspot Measurement
Enfoque convencional: Indicadores de temperatura de bobinado tradicionales. (WTI) estimar las temperaturas de los puntos críticos basándose en la temperatura superior del aceite más una compensación del modelo térmico que se aproxima al aumento de temperatura del devanado.
Ventaja de la fibra óptica: Los sensores miden directamente las temperaturas reales de los devanados en los puntos calientes previstos, eliminating estimation errors that can exceed 15°C during transient conditions or unusual loading patterns.
Impacto: Accurate hotspot data enables precise loading decisions, preventing unnecessary derating while avoiding dangerous overloading conditions.
Inmunidad a la interferencia electromagnética
Enfoque convencional: Electrical sensors like RTDs and thermocouples can suffer from measurement errors, signal degradation, or outright failure due to the intense electromagnetic fields present in transformers.
Ventaja de la fibra óptica: The dielectric nature of optical fibers makes them completely immune to EMI, ensuring reliable measurements even during fault conditions, operaciones de conmutación, or geomagnetic disturbances.
Impacto: Continuo, reliable data during all operational states, including critical fault conditions when temperature information is most valuable.
Múltiples puntos de medición
Enfoque convencional: Traditional systems typically provide only 1-2 temperature measurement points per transformer due to cost and complexity limitations.
Ventaja de la fibra óptica: Soporte de sistemas modernos 8-16 discrete measurement points in a single transformer, enabling comprehensive thermal mapping of different winding sections, phases, y componentes centrales.
Impacto: Detailed thermal profiles reveal unexpected temperature distributions, design issues, or cooling problems that would remain hidden with limited measurement points.
Enhanced Safety and Isolation
Enfoque convencional: Electrical sensors require careful isolation design to prevent dangerous potential transfer between windings and monitoring equipment.
Ventaja de la fibra óptica: The inherent electrical isolation of optical fibers eliminates any risk of potential transfer, bucles de tierra, o riesgos de seguridad, simplifying installation and improving personnel safety.
Impacto: Complejidad de ingeniería reducida, eliminación de barreras de aislamiento, y mayor seguridad para el personal de mantenimiento.
Estabilidad a largo plazo
Enfoque convencional: Los sensores eléctricos suelen experimentar una desviación de la calibración con el tiempo., particularmente en ambientes de alta temperatura con ciclos térmicos.
Ventaja de la fibra óptica: Los sistemas de fibra óptica premium utilizan principios de medición basados en referencias que son inherentemente estables, con casos documentados de sensores que mantienen la calibración para 25+ años en aplicaciones de transformadores.
Impacto: Prácticamente eliminación de los requisitos de recalibración., Reducir los costos de mantenimiento y garantizar datos confiables durante todo el ciclo de vida del transformador..
Gestión de carga dinámica
Enfoque convencional: Carga conservadora basada en las clasificaciones de la placa de identificación o modelos térmicos simplificados, a menudo dejando una capacidad significativa sin utilizar.
Ventaja de la fibra óptica: La medición de puntos de acceso en tiempo real permite una carga dinámica más allá de las clasificaciones nominales cuando las condiciones lo permiten, manteniendo límites térmicos seguros.
Impacto: Los estudios muestran aumentos de capacidad de 10-30% are often possible without exceeding design temperature limits, significantly enhancing asset utilization.
Cooling System Effectiveness Verification
Enfoque convencional: Limited ability to verify actual cooling system performance or detect partial cooling failures.
Ventaja de la fibra óptica: Multiple temperature sensors provide clear thermal signatures of cooling system effectiveness, instantly revealing plugged radiators, fallas del ventilador, or pump issues.
Impacto: Early detection of cooling problems before they impact transformer life or trigger alarms, permitiendo el mantenimiento proactivo.
Advanced Analytics Integration
Enfoque convencional: Limited temperature data restricts the effectiveness of asset health analytics.
Ventaja de la fibra óptica: Rico, multi-point temperature datasets enable sophisticated analysis including thermal modeling, remaining life estimation, and anomaly detection algorithms.
Impacto: Enhanced predictive maintenance capabilities, better capital planning, and reduced risk of unexpected failures.
Real-World Example: Capacity Release in Transmission Transformer
A major North American utility installed fiber optic temperature monitoring in a critical 500MVA transmission transformer previously limited to 85% loading due to conservative temperature estimates. Direct hotspot monitoring revealed actual temperatures were 12°C lower than calculated values during peak loading conditions. This enabled an immediate 15% increase in allowable loading, deferring a $5.2M capacity upgrade project by 4 years while maintaining full compliance with IEEE thermal guidelines.
Comparing Fiber Optic Technologies: EDE frente a. FBG vs. Fluoroptic Systems
The fiber optic temperature sensing market offers several distinct technologies, each with unique characteristics that make them suitable for different transformer monitoring applications. Understanding these differences is crucial for selecting the optimal solution for specific needs.
| Característica | Fluoroptic Systems | Rejilla de Bragg de fibra (FBG) | Detección de temperatura distribuida (EDE) |
|---|---|---|---|
| Principio de medición | Phosphorescent decay time measurement | Wavelength shift of reflected light | Raman backscatter intensity ratio |
| Precisión típica | ±0.2°C to ±0.5°C | ±0.5°C to ±1.0°C | ±1.0°C to ±2.0°C |
| Resolución espacial | Point measurements only | Point measurements (multiple per fiber) | Continuo (normalmente resolución de 1 m) |
| Maximum Points per System | 8-16 canales tipicos | 20-80 sensores por fibra | Thousands of measurement points |
| Measurement Speed | Rápido (multiple readings per second) | Moderado (1-10 seconds for full scan) | Slower (30 seconds to several minutes) |
| Probe Durability | Excellent for transformer environments | Bien, but requires strain management | Excellent with proper cable selection |
| System Cost Range | $15,000-$40,000 (8 canales) | $30,000-$60,000 (16-32 agujas) | $50,000-$100,000+ (full system) |
| Integration Complexity | Simple point-to-point architecture | Moderate complexity | Mayor complejidad, specialized software |
| Aplicaciones ideales | Direct winding hotspot monitoring | Multi-point monitoring with strain/vibration | Mapeo de superficies, casquillos, dirige, tanques |
Fluoroptic Technology Deep Dive
Fluoroptic technology (also called fluorescence decay method) has become the dominant approach for transformer winding hotspot monitoring due to its exceptional accuracy, estabilidad, and simplicity. These systems use a phosphorescent material at the sensor tip that, when excited by a light pulse, emits a fluorescent signal with decay characteristics directly proportional to temperature.
The time-based measurement approach makes these systems inherently immune to light intensity variations, pérdidas por flexión de la fibra, o degradación del conector. Leading manufacturers like Neoptix (acquired by Qualitrol) and Rugged Monitoring have refined this technology specifically for transformer applications.
Key advantages for transformer applications include:
- Máxima precisión (±0.2°C in controlled conditions)
- Exceptional long-term stability without recalibration
- Simple, robust probes that withstand transformer environments
- Fast response times for dynamic loading studies
- Compatibility with both new transformer installations and retrofits
FBG Technology Deep Dive
Fiber Bragg Grating technology utilizes microscopic modifications to the fiber core that create wavelength-specific reflectors. A medida que cambia la temperatura, these gratings expand or contract, shifting the reflected wavelength proportionally.
The key advantage of FBG systems is multiplexing capability, allowing dozens of discrete sensors on a single fiber. Some advanced systems combine temperature and vibration/strain measurement in the same fiber, providing multidimensional condition monitoring.
Key advantages for transformer applications include:
- Multiple measurements on a single fiber (reduced installation complexity)
- Combined temperature and vibration monitoring capabilities
- Good accuracy suitable for most applications
- Excellent EMI immunity and long-distance capabilities
- Lower per-point cost in large multi-sensor deployments
DTS Technology Deep Dive
Distributed Temperature Sensing provides continuous temperature measurement along the entire length of an optical fiber, en lugar de en puntos discretos. These systems operate based on the Raman scattering principle, where backscattered light includes temperature-dependent components.
Analizando la proporción de señales de Stokes y anti-Stokes y utilizando reflectometría en el dominio del tiempo para determinar la posición., Los sistemas DTS crean perfiles de temperatura completos. Aunque se utiliza tradicionalmente para distancias más largas en el monitoreo de tuberías o cables, Han surgido sistemas DTS especializados de alta resolución para aplicaciones de transformadores..
Key advantages for transformer applications include:
- Mapeo completo de la temperatura de la superficie sin planificación de la ubicación del sensor
- Capacidad de detectar puntos de acceso inesperados en cualquier lugar a lo largo de la ruta de fibra
- Excelente para monitoreo de bujes, conexiones de plomo, y superficies del tanque
- Instalación de fibra única para cientos o miles de puntos de medición
- Capacidades de visualización para mapeo térmico de transformadores completos.
Guía de selección de tecnología
Al seleccionar la tecnología de monitoreo de temperatura de fibra óptica para aplicaciones de transformadores, considere estas recomendaciones específicas de la aplicación:
For Critical Power Transformers (>100AMEU)
Recommended technology: Fluoroptic point sensors for direct winding hotspot monitoring, potentially combined with DTS for surface/bushing monitoring.
Razón fundamental: The highest accuracy and reliability are paramount for these critical assets, justifying the investment in premium point-sensing technology for direct winding monitoring.
For Distribution Transformers with Limited Access
Recommended technology: Sistemas DTS aplicados a superficies exteriores y zonas accesibles..
Razón fundamental: Cuando el acceso directo a la bobina no está disponible, DTS proporciona la solución de monitoreo más completa sin necesidad de sensores internos.
Para programas de monitoreo de flotas de transformadores
Recommended technology: Sistemas FBG con sensores multiplexados.
Razón fundamental: La rentabilidad de los sensores FBG multiplexados los hace atractivos para implementaciones a gran escala en múltiples transformadores., especialmente cuando se combina con una arquitectura de monitoreo centralizado.
Para aplicaciones de investigación y desarrollo
Recommended technology: Combinación de sensores fluorópticos y DTS de alta resolución.
Razón fundamental: R&Las aplicaciones D se benefician de la alta precisión de los sensores fluorópticos en ubicaciones críticas combinadas con la cobertura integral de los sistemas DTS para descubrir comportamientos térmicos inesperados..
Guía de implementación: Where and How to Install Fiber Optic Sensors in Transformers
Proper placement and installation of fiber optic temperature sensors is critical to realizing their full potential for transformer monitoring. This section provides detailed guidance on sensor location selection, installation methodologies, and best practices for both new and existing transformers.
Estrategias óptimas de colocación de sensores
The strategic placement of temperature sensors within a transformer requires balancing theoretical hotspot prediction with practical installation considerations:
Primary Winding Hotspots
For direct winding temperature measurement, sensors should be placed at the theoretical hotspot locations, típicamente:
- Top third of the winding height (aproximadamente 70-80% from bottom)
- Inner winding layers for disc-type windings
- Near the top oil ducts where oil flow may be restricted
- In areas with highest calculated current density
IEEE thermal models and manufacturer thermal simulations should guide specific placement in each transformer design.
Multiple Winding Coverage
Para un seguimiento completo, sensors should be distributed across different winding structures:
- Devanados de alto voltaje (típicamente 2-4 sensores)
- Devanados de baja tensión (típicamente 2-4 sensores)
- Tertiary windings (1-2 sensors if present)
- All three phases for three-phase transformers
This distribution enables comparative analysis between windings and phases to identify asymmetrical heating patterns that may indicate developing problems.
Supplementary Monitoring Points
Beyond primary winding measurements, additional strategic locations include:
- Core leg and yoke temperatures
- Main tank oil at different heights
- Cooling system inlet/outlet points
- Lead connections and bushings
- Compartimentos OLTC
These supplementary points create a more complete thermal profile of the transformer system.
Installation Methodologies
Instalación de fábrica (New Transformers)
Para transformadores nuevos, factory installation during manufacturing provides optimal sensor placement:
- Design Phase Integration: Sensor locations should be specified during the design phase, with thermal modeling determining optimal points.
- Winding Integration: Sensors are typically installed in specialized spacers, between disc windings, or in dedicated sensor channels designed into the winding structure.
- Enrutamiento de fibra: Fibers are carefully routed through the winding structure, avoiding sharp bends and potential stress points.
- Terminal Integration: Fibers exit the active part through specially designed sealing systems that maintain oil integrity while protecting the fibers.
- Extension Connection: Extension fibers connect from transformer tank to the monitoring equipment, typically using specialized feedthroughs.
Factory installation requires close coordination with the transformer manufacturer but provides the highest quality and most reliable installation.
Instalación de modernización (Existing Transformers)
For transformers already in service, several retrofit approaches are available:
- Thermometer Well Replacement: Existing thermometer wells can be replaced with specialized fiber optic probes that extend further into the oil, providing more accurate oil temperature measurement.
- Spare Valve Port Installation: Many transformers have spare 1″ or 2″ valves that can be used to insert specialized retrofit probes that extend toward winding structures.
- Inspection Port Access: During planned maintenance that involves opening inspection ports, custom probes can be installed that reach specific internal components.
- External Surface Monitoring: DTS systems can be installed on external tank surfaces, radiadores, and cooling equipment without any internal access.
While retrofit installations typically cannot achieve the same level of direct winding access as factory installations, they still provide valuable temperature data that significantly improves upon traditional indicators.
Mejores prácticas de implementación
Fiber Protection and Routing
- Use PTFE or specialized oil-resistant materials for fiber protection within the transformer
- Maintain minimum bend radius (típicamente >20milímetros) at all points
- Route fibers to avoid areas with highest electromagnetic fields when possible
- Secure fibers at regular intervals to prevent movement during transportation
- Provide strain relief at all transition points and connections
Connection and Termination
- Use oil-tight feedthroughs specifically designed for fiber optic applications
- Install terminal boxes with sufficient space for fiber service loops
- Label all fibers clearly with permanent identification
- Document exact sensor locations in transformer documentation
- Consider redundant fiber paths for critical measurement points
Monitoring Equipment Installation
- Place monitoring equipment in controlled environments when possible
- Ensure proper power supply with UPS backup for critical applications
- Provide appropriate surge protection for communication interfaces
- Use industrial-grade network equipment for SCADA integration
- Consider cybersecurity requirements for networked equipment
Puesta en marcha del sistema
- Verify all sensor readings before transformer energization
- Compare fiber optic readings with conventional indicators during initial operation
- Document baseline temperature profiles during various loading conditions
- Configure appropriate alarm thresholds based on transformer design limits
- Train operations personnel on system capabilities and limitations
Lista de verificación de implementación
Pre-Implementation Planning
- Define monitoring objectives and critical parameters
- Review transformer design and identify optimal sensor locations
- Select appropriate sensing technology for the application
- Define integration requirements with existing systems
- Establish budget and implementation timeline
System Design
- Specify number and location of temperature sensors
- Determine fiber routing paths and protection requirements
- Select appropriate feedthrough and connection systems
- Design monitoring equipment location and installation
- Plan communication interfaces and protocols
Implementación
- Coordinate installation with manufacturer or maintenance provider
- Document exact sensor locations during installation
- Test all optical connections before finalizing installation
- Verify signal quality and sensor response during testing
- Install and configure monitoring equipment
Commissioning and Operation
- Verify system operation during controlled testing
- Configure alarm thresholds and notification systems
- Integrate data with asset management systems
- Train operations and maintenance personnel
- Establish regular data review procedures
Estudios de casos del mundo real: Transformer Failure Prevention
The true value of fiber optic temperature monitoring becomes evident through real-world applications where these systems have prevented failures, extended transformer life, or enabled enhanced operational capabilities. The following case studies demonstrate the practical benefits across different transformer types and operating environments.
Estudio de caso 1: Early Detection of Cooling System Failure in GSU Transformer
Fondo
A 750MVA generator step-up transformer at a major thermal power plant was equipped with fiber optic temperature sensors in each phase of both primary and secondary windings during manufacture. The transformer had been in service for approximately 3 years when the monitoring system detected an anomaly.
Detección
During routine operation at 85% carga, operators noticed an alert from the fiber optic monitoring system indicating an unusual temperature differential between phases. While the C-phase winding temperature was 12°C higher than A and B phases, conventional oil temperature indicators showed normal readings with minimal difference between phases.
Investigation
The detailed temperature data from multiple sensors allowed engineers to identify a specific pattern: Las temperaturas se elevaron solo en una sección vertical del devanado de fase C., sugiriendo un problema de enfriamiento localizado en lugar de un problema eléctrico. La inspección reveló una ruta de flujo de aceite parcialmente bloqueada en uno de los circuitos de enfriamiento., causado por residuos de aislamiento de papel que restringen la circulación de aceite a esa sección del devanado.
Resultado
El transformador fue desconectado durante una reducción de generación planificada, y el problema de enfriamiento se resolvió lavando la ruta de enfriamiento afectada. Sin el sistema de monitoreo de fibra óptica, este calentamiento localizado probablemente no habría pasado desapercibido hasta que se produjo un daño significativo en el aislamiento, potencialmente conduciendo a una falla importante. La empresa de servicios públicos estimó que la detección temprana evitó una falla catastrófica que habría costado aproximadamente $6.5 million in replacement costs and lost generation.
Conclusión clave
The ability to detect temperature variations between phases and at specific locations within windings enables the identification of cooling problems that conventional monitoring would miss entirely. The temperature differential was well below the absolute alarm thresholds but represented a significant deviation from normal patterns.
Estudio de caso 2: Dynamic Loading Capability in Urban Substation Transformer
Fondo
A major urban utility faced growing load demands in a downtown area served by three 115/13.8kV, 60MVA transformers in a capacity-constrained substation. Load growth projections indicated that capacity would be exceeded during peak summer conditions, but substation expansion was extremely costly and complicated by space limitations and permitting challenges.
Implementación
En lugar de buscar inmediatamente la expansión de la subestación, La empresa de servicios públicos modernizó los tres transformadores con sistemas de monitoreo de temperatura de fibra óptica para permitir una carga dinámica más allá de las clasificaciones nominales cuando las condiciones lo permitieran.. Cada transformador estaba equipado con 8 Sensores de fibra óptica que monitorean los puntos calientes de los sinuosos., aceite superior, y condiciones ambientales.
Estrategia operativa
Uso de los datos de temperatura del punto de acceso en tiempo real, La empresa de servicios públicos implementó un programa de carga dinámica que permitió operar los transformadores de manera segura hasta 130% de la clasificación de la placa de identificación cuando las temperaturas reales medidas permanecieron por debajo de los límites de diseño. El sistema incorporó temperatura ambiente., estado del sistema de enfriamiento, y cargar el historial en las decisiones de carga.
Resultados
Durante la primera temporada alta de verano después de la implementación, la subestación manejó con éxito cargas de hasta 125% de capacidad nominal sin exceder los límites de temperatura de diseño. The monitoring system revealed that previous loading restrictions had been overly conservative, as actual winding temperatures remained 15-20°C below critical limits even at these elevated loads. The measured hotspot temperatures showed a strong correlation with ambient temperature and cooling efficiency rather than simply load percentage.
Financial Impact
The dynamic loading capability enabled by the monitoring system deferred a $12M substation expansion project by 4 años, while the total investment in monitoring equipment was approximately $425,000. This represented an ROI exceeding 2,000% while maintaining transformer safety and reliability.
Conclusión clave
Real-time fiber optic monitoring enables safe, condition-based loading decisions rather than relying solely on conservative nameplate ratings, unlocking significant latent capacity in existing transformer assets without compromising reliability or asset life.
Estudio de caso 3: Early Detection of Developing Winding Deformation
Fondo
A 400kV/220kV, 500MVA autotransformer in a critical transmission interconnection substation was equipped with 12 fiber optic temperature sensors distributed throughout the windings. The transformer had experienced a through-fault event six months prior but had passed all standard diagnostic tests including DGA, factor de potencia, and short-circuit impedance measurements.
Detección
The fiber optic monitoring system began detecting unusual thermal behavior not evident in conventional monitoring: during daily load cycling, one specific sensor in the common winding showed a thermal response that increasingly lagged behind other sensors in similar positions. While absolute temperature values remained within acceptable limits, the thermal time constant of this specific location had changed significantly compared to baseline data.
Análisis
Advanced analysis of the thermal behavior suggested that the localized change in thermal time constant was consistent with a change in cooling flow patterns potentially caused by minor geometric deformation affecting oil flow channels. This hypothesis was supported by comparing thermal response patterns before and after the through-fault event, showing a clear change in thermal behavior despite normal DGA results.
Verificación
Based on the fiber optic data, the utility performed specialized low-voltage impulse (LVI) testing that confirmed subtle winding deformation not detected by standard tests. La inspección interna posterior durante una parada planificada reveló un desplazamiento menor de los soportes de bobinado que, aunque no es una amenaza inmediata, Probablemente habría empeorado con el tiempo debido a los ciclos térmicos y las fuerzas electromagnéticas durante el funcionamiento normal..
Resultado
La detección temprana permitió acciones correctivas planificadas durante una ventana de mantenimiento programada en lugar de una respuesta de emergencia a una falla.. El equipo de gestión de activos de la empresa de servicios públicos estimó que reconocer tempranamente este problema en desarrollo evitó una posible falla que habría costado $8-10 millones en daños y reemplazo de equipos, además de costos incalculables asociados con limitaciones de transmisión en áreas amplias que habrían resultado de una interrupción no planificada de este activo crítico.
Conclusión clave
The detailed temperature data from fiber optic systems can detect subtle changes in transformer thermal behavior that serve as early indicators of developing mechanical problems, even when conventional electrical tests and dissolved gas analysis show normal results.
Common Failure Patterns Detected by Fiber Optic Monitoring
Analysis of numerous case studies reveals several common patterns where fiber optic temperature monitoring has successfully identified developing problems:
Degradación del sistema de refrigeración
- Signature: Gradual increase in temperature differentials between top and bottom sensors during load cycles
- Early detection advantage: 3-6 months before conventional indicators
- Prevention potential: Alto – easily correctable if detected early
Localized Winding Distortion
- Signature: Changed thermal time constant in specific winding sections following through-fault events
- Early detection advantage: 6-24 months before electrical test detection
- Prevention potential: Moderado – may require de-tanking but avoids catastrophic failure
Deteriorating Internal Connections
- Signature: Localized heating near lead connections disproportionate to overall loading
- Early detection advantage: 1-3 months before significant damage
- Prevention potential: muy alto – relatively simple repair if caught early
Insulation Degradation Hotspots
- Signature: Progressively increasing heating in specific locations even at constant load
- Early detection advantage: 6-18 months before DGA detection
- Prevention potential: Moderate to high depending on location
Análisis del retorno de la inversión: The Business Case for Fiber Optic Temperature Monitoring
The decision to invest in fiber optic temperature monitoring requires clear understanding of both costs and benefits. This section presents a comprehensive business case framework to help asset managers and engineers evaluate the return on investment for different transformer applications.
Implementation Cost Components
Hardware Costs
- Sondas de temperatura de fibra óptica: $500-$1,500 por sensor
- Signal conditioner/monitor: $5,000-$25,000 dependiendo del número de canales
- Extension fibers and accessories: $1,000-$5,000 por transformador
- Materiales de instalación (pasamuros, cajas de conexiones): $1,500-$3,000
- Communication equipment: $1,000-$3,000
Installation Costs
- Instalación de fábrica (nuevos transformadores): $5,000-$15,000
- Retrofit installation (transformadores existentes): $10,000-$30,000
- Engineering design and documentation: $3,000-$8,000
- Commissioning and testing: $2,000-$5,000
Operational Costs
- Annual maintenance and calibration: $500-$1,500
- Software updates and support: $1,000-$3,000 anualmente
- Data storage and management: $500-$2,000 anualmente
- Periodic system checks: $500-$1,000 anualmente
Typical Total Implementation Costs by Transformer Type
- Generation Step-Up Transformer (500AMEU+): $50,000-$80,000 for comprehensive system
- Transmission Transformer (100-300AMEU): $35,000-$60,000 for standard implementation
- Transformador de distribución (10-50AMEU): $20,000-$40,000 for basic monitoring
- Fleet monitoring program (modernización): $25,000-$40,000 per transformer with shared infrastructure
Quantifiable Benefits
Valor de prevención de fallas
The primary value driver for most implementations is reducing the probability of catastrophic failures. Este valor se puede calcular como:
Valor de prevención de fallas = Probabilidad base de falla × Costo de falla × Factor de reducción de riesgo
Dónde:
- Probabilidad de falla base: Tasa histórica de falla anual para transformadores similares (típicamente 0.5-2% para transformadores de potencia)
- Costo del fracaso: Costo total de la falla, incluido el reemplazo del equipo., daño colateral, impactos de la interrupción, y limpieza ambiental
- Factor de reducción de riesgos: Reducción estimada de la probabilidad de falla (típicamente 30-60% basado en estudios de la industria)
Ejemplo de cálculo para transformador GSU:
- Probabilidad de falla anual base: 1.2%
- Costo del fracaso: $5,500,000 (incluyendo reemplazo de $3 millones, $1mano de obra, $1.5M generación perdida)
- Factor de reducción de riesgo: 50%
- Valor anual: 1.2% × $5,500,000 × 50% = $33,000 por año
Valor de vida extendida de los activos
La carga optimizada y la gestión de refrigeración mejorada pueden extender la vida útil del transformador más allá de las expectativas de diseño.:
Valor de extensión de vida = (Costo de reemplazo / Vida esperada original) × Años extendidos
Dónde:
- Costo de reemplazo: Current cost to replace the transformer
- Vida esperada original: Design life without advanced monitoring (típicamente 25-40 años)
- Years Extended: Additional service years enabled by optimized operation (típicamente 3-8 años)
Example calculation for transmission transformer:
- Replacement cost: $2,800,000
- Original expected life: 35 años
- Years extended: 5 años
- Valor anual: ($2,800,000 / 35) × 5 / 35 = $11,429 por año
Capacity Release Value
Dynamic loading enabled by real-time temperature monitoring often allows safe operation above nameplate ratings:
Capacity Release Value = Capacity Increase × Load Factor × Value of Capacity
Dónde:
- Capacity Increase: Additional MVA available beyond nameplate (típicamente 10-30%)
- Load Factor: Percentage of time that additional capacity would be utilized
- Value of Capacity: Cost of alternative capacity solutions (nuevos transformadores, generation, etc.)
Example calculation for substation transformer:
- Transformer rating: 60AMEU
- Capacity increase: 15% (9AMEU)
- Load factor for additional capacity: 20% (peak periods only)
- Value of capacity: $50,000 per MVA (based on substation expansion costs)
- Valor anual: 9MVA × 20% × $50,000 = $90,000 por año
Maintenance Optimization Value
El mantenimiento basado en la condición habilitado por un monitoreo detallado de la temperatura puede reducir los costos de mantenimiento de rutina:
Ahorros en mantenimiento = Costo de mantenimiento tradicional × Porcentaje de reducción
Dónde:
- Costo de mantenimiento tradicional: Gasto anual en mantenimiento programado
- Porcentaje de reducción: Eficiencia obtenida mediante un enfoque basado en la condición (típicamente 15-30%)
Cálculo de ejemplo:
- Costo de mantenimiento anual tradicional: $25,000
- Porcentaje de reducción: 20%
- Valor anual: $25,000 × 20% = $5,000 por año
Ejemplos de ROI por clase de transformador
| Tipo de transformador | Costo de implementación | Annual Benefits | Período de recuperación | 10-Año retorno de la inversión |
|---|---|---|---|---|
| Avance generacional (GSU) 500AMEU+ | $75,000 | $95,000 (Prevención de fallas: $65k, extensión de vida: $15k, Mantenimiento: $15k) |
0.8 años | 1,167% |
| Transmisión crítica 300MVA | $55,000 | $65,000 (Prevención de fallas: $40k, Capacidad: $20k, Mantenimiento: $5k) |
0.85 años | 1,082% |
| Transformador Subestación 100MVA | $45,000 | $38,000 (Prevención de fallas: $18k, Capacidad: $15k, extensión de vida: $5k) |
1.2 años | 744% |
| Transformador de Distribución 25MVA | $30,000 | $16,000 (Prevención de fallas: $8k, Capacidad: $5k, Mantenimiento: $3k) |
1.9 años | 433% |
Guía de cálculo del ROI
Para desarrollar un análisis de retorno de la inversión preciso para sus aplicaciones de transformadores específicas, considere estas pautas:
- Priorizar los activos críticos: Centrar las implementaciones iniciales en transformadores donde la falla tendría el mayor impacto operativo y financiero..
- Consider fleet-wide efficiencies: Implementing monitoring across multiple similar transformers can reduce per-unit costs through shared infrastructure and volume discounts.
- Evaluate both operational and capital benefits: Include both immediate operational improvements and long-term capital deferral benefits in your analysis.
- Incorporate risk-adjusted values: When calculating failure prevention benefits, use risk-adjusted values that account for both probability and consequence.
- Consider installation timing: Factory installation in new transformers is significantly more cost-effective than retrofits, with better sensor placement options.
- Account for organizational learning: Initial implementations may have longer payback periods as organizations develop expertise in using the data effectively.
Business Case Development Tip
When presenting the business case for fiber optic temperature monitoring to executives or budget committees, emphasize these key points:
- The asymmetrical risk profile of transformer failures (low probability but extremely high consequence)
- The non-linear aging effects of temperature on insulation life
- The value of early detection of developing issues before they become critical failures
- The opportunity cost of constrained transformer capacity in growing load areas
- Case studies from peer utilities that demonstrate real-world value realization
Guía de selección: How to Choose the Right Fiber Optic System for Your Transformers
With multiple fiber optic temperature monitoring technologies and vendors in the market, selecting the optimal solution requires careful consideration of your specific requirements, transformer characteristics, and organizational capabilities. This section provides a structured framework for evaluating and selecting the most appropriate system.
Defining Your Requirements
Before evaluating specific technologies or vendors, clearly define your monitoring objectives and requirements:
Primary Monitoring Objectives
- Prevención de fallas (focus on reliability)
- Dynamic loading capability (focus on capacity utilization)
- extensión de vida (focus on aging management)
- Investigación y desarrollo (focus on detailed insights)
- Cumplimiento normativo (focus on documentation)
Different objectives may lead to different technology choices and implementation approaches.
Transformer Characteristics
- Size and voltage class
- Criticality to system operation
- Age and condition
- Cargando patrones (steady, cyclic, emergencia)
- Cooling system type (ONÁN, ENCENDIDO APAGADO, OFAF, etc.)
- Replacement lead time and cost
Larger, more critical transformers typically justify more comprehensive monitoring systems.
Restricciones de instalación
- New manufacture or retrofit
- Access points for retrofit installation
- Available outage windows
- Physical location and environment
- Distance to monitoring equipment
Installation options significantly impact both cost and monitoring effectiveness.
Requisitos de integración
- Existing SCADA or DCS systems
- Plataformas de gestión de activos
- Protocolos de comunicación (Modbus, DNP3, CEI 61850)
- Cybersecurity requirements
- Remote access needs
Seamless integration with existing systems increases the value of monitoring data.
Technology Selection Matrix
Based on your defined requirements, use this comparison matrix to identify the most appropriate technology approach:
| Requisito | Fluoroptic Point Sensing | Rejilla de Bragg de fibra (FBG) | Detección de temperatura distribuida (EDE) |
|---|---|---|---|
| Direct winding hotspot monitoring | Excelente | Bien | Justo |
| Multiple measurement points needed | Bien (arriba a 16 típico) | Excelente (20+ on single fiber) | Excelente (continuous profile) |
| Highest accuracy requirement | Excelente (±0,2 °C) | Bien (±0,5 °C) | Justo (±1,0 °C) |
| External surface monitoring | Justo (limited points) | Bien (multiple points) | Excelente (full coverage) |
| Respuesta dinámica rápida | Excelente (sub segundo) | Bien (artículos de segunda clase) | Justo (minutos) |
| Retrofit installation | Bien (sondas especializadas) | Justo (requiere un manejo especial) | Excelente (instalación externa) |
| Instalación de fábrica | Excelente (sondas robustas) | Bien (requiere manejo de tensión) | Bien (Se necesitan fibras especiales.) |
| Estabilidad a largo plazo | Excelente (25+ años) | Bien (sensibilidad a la tensión) | Bien (requiere calibración) |
| Implementación en toda la flota | Bien (monitores dedicados) | Excelente (multiplexación) | Justo (mayor costo inicial) |
| Restricciones presupuestarias | Bien (escalable) | Justo (mayor inversión inicial) | Pobre (costo inicial más alto) |
Criterios de evaluación de proveedores
Una vez que haya identificado el enfoque tecnológico adecuado, evaluar proveedores potenciales utilizando estos criterios clave:
Rendimiento del producto
- Especificaciones de precisión y métodos de validación.
- Rango de temperatura y capacidad de medición.
- Tiempo de respuesta y tasa de muestreo
- Requisitos de calibración y estabilidad.
- Interfaces y protocolos de comunicación.
- Capacidades y usabilidad del software.
Experiencia en la industria energética
- Años de experiencia en monitoreo de transformadores.
- Base instalada y clientes de referencia
- Comprensión del comportamiento térmico del transformador.
- Experience with your transformer manufacturers
- Case studies and documented successes
- Industry standards compliance (IEEE, CEI)
Instalación y soporte
- Installation methodology and documentation
- Field service capabilities and coverage
- Training programs for users
- Technical support response time and quality
- Warranty terms and conditions
- Spare parts availability and lead times
Company Stability
- Financial stability and longevity
- R&D investment and product development
- Manufacturing quality control processes
- Industry partnerships and certifications
- Long-term product support commitment
- Merger/acquisition history and stability
Leading Providers in 2025
While a comprehensive vendor evaluation should be performed for your specific requirements, these companies are recognized as leading providers of fiber optic temperature monitoring solutions for power transformers as of 2025:
qualitrol / Neoptix
Specializing in fluoroptic temperature monitoring systems with extensive transformer installation experience and integration with broader asset monitoring platforms. Their T2 temperature probes have become an industry standard for transformer applications.
Monitoreo robusto
Ofrece sistemas fluorópticos de alta precisión con sondas de transformador especializadas y software de monitoreo.. Sus sistemas cuentan con una excelente inmunidad EMI y están diseñados específicamente para entornos eléctricos hostiles..
Lumasense Technologies
Proporciona sistemas distribuidos de detección de temperatura tanto fluorópticos como de fibra óptica con un enfoque en aplicaciones de la industria energética., incluyendo software especializado para análisis térmico de transformadores.
Detección AP
Líderes en detección distribuida de temperatura de alta resolución (EDE) tecnología con soluciones especializadas para monitoreo de transformadores, permitiendo un mapeo térmico completo con una sola instalación de fibra.
Tecnología LIOS
Se especializa en sistemas DTS con alta resolución espacial adecuados para aplicaciones de transformadores., ofreciendo soluciones que pueden detectar pequeños puntos calientes a lo largo de tendidos de cables y superficies de transformadores.
Óptica micrométrica / Innovaciones Luna
Se centra en la rejilla de Bragg de fibra (FBG) technology for multiple sensing points on a single fiber, with solutions that can monitor both temperature and vibration in transformer applications.
Sensornet
Provides advanced DTS solutions with specialized software for power industry applications, offering high-resolution temperature profiles for transformer monitoring.
Selection Process Recommendations
- Develop detailed specifications based on your monitoring objectives and transformer characteristics
- Issue a targeted RFI/RFQ to qualified vendors with demonstrated transformer experience
- Request detailed reference information from installations similar to your application
- Evaluate total cost of ownership including initial installation, ongoing support, and integration
- Consider arranging site visits to existing installations or requesting demonstration units
- Verify compatibility with your existing systems and data management platforms
- Assess vendor commitment to long-term support and product evolution
Tendencias futuras: The Evolution of Fiber Optic Monitoring in 2025 and Beyond
As we progress through 2025, fiber optic temperature monitoring for transformers continues to evolve, with several emerging trends shaping the future of this technology. Understanding these developments helps utilities and industrial users prepare for next-generation capabilities and ensure that current investments remain future-proof.
Multi-Parameter Fiber Optic Sensing
The most significant evolution in fiber optic monitoring is the integration of multiple sensing parameters beyond temperature in the same fiber optic system:
- Monitoreo de vibraciones using the same fibers that measure temperature, enabling detection of mechanical issues including loose windings, problemas centrales, or cooling system anomalies
- Detección de descarga parcial through specialized acoustic sensing fibers that can pinpoint insulation breakdown locations
- Strain measurement to detect subtle dimensional changes in windings before they cause serious damage
- Contenido de humedad assessment through specialized coating technologies that respond to oil moisture levels
These multi-parameter systems provide more comprehensive transformer health insights while leveraging the same installation infrastructure, improving the cost-benefit ratio significantly.
Advanced Analytics and AI Integration
The value of temperature data is being dramatically enhanced through sophisticated analytics and artificial intelligence:
- Digital twin integration combining real-time temperature data with physics-based transformer models to simulate and predict behavior under various conditions
- Pattern recognition algorithms that identify subtle temperature signatures associated with developing problems
- Anomaly detection using machine learning to establish normal thermal behavior patterns and flag deviations that warrant investigation
- Predictive remaining life models that combine temperature history with insulation aging algorithms to accurately forecast asset lifespan
- Fleet-wide analytics comparing thermal behavior across similar transformers to identify outliers and best practices
These advanced analytics transform raw temperature data into actionable insights that drive maintenance decisions and operational strategies.
Enhanced Integration and Standardization
The integration landscape for fiber optic monitoring is advancing rapidly:
- CEI 61850 perfiles specifically for fiber optic temperature data, enabling standardized integration with substation automation systems
- Gestión del rendimiento de activos (APM) platform integration feeding temperature data into comprehensive health indices and risk models
- OEM integration with transformer manufacturers embedding sensors and offering factory-integrated monitoring solutions
- Cloud-based monitoring platforms enabling centralized analysis of temperature data across entire transformer fleets
- Mobile application interfaces providing field personnel with real-time temperature data and historical trends
Estas capacidades de integración garantizan que el monitoreo de la temperatura se convierta en parte de un enfoque holístico de gestión de activos en lugar de un sistema independiente..
Avances en el rendimiento técnico
La mejora continua en la tecnología de detección de fibra óptica está mejorando las capacidades del sistema.:
- Mayor precisión de temperatura con sensores de nueva generación que alcanzan ±0,1°C en condiciones de campo
- Resolución espacial mejorada en sistemas DTS, ahora alcanza una resolución de 10-25 cm para una ubicación precisa del punto de acceso
- Tasas de muestreo más rápidas permitiendo el análisis transitorio en tiempo real durante condiciones de falla u operaciones de conmutación
- Rangos operativos extendidos para aplicaciones en entornos extremos hasta 350°C
- Sistemas de autocalibración con puntos de referencia internos que garantizan la estabilidad de la medición a largo plazo
- Sensores miniaturizados con diámetros inferiores a 0,5 mm para un impacto mínimo en el diseño del transformador
These performance improvements expand the application range and value proposition of fiber optic monitoring.
Economic and Market Evolution
The business landscape for fiber optic monitoring is also evolving rapidly:
- Decreasing system costs as manufacturing scales and component prices decline, making monitoring viable for smaller transformers
- Service-based business models where vendors offer monitoring-as-a-service rather than equipment sales
- Insurance incentives as underwriters recognize the risk reduction value of fiber optic monitoring
- Regulatory recognition of condition monitoring as part of reliability compliance programs
- Industry consolidation as larger monitoring platform providers acquire specialized fiber optic technology companies
These market developments are expanding adoption beyond traditional high-value applications to broader transformer fleets.
Emerging Applications in 2025 and Beyond
Grid-Scale Battery Systems
Fiber optic temperature monitoring is increasingly being adapted for grid-scale battery energy storage systems (BESS) where thermal management is critical for safety and performance. The EMI immunity of fiber optics is particularly valuable in these high-power converter environments.
HVDC Transformer Monitoring
As HVDC transmission expands, specialized fiber optic monitoring systems are being developed for the unique thermal challenges of converter transformers, including the extreme EMI environment and specialized insulation systems.
Phase-Shifting Transformers
Complex phase-shifting transformers with multiple magnetic circuits and windings benefit from comprehensive temperature mapping to optimize performance and identify potential design limitations.
Renewable Integration Transformers
Transformers connected to wind and solar generation face unique thermal challenges due to variable loading and harmonics, driving adoption of advanced monitoring to manage these dynamic conditions.
Strategic Recommendations for Forward-Looking Implementation
To ensure that current fiber optic monitoring investments remain valuable as technology evolves:
- Especificar sistemas de arquitectura abierta. que puede integrarse con plataformas emergentes y admitir múltiples protocolos de comunicación
- Considere la futura expansión del sensor instalando fibras adicionales durante el despliegue inicial, incluso si no se utilizan inmediatamente
- Priorizar la accesibilidad de los datos a través de formatos estándar y API que respaldarán futuras capacidades de análisis
- Seleccione proveedores con hojas de ruta de innovación claras que demuestran compromiso con el desarrollo continuo de productos
- Desarrollar experiencia interna en la interpretación de datos de temperatura para maximizar el valor de los sistemas actuales y futuros
- Incluir el monitoreo de temperatura en las iniciativas de transformación digital como parte de estrategias más amplias de modernización de la red
- Participar en el desarrollo de estándares de la industria. para garantizar la futura interoperabilidad y las mejores prácticas
Expert Insight: Dr. Elena Michaels, Comité de transformadores IEEE
“Mientras miramos hacia 2030, fiber optic monitoring will evolve from a specialized technology to a standard feature of critical transformers. The integration of temperature data with other parameters like dissolved gas, descarga parcial, and vibration will create comprehensive health models that transform maintenance approaches. Utilities implementing fiber optic monitoring today are not just gaining immediate operational benefits but building the foundation for truly condition-based asset management.”
Conclusión: Implementing a Fiber Optic Temperature Monitoring Strategy
Fiber optic temperature monitoring has evolved from an emerging technology to an essential component of modern transformer management. As we’ve explored throughout this guide, these systems offer unprecedented insight into transformer thermal behavior, enabling enhanced reliability, optimized capacity utilization, y vida útil extendida de los activos.
Conclusiones clave
Beneficios operativos
Direct hotspot measurement provides accurate, real-time visibility into transformer thermal conditions, enabling safe dynamic loading beyond nameplate ratings while preventing dangerous overtemperature conditions. This visibility translates directly into enhanced capacity utilization and operational flexibility.
Financial Value
The business case for fiber optic monitoring is compelling, with typical payback periods under two years for critical transformers. Value drivers include failure prevention, extensión de vida, capacity release, and maintenance optimization, with 10-year ROI often exceeding 500% for important assets.
Evolución de la tecnología
Multiple fiber optic technologies (fluoroptic, FBG, EDE) offer different advantages for specific applications. Technology selection should be driven by monitoring objectives, transformer characteristics, y limitaciones de implementación, with careful consideration of future integration needs.
Implementation Approach
Successful implementation requires careful consideration of sensor placement, installation methodology, integración del sistema, and organizational readiness. Factory installation provides optimal results for new transformers, while several retrofit options exist for existing assets.
Hoja de ruta de implementación
For organizations beginning or expanding their fiber optic monitoring programs, we recommend this implementation approach:
Fase 1: Strategy and Assessment (1-3 meses)
- Define monitoring objectives and value drivers
- Conduct transformer fleet criticality assessment
- Identify high-priority candidates for monitoring
- Develop business case and secure funding
- Assess integration requirements with existing systems
Fase 2: Technology Selection (1-2 meses)
- Develop detailed monitoring specifications
- Evaluate technology options against requirements
- Issue RFI/RFQ to qualified vendors
- Conduct technical and commercial evaluation
- Select monitoring technology and vendor
Fase 3: Pilot Implementation (3-6 meses)
- Implement monitoring on 2-3 priority transformers
- Develop data analysis and response procedures
- Train operations and maintenance personnel
- Establish baseline thermal profiles
- Configure integration with existing systems
Fase 4: Program Expansion (6-24 meses)
- Develop fleet-wide implementation plan
- Prioritize transformers based on criticality and opportunity
- Coordinate with maintenance schedules for retrofits
- Specify monitoring for new transformer purchases
- Implement centralized monitoring infrastructure
Fase 5: Optimización de valor (En curso)
- Develop advanced analytics capabilities
- Integrate temperature data into asset health models
- Implement dynamic loading procedures
- Quantify and report realized benefits
- Continually evaluate new technology developments
Pensamientos finales
As transformer fleets age and grid demands evolve, the visibility provided by fiber optic temperature monitoring becomes increasingly valuable. From preventing catastrophic failures to safely extending asset life and releasing latent capacity, these systems offer compelling benefits across operational, financiero, y dimensiones de gestión de riesgos.
La tecnología sigue avanzando rápidamente, con rendimiento mejorado, capacidades multiparamétricas, y una integración más profunda con plataformas de gestión de activos más amplias. Las organizaciones que hoy implementan el monitoreo de fibra óptica no solo abordan las necesidades operativas inmediatas, sino que también se posicionan para la tecnología basada en datos., Enfoques de gestión de activos basados en la condición que definirán el funcionamiento de la red en las próximas décadas..
Siguiendo las pautas de esta guía completa, Las empresas de servicios públicos y los operadores industriales pueden implementar programas efectivos de monitoreo de fibra óptica que brinden valor inmediato y al mismo tiempo construyan las bases para capacidades futuras.. Mientras navegamos por los complejos desafíos de la transformación de la red y el envejecimiento de la infraestructura, these advanced monitoring technologies will be essential tools for ensuring reliability, optimizing investments, and managing critical transformer assets.
Additional Resources
Estándares de la industria
- IEEE C57.91-2011: Guide for Loading Mineral-Oil-Immersed Transformers
- IEEE C57.118: Guide for Installation of Fiber Optic Sensors in Transformers
- CEI 60076-7: Loading Guide for Oil-Immersed Power Transformers
- Folleto técnico de CIGRE 659: Transformer Thermal Monitoring
Technical Papers
- “Transformer Winding Temperature Measurement Using Fiber Optic Technology” – IEEE Transactions on Power Delivery
- “Comparative Analysis of Fluoroptic and FBG Sensors for Transformer Applications” – CIGRE Session Papers
- “Field Experience with Fiber Optic Temperature Monitoring in Power Transformers” – IEEE PES Transactions
- “Dynamic Transformer Rating Based on Direct Winding Temperature Measurement” – EPRI Technical Report
Industry Associations
- Comité de transformadores IEEE – Working Group on Fiber Optic Sensors
- CIGRE A2 (Transformadores) Working Group on Transformer Monitoring
- Electric Power Research Institute (EPRI) – Transformer Monitoring Program
- International Electrotechnical Commission (CEI) Technical Committee 14
Training Resources
- IEEE Educational Courses on Transformer Monitoring
- EPRI Transformer Health Assessment Workshops
- Vendor-provided Technical Training Programs
- Online Courses on Fiber Optic Sensing Technology

Sensor de temperatura de fibra óptica, Sistema de monitoreo inteligente, Fabricante distribuido de fibra óptica en China
 |
 |
 |