 INNO faseroptische Temperatursensoren ,Temperaturüberwachungssysteme.
- Overheating at switchgear contacts causes 60-70% of electrical distribution failures – Temperaturüberwachung mit fluoreszierender Glasfaser provides intrinsically safe, real-time condition monitoring solutions
- Faseroptische Temperatursensoren offer complete electrical isolation and immunity to electromagnetic interference, withstanding voltages exceeding 100kV while maintaining direct contact with energized conductors
- Industry-leading measurement accuracy of ±1°C with response time under 1 zweite significantly outperforms wireless temperature monitoring systems (±2-3°C, 3-5 zweite Antwort)
- Scalable architecture supporting 1-64 monitoring channels per demodulator unit, suitable for 10kV to 500kV switchgear applications across substations, Rechenzentren, und Industrieanlagen
- 25+ years operational lifespan with zero battery replacement requirements and fiber transmission distances up to 80 Meter enable true maintenance-free long-term deployment
- Complete immunity to RF interference and strong electric fields delivers reliability far superior to wireless temperature monitoring and infrared thermography alternatives
- Integriert RS485 Modbus communication, customizable alarm thresholds, temperature trend analysis, and predictive maintenance capabilities through centralized monitoring software
- Proven compliance with international standards including IEC 62271 and DL/T 1500-2016, with successful deployments in substations, industrial rectifier systems, and critical power distribution infrastructure globally
Inhaltsverzeichnis
- Why Do Switchgear Cabinets Overheat and Which Components Are Most Vulnerable?
- What Hazards and Economic Losses Result from Switchgear Temperature Rise?
- What Limitations and Safety Risks Exist with Traditional Temperature Monitoring Methods?
- How Do Fluorescent Fiber Optic Temperature Monitoring Systems Work?
- What Are the Core Advantages of Fiber Optic Temperature Sensors Compared to Wireless Systems?
- What Technical Specifications Define Fluorescent Fiber Optic Temperature Probes?
- How Are Temperature Monitoring Points Configured in High Voltage Switchgear?
- What Are the Critical Monitoring Locations in Medium Voltage Switchgear (10kV-35kV)?
- Why Do Rectifier Cabinets Require Specialized Temperature Monitoring?
- What Additional Parameters Should Be Monitored Beyond Temperature?
- How Is Multi-Parameter Condition Monitoring System Architecture Designed?
- What Installation Methods Apply to Live Switchgear Equipment?
- Global Customer Application Case Studies
- Häufig gestellte Fragen (FAQ)
1. Why Do Switchgear Cabinets Overheat and Which Components Are Most Vulnerable?

Switchgear overheating originates primarily from increased contact resistance at current-carrying connections. The four most critical heat-generating locations include:
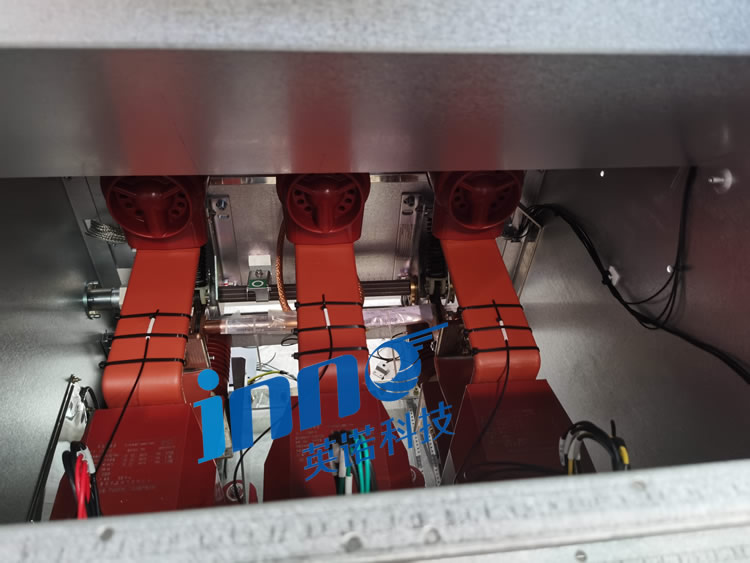
Kontakte des Leistungsschalters (Moving and Fixed)
Contact resistance increases due to surface oxidation, mechanischer Verschleiß, and erosion from arc discharge. In Vakuum-Leistungsschalter, contact degradation accelerates after 5,000-10,000 Schaltvorgänge. SF6-Leistungsschalter experience similar degradation, with contact resistance potentially increasing 200-300% over equipment lifespan.
Sammelschienenverbindungen und Verbindungspunkte
Bolted busbar connections loosen from thermal cycling, Vibration, and inadequate torque application during installation. Studien deuten darauf hin 40-60% von Mittelspannungsschaltanlage installations exhibit undertorqued connections. A 20% reduction in contact pressure can double joint resistance.
Disconnect Switch Contact Points
Knife-blade type isolator switches are particularly vulnerable. Oxidation layers form on contact surfaces, especially in humid environments. Spring pressure degradation over 10-15 years reduces contact force by 30-50%, exponentially increasing resistance.
Cable Terminations and Lugs
Improper crimping techniques, dissimilar metal connections (aluminum-copper), and inadequate surface preparation create high-resistance joints. Thermal expansion mismatch between conductors and termination hardware progressively loosens connections.
Thermal Runaway Mechanism
Increased resistance generates heat following I²R losses. Elevated temperature further increases resistance (positive temperature coefficient), creating a destructive feedback loop. Without intervention, this cascade leads to insulation failure and catastrophic equipment damage.
2. What Hazards and Economic Losses Result from Switchgear Temperature Rise?
Temperature abnormalities in Hochspannungsschaltanlagen initiate a predictable progression of equipment degradation:
40-60°C Temperature Range
Contact resistance begins measurable increase. Oxidation rates on copper and aluminum surfaces accelerate. This represents the optimal intervention window where faseroptische Temperaturüberwachung enables preventive maintenance before permanent damage occurs.
60-80°C Temperature Range
Insulation material aging accelerates exponentially – following the Arrhenius equation, each 10°C rise doubles degradation rate. Epoxy resin compounds lose mechanical strength. Kabelisolierung (XLPE, EPR) begins premature aging, reducing expected 30-year lifespan to 15-20 Jahre.
80-105°C Temperature Range
Equipment protection systems may trip, causing unplanned outages. In industrial facilities, sudden power loss to critical processes results in production losses of $10,000-$100,000 pro Stunde. Data centers experience potential equipment damage and service interruptions.
Above 105°C
Dielectric breakdown probability increases dramatically. Thermoplastic components deform. Silver-plated contacts exhibit rapid tarnishing. Risk of fire ignition, explosion (in oil-filled equipment), and total equipment destruction.
Documented Failure Statistics
Industry data from utility companies and industrial facilities reveals that contact overheating accounts for 65-75% von switchgear failures. Equipment without continuous monitoring experiences failure rates 8-12 times higher than monitored installations. Annual economic losses from overheating-related failures exceed $500 million globally, with indirect costs (Produktionsausfall, emergency repair mobilization) representing 5-10× direct replacement costs.
3. What Limitations and Safety Risks Exist with Traditional Temperature Monitoring Methods?
Infrared Thermography and Thermal Imaging
Vorteile: Berührungslose Messung, visual thermal maps, rapid area scanning
Critical Limitations:
- Cannot penetrate metal enclosures – requires equipment de-energization and door opening (safety hazard, arc flash risk)
- Emissivity variations cause ±5-8°C measurement errors on oxidized, painted, or polished surfaces
- Periodic inspection only (in der Regel vierteljährlich) – cannot detect rapid thermal events
- SF6-gasisolierte Schaltanlage and sealed compartments completely inaccessible
- Labor-intensive – requires trained thermographers, scheduling conflicts reduce coverage
Wireless Temperature Monitoring Systems
Vorteile: No wiring required, relatively simple installation
Significant Drawbacks:
- Battery lifespan 3-5 years requires periodic replacement on energized equipment (high-risk work)
- Electromagnetic interference in high voltage environments causes 5-15% data packet loss
- Measurement accuracy ±2-3°C insufficient for early fault detection
- RF signal attenuation through metal enclosures reduces reliability
- CT-powered sensors fail during low-load conditions (unter 30% rated current)
- Temperature drift over time degrades calibration accuracy
Thermocouple and RTD (PT100) Systeme
Vorteile: Ausgereifte Technologie, low sensor cost
Fundamental Problems:
- Metallic conductors create electrical safety hazards in high voltage applications
- Anfällig für elektromagnetische Störungen – signal corruption in switchgear environments
- Complex insulation coordination required for >10kV applications
- Extensive wiring installation increases labor costs and failure points
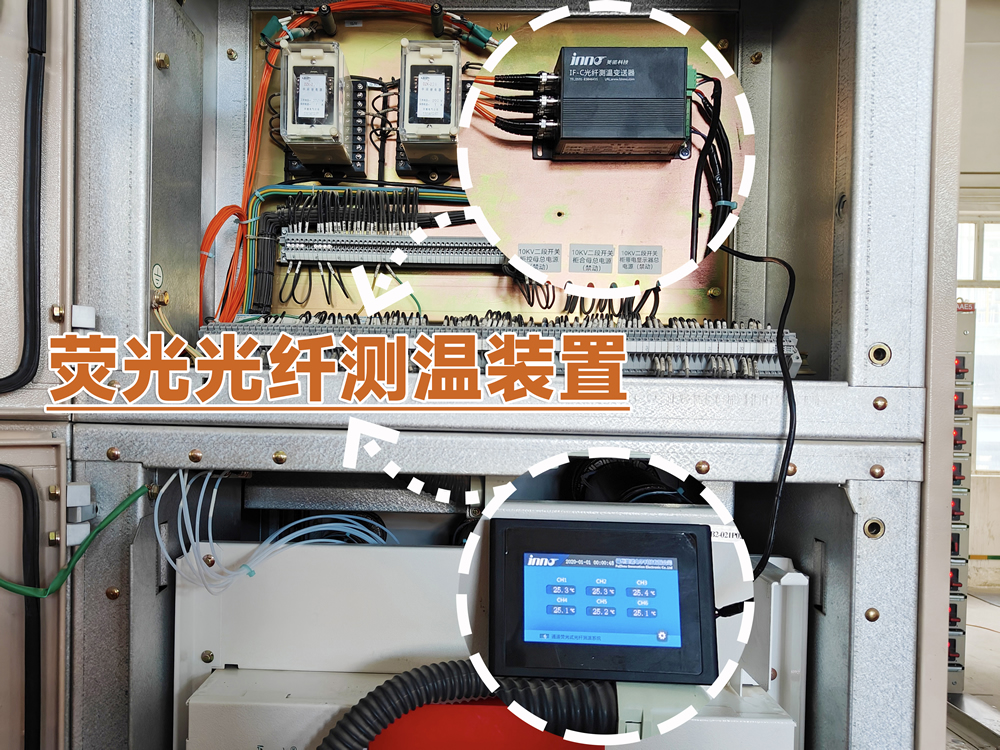
4. Wie geht's? Fluoreszierende faseroptische Temperaturüberwachungssysteme Arbeiten?
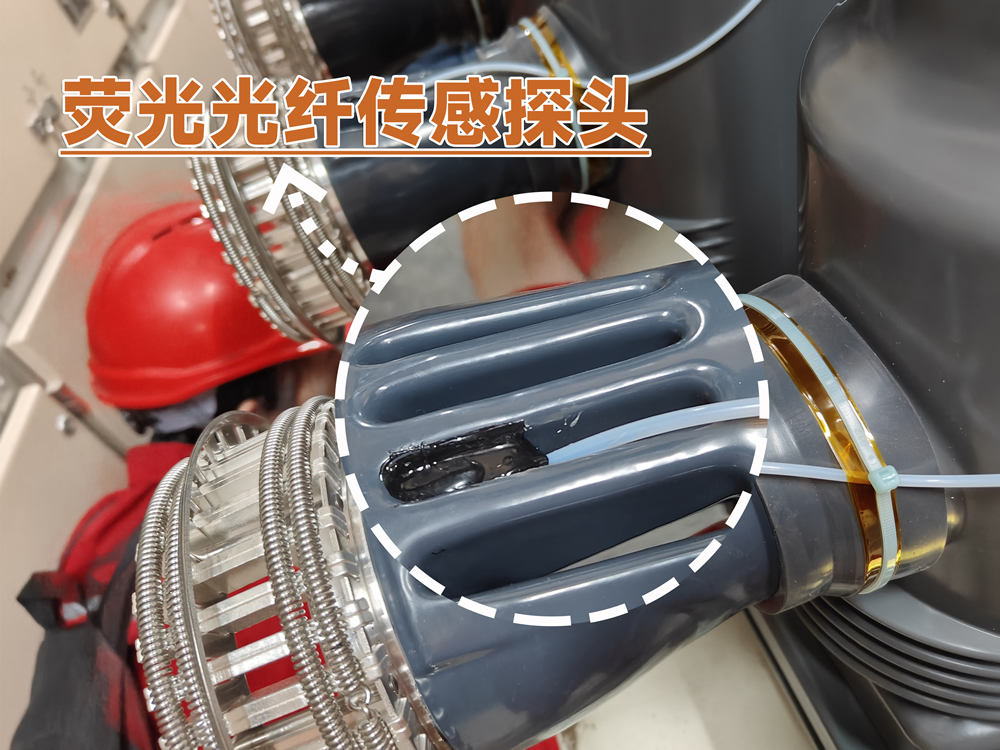
Fluoreszierende faseroptische Temperatursensoren employ rare-earth-doped crystal probes that emit fluorescence when illuminated by excitation light. The fluorescence decay time exhibits a precise, repeatable relationship with absolute temperature – forming the measurement principle.
Measurement Process
- Anregungsphase: LED or laser source transmits blue/UV light through optical fiber to probe
- Fluorescence Generation: Rare-earth phosphors (typically europium or dysprosium compounds) absorb photons and emit red/infrared fluorescence
- Decay Analysis: After excitation ceases, fluorescence intensity decays exponentially with temperature-dependent time constant
- Temperaturberechnung: Demodulator measures decay time with nanosecond resolution, applies calibration curves to determine temperature
Eigensicherheitsmerkmale
This optical measurement technique provides inherent advantages for Zustandsüberwachung von Schaltanlagen:
- Vollständige elektrische Isolierung: Glass fiber contains zero conductive materials – no electrical connection between sensor and measurement electronics
- EMI-Immunität: Light signals unaffected by electric fields, Magnetfelder, or radio frequency interference
- No Metal Components: Ceramic or polymer-encapsulated probes eliminate grounding concerns and voltage stress
- Unidirectional Transmission: Optical signal path prevents external interference coupling
5. What Are the Core Advantages of Fiber Optic Temperature Sensors Compared to Wireless Systems?
Measurement Performance Superiority
Genauigkeit: Fluoreszierende faseroptische Sensoren achieve ±1°C accuracy across -40°C to +260°C range, versus ±2-3°C for wireless systems. This 2-3× improvement enables detection of incipient faults 6-12 months earlier.
Ansprechzeit: Sub-1-second response captures rapid thermal transients during switching operations. Wireless sensors typically exhibit 3-5 second delays, missing critical thermal events.
Langzeitstabilität: Optical measurement principle immune to calibration drift. Independent testing shows <0.5°C deviation over 10-year periods. Wireless sensors demonstrate 1-2°C drift within 2-3 Jahre.
Reliability and Availability
Wartungsanforderungen: Fiber optic systems operate maintenance-free for 25+ years with no consumable components. Wireless systems require battery replacement every 3-5 Jahre – a significant safety and logistics burden in Hochspannungsanlagen.
Datenintegrität: Optical transmission delivers 99.99%+ data availability. Wireless systems experience 5-15% packet loss in electrically noisy environments, creating monitoring blind spots during critical events.
Umweltverträglichkeit: Fiber optic probes function reliably in temperature extremes, hohe Luftfeuchtigkeit, Kondensation, and corrosive atmospheres. Wireless electronics vulnerable to moisture ingress and thermal stress.
Safety and Compliance
Spannungsfestigkeit: Tested to >100kV voltage, faseroptische Temperatursensoren mount directly on energized 500kV components. Wireless sensors limited to lower voltage levels due to electronic components.
Sicherheit vor Lichtbogenüberschlägen: Complete electrical isolation eliminates potential ignition sources. Critical for hazardous area installations and explosive atmosphere environments.
Gesamtbetriebskosten
While fiber optic systems exhibit higher initial equipment costs ($800-1,200 per channel vs. $200-400 for wireless), total 20-year ownership costs favor fiber optics:
- Zero battery replacement labor and materials
- No outage windows required for sensor maintenance
- Lower false alarm rates reduce operations costs
- Extended equipment life through earlier fault detection
Industry analysis demonstrates fiber optic total cost of ownership approximately 1/3 Zu 1/5 of wireless alternatives over equipment lifespan.
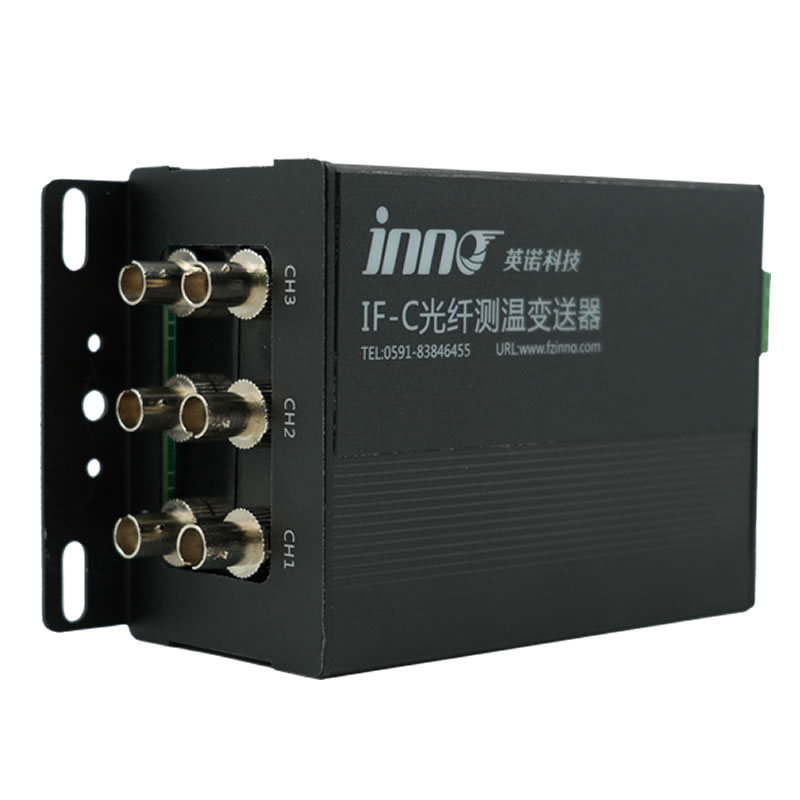
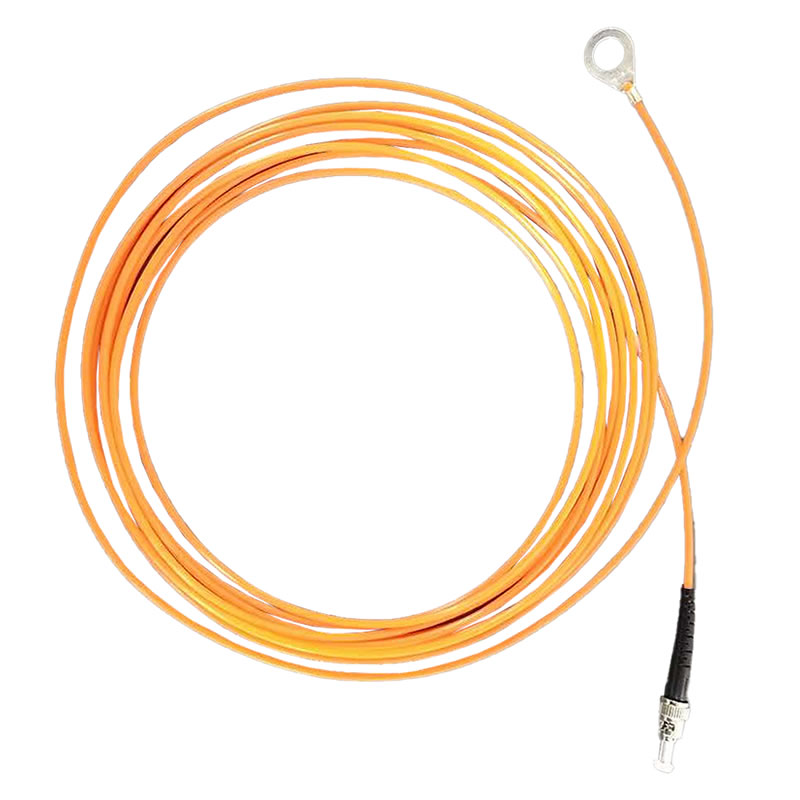
6. What Technical Specifications Define Fluoreszierende faseroptische Temperaturfühler?
Als Führender fiber optic temperature monitoring system manufacturer, we provide detailed specifications for informed system selection:
Temperaturmessbereich
-40°C bis +260°C continuous operation covers all Schaltanlage applications including extreme arctic installations and high-temperature industrial processes. Custom ranges available for specialized requirements.
Messgenauigkeit
±1°C absolute accuracy maintained across full measurement range. Repeatability ±0.5°C enables reliable trend analysis and early anomaly detection.
Ansprechzeit
Unter 1 zweite (T90) from temperature step change to 90% of final reading. Critical for capturing transient thermal events during circuit breaker operations, fault currents, and load switching.
Fiber Optic Cable Length
0-80 Meter standard transmission distance between probe and demodulator unit. Multimode fiber supports installations where demodulator located in remote control rooms or separate equipment areas. Custom lengths up to 150 meters available.
Probe Physical Dimensions
2-3mm Durchmesser standard probe size fits within tight clearances on Sammelschienenverbindungen, Leistungsschalterklemmen, und Kabelschuhe. Custom probe geometries available including flat-pad designs for large contact surfaces and needle probes for confined spaces.
Elektrische Isolierung
Ceramic or glass-reinforced polymer encapsulation provides complete electrical isolation. Withstand voltage >100kV gemäß IEC 60664-1 testing protocols. Suitable for direct mounting on energized conductors in 500kV-Umspannwerke.
Betriebslebensdauer
Größer als 25 Jahre proven in field deployments since 1990s. Rare-earth phosphors exhibit no degradation under continuous excitation. Fiber optic cable rated for >40-Jahr Lebensdauer.
System Channel Capacity
1-64 Kanäle per demodulator unit with modular configuration. Systems scalable from single-panel monitoring to complete substation coverage using distributed demodulator architecture.
Kommunikationsschnittstelle
RS485 Modbus RTU/TCP standard protocol enables integration with SCADA systems, SPS, and building management platforms. Optional protocols: IEC 61850, Profibus DP, DNP3, OPC UA.
Anpassungsoptionen
All parameters customizable based on application requirements including extended temperature ranges, specialized probe mounting hardware, explosionsgeschützte Gehäuse (ATEX, IECEx), and custom communication protocols.
7. How Are Temperature Monitoring Points Configured in High Voltage Switchgear?
Hochspannungsschaltanlage (110kV-500kV) monitoring strategies prioritize current-carrying contacts and connections where thermal anomalies develop:
Circuit Breaker Moving and Fixed Contacts
Installieren faseroptische Temperaturfühler on both stationary and moving contact assemblies. In SF6 puffer-type breakers, probes mount on contact fingers or tulip contacts. Rotating arc contacts require specialized flexible fiber assemblies. Typische Installationsmonitore 2-4 points per pole (6-12 points for three-phase).
Busbar Joints and Connection Bars
Monitor all bolted busbar connections, particularly at expansion joints and phase-to-phase crossovers. Aluminum busbar installations require higher monitoring density due to cold-flow characteristics. Empfohlen: one sensor per connection point in critical feeders, ein Sensor pro 3-4 connections in non-critical circuits.
Disconnect Switch Contact Blades
Isolator switches typically feature knife-blade contacts entering jaw-type receivers. Install probes on both blade tip and jaw contact surfaces. Pantograph-type disconnects require monitoring at pivoting joints and sliding contact points.
Cable Terminations and Bushings
Monitor cable lug connections to Leistungsschalter terminals and busbar takeoff points. Outdoor terminations experience greater temperature fluctuation requiring baseline establishment. Wall bushing installations monitor both indoor and outdoor terminals.
GIS/SF6 Switchgear Internal Components
Gasisolierte Schaltanlage presents unique challenges – sensors must penetrate sealed enclosures. Probes route through epoxy feedthroughs or modified inspection ports. Monitor moving contacts, sliding contacts, and busbar joints within gas compartments. Typical 145kV GIS bay: 12-16 temperature monitoring points.
Instrument Transformer Connections
Stromwandler (CT) und Spannungswandler (VT) secondary connections monitored in critical metering and protection applications. Primary connections in outdoor substations subject to environmental exposure require monitoring.
8. What Are the Critical Monitoring Locations in Medium Voltage Switchgear (10kV-35kV)?
Medium voltage switchgear comprises the largest installed base globally. Standard monitoring configurations include:
10kV Metal-Clad Switchgear
Drawer-type or fixed circuit breakers with separate busbar, Leistungsschalter, and cable compartments:
- Sammelschienenverbindungen: Hauptsammelschienenverbindungen, branch connections to circuit breaker stabs (2-3 Sensoren pro Schacht)
- Circuit Breaker Terminals: Load-side and line-side terminals, particularly on high-current feeders >400A (2 sensors per breaker)
- Kabelanschlüsse: Cable lug connections to breaker or busbar, heat-shrink termination body surface (1-2 sensors per cable)
Ring Main Units (RMU)
Compact Schaltanlage for distribution networks require strategic monitoring:
- Load Break Switches: Moving and fixed contacts in both ring and transformer feeder positions
- Busbar Tees: Three-way busbar junctions where ring conductors connect
- Cable Boxes: Separable connector interfaces and cable terminations
Typical 12kV RMU installation: 8-12 temperature points for comprehensive coverage.
C-GIS (Compact Gas-Insulated Switchgear)
SF6-insulated compact switchgear combines advantages of air-insulated and GIS technologies:
- Internal Contacts: Fiber probes route through sealed feedthroughs to monitor circuit breaker and switch contacts
- Sammelschienenverbindungen: Bolted joints within gas compartments
- External Terminations: Cable box connections and transformer links
Vacuum Circuit Breaker Monitoring
Vakuumunterbrecher exhibit unique thermal characteristics. Monitor:
- Vacuum bottle external terminals (contact temperature inference)
- Operating mechanism connections and linkages
- Shunt trip and closing coil connections
35kV Switchgear Configurations
Higher current ratings and larger conductor sizes create different thermal profiles:
- Busbar Chambers: Segregated busbar compartments with higher density connections
- Breaker Mechanisms: Spring-charged or motor-operated mechanisms with higher contact forces
- Outdoor Terminations: Weather-exposed connections requiring environmental compensation
Solid-Insulated Switchgear
Epoxy-resin insulated switchgear eliminates SF6 but creates monitoring challenges:
- Embedded sensors during manufacturing (limited retrofit capability)
- Surface-mounted probes on accessible terminals and connections
- Cable transition points from solid to air insulation
9. Why Do Rectifier Cabinets Require Specialized Temperature Monitoring?
Rectifier cabinets exhibit higher thermal stress than conventional AC distribution equipment due to harmonic currents, DC bus voltage stress, and semiconductor device losses:
Rectifier Bridge Modules
Thyristor or diode bridge assemblies generate significant heat. Monitor:
- Each semiconductor device junction temperature (thermal coupling probes)
- Heatsink base temperatures indicating cooling system performance
- AC input and DC output busbar connections
High-power rectifiers (>500kW) typically require 8-12 temperature points per bridge assembly.
Rectifier Transformer Connections
Harmonic currents increase transformer winding and terminal temperatures:
- Primary Terminals: Input connection lugs experiencing harmonic heating
- Secondary Terminals: Higher current carrying DC output connections
- Tippen Sie auf „Kontakte ändern“.: If transformer includes on-load tap changing
DC Busbar Joints
Direct current creates different contact phenomena than AC:
- Electromigration at connection interfaces increases resistance over time
- Polarity-dependent oxidation patterns
- Higher continuous current density than AC-rated equipment
Empfehlung: Monitor every bolted DC bus connection in systems >100A continuous current.
Filter Capacitor Terminals
Harmonic filtering capacitors carry significant ripple current:
- Terminal connection points susceptible to loosening from vibration
- Internal capacitor temperature inference from terminal measurements
- Early detection of capacitor degradation through temperature trending
Cooling System Integration
Rectifier cabinet monitoring systems should integrate with forced-air or liquid cooling control:
- Fan speed modulation based on component temperatures
- Cooling system failure detection through abnormal temperature rise rates
- Energy optimization by reducing unnecessary cooling
Harmonic Current Monitoring
Beyond temperature, rectifier installations benefit from:
- Current harmonics analysis using Rogowski coil sensors
- Correlation between harmonic content and thermal profiles
- Prediction of transformer and conductor thermal aging
10. What Additional Parameters Should Be Monitored Beyond Temperature?
Umfassend Zustandsüberwachung von Schaltanlagen integrates multiple sensor technologies optimized for specific parameters:
Teilentladung (PD) Überwachung
Detection Methods:
- Ultrasonic Sensors: Detect acoustic emissions from corona discharge, Oberflächenverfolgung, and internal voids. Frequency range 20-100 kHz. Install on exterior panels or directly on bushings/insulators.
- Ultrahochfrequenz (UHF) Sensoren: Electromagnetic emissions in 300MHz-3GHz range. Superior noise discrimination in GIS installations. Requires internal antenna placement.
- Vorübergehende Erdspannung (TEV): Non-intrusive detection via capacitive coupling to enclosure surfaces. Effective screening technique for locating PD sources.
Application Value: PD monitoring detects insulation degradation 6-18 months before thermal or electrical failure. Critical for aged switchgear (>20 years service) and equipment with known insulation weaknesses.
SF6 Gas Density and Purity Monitoring
Intelligent Density Sensors: Replace mechanical density switches with electronic transmitters providing:
- Continuous density measurement (vs. discrete alarm points)
- Temperature-compensated readings
- Leak rate calculation through trend analysis
- Remote communication (4-20mA, Modbus) to SCADA
Gas Purity Analysis: Decomposition product monitoring (SOF2, SO2F2, SO2, H2S) indicates arcing activity and insulation breakdown. Gas chromatography sensors detect contamination at ppm levels.
Feuchtigkeitsüberwachung
Capacitive Humidity Sensors: Monitor relative humidity in air-insulated compartments. Excessive moisture (>60% RH) accelerates corrosion and reduces surface flashover voltage.
Dewpoint Sensors: Kritisch für GIS/C-GIS installations – dewpoint monitoring ensures gas moisture content remains below -20°C to prevent insulator contamination.
Load Current Monitoring
Rogowski Coil Sensors: Lightweight, flexible current sensors providing:
- Non-contact installation (clamp around busbar/cable)
- Wide dynamic range (1A to 10,000A+)
- Harmonic current measurement capability
- No saturation issues like iron-core CTs
Hall Effect Sensors: Direct-reading DC and AC current measurement for rectifier cabinet Anwendungen.
Correlation with Temperature: Current data contextualizes temperature readings – expected load-related temperature rise versus abnormal heating at same current level indicates developing fault.
Circuit Breaker Mechanical Condition Monitoring
Travel Time Measurement: Opening and closing operation duration indicates mechanism degradation, lubrication issues, or contact wear.
Contact Travel Sensors: Linear position transducers measure contact stroke and velocity profile – early detection of mechanical binding or spring degradation.
Schwingungsanalyse: Accelerometers on breaker mechanism detect abnormal vibration patterns indicating loose components or misalignment.
Analyse der Spulenstromsignatur: Monitoring of trip/close coil current waveforms reveals mechanical resistance changes and interlock problems.
11. How Is Multi-Parameter Condition Monitoring System Architecture Designed?
Sensor Layer Architecture
Deploy distributed sensors optimized for each parameter:
- Fluoreszierende faseroptische Sonden for temperature (this document’s focus)
- Ultrasonic/UHF sensors for partial discharge
- Intelligent electronic sensors for SF6, Luftfeuchtigkeit, aktuell
- Mechanical position/vibration transducers
Edge Data Acquisition
Panel-Level Data Concentrators: Industrial edge computing gateways installed per switchgear lineup collect:
- Fiber optic demodulator outputs (temperature channels)
- PD sensor analog/digital signals
- Environmental sensor data
- Breaker mechanism status inputs
Local Processing: Edge devices perform preliminary analysis:
- Threshold alarm generation
- Data compression and buffering
- Protocol conversion for diverse sensors
- Time synchronization across all channels
Kommunikationsinfrastruktur
Fieldbus Integration:
- RS485 Modbus RTU: Standard for industrial reliability, supports up to 32 devices per segment, 1200m maximum distance
- IEC 61850: Substation automation standard enabling peer-to-peer communication and standardized data models
- Profibus DP: Common in European industrial installations
- Ethernet/IP or Modbus TCP: Modern installations with Ethernet infrastructure
SCADA-Integration: Condition monitoring systems interface with existing supervisory control platforms via:
- DNP3 protocol for utility applications
- OPC UA for vendor-neutral industrial integration
- Proprietary SCADA drivers for legacy systems
Centralized Monitoring Platform
On-Premise Software: Dedicated condition monitoring applications providing:
- Real-time parameter visualization and trending
- Multi-parameter correlation analysis
- Automated alarm management and escalation
- Historical data archiving and reporting
- Predictive analytics and maintenance scheduling
Cloud-Konnektivität (Optional): Secure data transmission to cloud platforms for:
- Multi-site fleet monitoring
- Advanced analytics and machine learning
- Mobile access and remote expert consultation
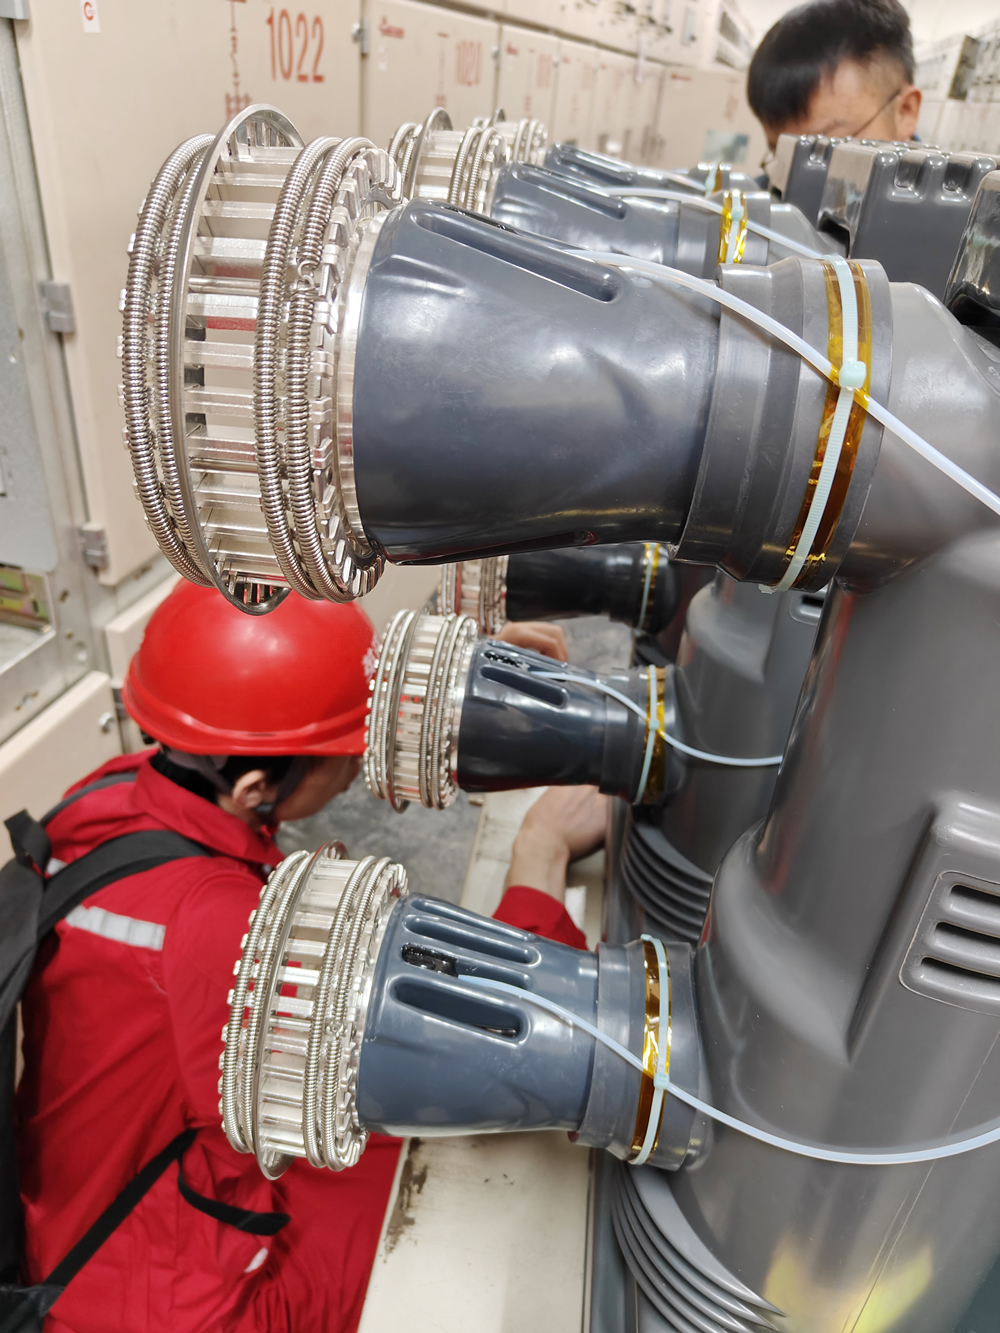
12. What Installation Methods Apply to Live Switchgear Equipment?
Live Working Procedures for Fiber Optic Probe Installation
Planung vor der Installation:
- Arc flash hazard assessment and PPE determination
- Verification of probe compatibility with equipment voltage class
- Preparation of installation-specific work procedures
- Coordination with system operators for load transfer if required
Probe Attachment Methods:
- Adhesive Bonding: High-temperature epoxy or thermal-conductive compounds affix probes to flat busbar surfaces. Surface preparation critical – degrease and abrade contact area.
- Compression Mounting: Spring-loaded clips or saddle clamps hold probes against curved conductors. Stainless steel hardware with electrical insulation.
- Embedded Installation: For new equipment or during major maintenance, probes embedded in connection hardware or molded into contacts.
Glasfaserkabelführung:
- Maintain minimum bend radius (20mm for glass fiber)
- Secure cables away from moving components and sharp edges
- Use cable glands and grommets when penetrating panel walls
- Segregate fiber cables from power wiring in separate raceways
Demodulator Installation Location
Environmental Requirements:
- Temperatur: 0-50°C Umgebungstemperatur (some models -20 to +60°C)
- Luftfeuchtigkeit: <90% RH, nicht kondensierend
- Vibration isolation from switchgear mechanical operations
- Adequate ventilation for convection cooling
Mounting Options:
- DIN rail mounting in control cabinet or relay panel
- Wall-mount enclosure adjacent to switchgear lineup
- 19-inch rack installation in centralized equipment room
System Commissioning and Verification
Sensor Baseline Establishment:
- Record ambient temperature and initial readings for all probes
- Compare readings across similar connection points (phase-to-phase consistency)
- Document equipment loading during baseline measurement
Alarm Threshold Configuration:
- Stage 1 Pre-Alarm: Temperature 10-15°C above baseline (informational logging)
- Stage 2 Warnung: Temperature 20-30°C above baseline (operator notification)
- Stage 3 Alarm: Temperature 40-50°C above baseline or absolute 80°C (maintenance action required)
- Stage 4 Kritisch: Temperatur >90-105°C (immediate load transfer or shutdown)
Communication Testing:
- Verify data polling from SCADA or monitoring software
- Test alarm transmission and acknowledgment procedures
- Confirm time synchronization across distributed sensors
13. Global Customer Application Case Studies
Fallstudie 1: 500kV GIS Substation – Utility Power Transmission
Projektumfang: National grid utility retrofitted faseroptische Temperaturüberwachung to existing 500kV gas-insulated substation experiencing historical busbar connection failures.
Systemkonfiguration:
- 96 fluorescent fiber optic temperature sensors across 6 GIS bays
- Überwachungspunkte: Kontakte des Leistungsschalters, Sammelschienenverbindungen, disconnect switch interfaces
- 3 demodulator units (32 Kanäle jeweils) mit IEC 61850 Integration
Installation Methodology: Sensors installed during routine maintenance outages using epoxy feedthroughs through SF6 compartment walls. Zero modifications to primary equipment.
Operative Ergebnisse:
- Detected developing fault in busbar bolted joint 8 months before predicted failure
- Temperature trending revealed gradual 15°C rise over 6-month period
- Scheduled maintenance during planned outage prevented unplanned 500kV line trip
- Estimated avoided cost: $2.5M (Geräteaustausch + emergency mobilization + lost transmission revenue)
Fallstudie 2: Data Center 10kV Medium Voltage Distribution
Customer Requirements: Hyperscale data center operator required continuous monitoring of redundant 10kV Schaltanlage feeding UPS systems and generator transfer switches.
System Design:
- 48 temperature monitoring points across main-tie-main switchgear configuration
- Combined monitoring: Glasfasertemperatur + Rogowski coil current sensors
- Integration with building management system via Modbus TCP
Key Monitoring Locations:
- Utility service entrance cable terminations
- Generator breaker and transfer switch contacts
- UPS feeder breaker terminals
- Main busbar tie connections
Documented Benefits:
- Correlation analysis between load current and temperature established predictive thermal models
- Identified cable termination with 12°C temperature differential versus other phases – preventive retorquing avoided potential failure
- Systemverfügbarkeit verbessert von 99.95% Zu 99.99% after monitoring implementation
Fallstudie 3: Steel Mill Rectifier System – Industrial Application
Application Environment: Electric arc furnace rectifier cabinet supplying 50MW DC power to smelting operations. Harsh environment with high electromagnetic interference, Staub, und Vibration.
Monitoring Solution:
- 64-channel fiber optic system monitoring thyristor bridge modules, DC busbar connections, und Transformatorklemmen
- Immunity to 50kA fault current EMI critical for sensor reliability
- Combined temperature and harmonic current monitoring
Operational Experience:
- Detected cooling fan failure through abnormal heatsink temperature rise pattern
- Identified loose DC bus bolted connection developing 35°C hotspot at 80% laden
- Prevented forced outage that would cost $150,000/hour in lost production
- Maintenance scheduling optimized based on actual thermal condition versus time-based intervals
Fallstudie 4: Offshore Wind Farm 35kV Subsea Cable Terminations
Unique Challenges: Offshore wind turbine platforms with limited access and extreme marine environment. Cable terminations subjected to thermal cycling and moisture exposure.
Monitoring Implementation:
- 32 fiber optic sensors monitoring subsea cable/switchgear interface terminations
- Satellite communication of monitoring data to onshore control center
- Probe encapsulation in marine-grade epoxy for corrosion resistance
Value Delivered:
- Remote condition assessment eliminates costly and weather-dependent offshore crew visits
- Early detection of cable termination degradation enables maintenance during planned weather windows
- 25-year sensor lifespan aligns with expected platform service life
Fallstudie 5: Semiconductor Fab 480V/13.8kV Distribution
Anwendungskritikalität: Semiconductor manufacturing requires absolute power reliability – single voltage sag can scrap entire production lot ($500K-2M loss).
Comprehensive Monitoring:
- Temperature monitoring on all 480V main distribution busbar and 13.8kV utility service switchgear
- Integration with facility power quality monitoring system
- Automated alarm escalation procedures
Business Impact:
- Zero unplanned power outages since monitoring implementation (36-month track record)
- Proactive component replacement based on thermal trending
- Insurance premium reduction achieved through demonstrated reliability improvement
Häufig gestellte Fragen (FAQ)
FAQ 1: What is the initial investment cost for a fluorescent fiber optic temperature monitoring system? How can I quickly obtain a quotation?
The initial investment for a Glasfaser-Temperaturüberwachungssystem varies based on several factors:
System Scale: Number of monitoring points determines demodulator capacity requirements. A typical 10kV Mittelspannungsschaltanlage installation monitoring 8-16 kritische Verbindungen (Leistungsschalterklemmen, Sammelschienenverbindungen, Kabelendverschlüsse) requires one 16-channel demodulator unit.
Kostenstruktur:
- Demodulator Unit: $3,000-$8,000 depending on channel count (1-64 Kanäle) and communication options
- Fluorescent Fiber Optic Probes: $150-$300 per sensor including fiber cable
- Installation Accessories: Mounting hardware, Anschlusskästen, Kabelmanagement – etwa 15-20% of equipment cost
- Engineering and Commissioning: System design, Montageüberwachung, Testen – varies by project complexity
Typical Project Investments:
- Small installation (8-Punktüberwachung, single switchgear lineup): $5,000-$8,000 USD
- Medium installation (32-Punktüberwachung, multiple panels): $12,000-$20,000 USD
- Large substation (100+ Punkte, multiple demodulators): $40,000-$80,000 USD
Obtaining Customized Quotation: Contact our application engineering team through www.fjinno.net with the following information for rapid quote generation:
- Switchgear type and voltage class (10kV, 35kV, 110kV, usw.)
- Number of panels or bays requiring monitoring
- Preferred monitoring points (Kontakte des Leistungsschalters, Sammelschienenverbindungen, Kabelendverschlüsse)
- Existing SCADA/communication infrastructure
- Project timeline and any specific technical requirements
We provide detailed quotations within 24-48 hours including equipment specifications, installation recommendations, and lifecycle cost analysis demonstrating total ownership value.
FAQ 2: Our switchgear is aging equipment. Can we retrofit a condition monitoring system? How much downtime is required?
Fluoreszierende faseroptische Sensoren are ideal for retrofitting legacy switchgear installations – this represents 60-70% of our project portfolio.
Retrofit Compatibility:
- Minimal Physical Modifications: Compact 2-3mm diameter probes fit within existing clearances. No structural alterations to primary equipment required.
- Non-Invasive Installation: Sensors attach to busbar surfaces, cable lugs, and breaker terminals using adhesive bonding or mechanical clips. Zero drilling or welding on energized components.
- Adaptable to Any Vintage: Successfully deployed on switchgear manufactured from 1960s to present. Compatible with air-insulated, SF6, and vacuum technologies.
Downtime Requirements:
Typical Installation Duration per Switchgear Panel:
- Pre-outage preparation (Faserführung, demodulator mounting): Performed energized – zero downtime
- De-energization for probe installation: 2-4 hours depending on number of monitoring points
- System testing and re-energization: 30-60 Minuten
Total Outage Window: 3-5 hours per switchgear bay – typically accommodated during routine maintenance schedules or off-peak periods.
Live-Working Options: For critical infrastructure where outages are prohibitively expensive, our certified technicians can install sensors on energized equipment using hot-stick methods and appropriate PPE. This approach eliminates downtime but requires specialized procedures and safety protocols.
Phased Implementation: Large installations can be commissioned in stages – monitoring most critical feeders first, then expanding to complete coverage over multiple maintenance windows. System remains operational during phased deployment.
Aging Equipment Benefits: Retrofit monitoring is particularly valuable for aged switchgear (>20 years service) where failure probability increases exponentially. Temperature monitoring extends equipment service life 5-10 years through condition-based maintenance versus premature replacement.
FAQ 3: Will the monitoring system integrate with our existing automation infrastructure? Which communication protocols are supported?
Unser fiber optic temperature monitoring demodulators support comprehensive protocol libraries ensuring compatibility with virtually all SCADA, DCS, SPS, und Gebäudemanagementsysteme:
Standard Communication Interfaces:
RS485 Modbus RTU: Default configuration – most widely deployed industrial protocol. Supports multi-drop topology (bis zu 32 devices per segment), 1200-meter maximum cable distance, and robust error checking. Ideal for smaller installations and direct PLC connection.
Ethernet-Based Protocols:
- Modbus TCP/IP: Ethernet variant of Modbus enabling integration with modern switched network infrastructure
- IEC 61850: International standard for substation automation – provides standardized data models, peer-to-peer communication, and event-driven reporting. Required for utility grid applications in many jurisdictions.
- OPC UA (Unified Architecture): Vendor-neutral industrial communication standard supporting secure data exchange and complex information models
Optional/Custom Protocols:
- DNP3: Common in North American utility applications – supports time-stamped data and event reporting
- Profibus DP: Prevalent in European industrial automation
- BACnet: Building automation protocol for commercial facility integration
- MQTT: Lightweight messaging protocol for IoT and cloud connectivity
Integration Methodology:
- System Survey: Our engineers assess your existing automation architecture (SCADA vendor, PLC types, network topology)
- Protocol Selection: Recommend optimal communication method based on bandwidth requirements, network security policies, and real-time performance needs
- Datenzuordnung: Configure monitoring system data points to align with your naming conventions and SCADA database structure
- Testing and Validation: Comprehensive integration testing including alarm transmission, data accuracy verification, and failover scenarios
Typical Integration Timeline: 1-3 days for standard protocols (Modbus, IEC 61850). Custom protocols may require 1-2 weeks for development and testing.
Remote Access Capability: Systems can be configured for secure remote monitoring via VPN, cellular gateways, or cloud platforms – enabling multi-site fleet monitoring and remote expert diagnostics.
FAQ 4: What technical support and warranty coverage do you provide if sensors or equipment fail?
Als Führender fiber optic temperature monitoring system manufacturer, we provide comprehensive support throughout equipment lifecycle:
Warranty Coverage:
Standard Warranty: 3 years comprehensive coverage on all system components including:
- Fiber optic demodulator units (electronics, power supplies, Kommunikationsmodule)
- Fluorescent fiber optic temperature probes and fiber optic cables
- Mounting hardware and accessories
Extended Warranty Options: 5-year and 10-year extended coverage available – particularly valuable for remote installations where equipment access is difficult.
Coverage Terms:
- Zero-cost replacement of defective components
- Expedited shipping for critical installations (next-day air freight available)
- On-site technical support for warranty repairs if required
Technische Supportdienste:
24/7 Remote Diagnostics:
- Phone and email support with average 2-hour response time
- Remote system access (with customer authorization) for troubleshooting
- Real-time guidance for operators during fault conditions
On-Site Service:
- Dispatch of field service engineers within 48 hours for critical installations
- Preventive maintenance visits (annual or bi-annual recommended)
- System health assessments and optimization
Sensor Replacement Procedure:
In the rare event of fiber optic probe failure:
- Remote diagnosis confirms sensor vs. demodulator issue
- Replacement probe shipped within 24 Std.
- Installation completed during next available maintenance window (typischerweise 2-4 hour outage)
- System recalibration and testing validates functionality
Reliability Statistics: Field failure rate <0.5% annually for fiber optic probes and <1% for demodulator electronics based on 15+ years installed base data. Most “Misserfolge” traced to installation errors or external damage rather than component defects.
Schulung und Dokumentation:
- Comprehensive operation and maintenance manuals
- On-site or web-based training for maintenance personnel
- Video troubleshooting guides and knowledge base
Spare Parts Stocking: For large installations or critical infrastructure, we recommend maintaining spare sensor inventory and can provide consignment stock programs.
FAQ 5: We’re uncertain which parameters require monitoring for our specific switchgear. How can we obtain professional engineering guidance?
Optimal Zustandsüberwachung von Schaltanlagen system design requires application-specific engineering analysis. We provide complimentary consultation services:
Free Application Assessment Services:
Remote Consultation (No Site Visit Required):
- Provide switchgear specifications (Hersteller, Modell, Spannungsklasse, current ratings)
- Review existing maintenance records and failure history
- Define criticality level and acceptable outage risk
- Receive preliminary monitoring point recommendations within 2-3 Werktage
On-Site Survey (For Complex or Large Installations):
- Thermal imaging baseline assessment using calibrated infrared cameras
- Visual inspection of switchgear condition and accessibility
- Evaluation of existing instrumentation and communication infrastructure
- Detailed monitoring system design with sensor location drawings
Engineering Deliverables:
- Customized Monitoring Strategy: Recommended parameters (Temperatur, Teilentladung, SF6 density, usw.) based on equipment type, age, and operational profile
- Sensor Quantity and Placement: Optimized monitoring point selection balancing coverage comprehensiveness versus budget constraints
- System Architecture Proposal: Demodulator configuration, communication topology, integration approach with existing automation systems
- Kosten-Nutzen-Analyse: Projected reduction in failure probability, maintenance cost savings, and avoided outage expenses
- Implementation Plan: Phased deployment options, Ausfallanforderungen, installation timeline
Typical Monitoring Recommendations by Application:
Utility Substations: Temperatur + partial discharge monitoring for comprehensive insulation and thermal condition assessment
Industrieanlagen: Temperatur + load current monitoring for correlation analysis and predictive maintenance
Commercial Buildings: Temperature monitoring focused on critical feeders with optional power quality integration
Rechenzentren: Multiparameter-Überwachung (Temperatur, aktuell, Luftfeuchtigkeit) with redundant communication paths
Engagement Process:
Contact our application engineering team via www.fjinno.net with basic project information:
- Facility type and location
- Switchgear inventory (Spannungsniveaus, number of panels)
- Specific concerns or historical failure modes
- Project timeline and budget parameters
Innerhalb 24 Std., you’ll receive initial consultation scheduling and preliminary guidance. Detailed assessment proposals provided within one week.
No-Obligation Assessment: Engineering consultation services provided at no cost for qualified projects. We invest in proper system design because correctly specified monitoring systems deliver maximum value and customer satisfaction.
Still Have Questions About Switchgear Condition Monitoring?
Our technical team is ready to help you design the optimal faseroptische Temperaturüberwachung solution for your specific application. Whether you’re monitoring Hochspannungsschaltanlagen, medium voltage distribution, Gleichrichterschränke, or specialized industrial equipment, we provide expert guidance from initial consultation through long-term operational support.
Contact us today through www.fjinno.net für:
- Free switchgear condition monitoring system assessment
- Customized monitoring point recommendations
- Detailed technical specifications and quotations
- Application engineering support and system design
Don’t wait for equipment failure – implement proactive condition monitoring today!
Haftungsausschluss
Die in diesem Artikel bereitgestellten Informationen dienen ausschließlich allgemeinen Bildungs- und Informationszwecken. While we strive to ensure accuracy based on current industry standards and best practices as of January 2026, specific Zustandsüberwachung von Schaltanlagen requirements vary significantly based on equipment manufacturer, Betriebsumgebung, regulatory jurisdiction, and application criticality.
Technische Spezifikationen for fluorescent fiber optic temperature monitoring systems (including measurement ranges, Genauigkeit, Kanalkapazität, und Kommunikationsprotokolle) represent typical performance parameters. Actual specifications should be verified through detailed product datasheets and confirmed during project engineering phase.
Installationsverfahren described in this guide are general recommendations. All electrical work on Hochspannungsschaltanlagen must be performed by qualified personnel following applicable safety regulations (NFPA 70E, IEEE 1584, local electrical codes), manufacturer instructions, and facility-specific procedures. Arc flash hazard analysis and appropriate personal protective equipment are mandatory for all energized work.
Systemintegration capabilities depend on compatibility verification with specific SCADA, DCS, or automation platforms. Protocol support should be confirmed during procurement specification.
Economic analyses and failure statistics cited represent industry averages compiled from multiple sources. Actual costs, failure rates, and monitoring system benefits vary based on equipment condition, operating practices, and facility-specific factors.
This article does not constitute professional engineering advice for your specific installation. For safety-critical applications or complex projects, consult with licensed electrical engineers and certified switchgear monitoring specialists.
Product and company names mentioned may be trademarks of their respective owners. No endorsement or affiliation is implied unless explicitly stated.
Regulatory compliance responsibility remains with the equipment owner/operator. Verify that proposed monitoring systems meet applicable standards (IEC, IEEE, ANSI, local regulations) for your jurisdiction and application.
For project-specific technical guidance and professional recommendations tailored to your switchgear condition monitoring requirements, please contact our application engineering team through www.fjinno.net.
Zuletzt aktualisiert: Januar 19, 2026

Faseroptischer Temperatursensor, Intelligentes Überwachungssystem, Verteilter Glasfaserhersteller in China
 |
 |
 |